Intraday Volume Profile [BigBeluga]The Intraday Volume Profile aims to show delta volume on lower timeframes to spot trapped shorts at the bottom or trapped longs at the top, with buyers pushing the price up at the bottom and sellers at the top acting as resistance.
🔶 FEATURES
The indicator includes the following features:
LTF Delta precision (timeframe)
Sensibility color - adjust gradient color sensitivity
Source - source of the candle to use as the main delta calculation
Color mode - display delta coloring in different ways
🔶 DELTA EXAMPLE
In the image above, we can see how delta is created.
If delta is positive, we know that buyers have control over sellers, while if delta is negative, we know sellers have control over buyers.
Using this data, we can spot interesting trades and identify trapped individuals within the candle.
🔶 HOW TO USE
In the image above, we can see how shorts are trapped at the bottom of the wick (red + at the bottom), leading to a pump also called a "short squeeze."
Same example as before, but with trapped longs (blue + at the top).
This can also work as basic support and resistance, for example, trapped shorts at the bottom with positive delta at the bottom acting as strong support for price.
Users can have the option to also display delta data within the corresponding levels, showing Buyers vs Sellers for more precise trading ideas.
NOTE:
User can only display the most recent data for the last 8 buyers and sellers.
It is recommended to use a hollow candle while using this script.
Cari dalam skrip untuk "新泻天鹅vs川崎前锋"

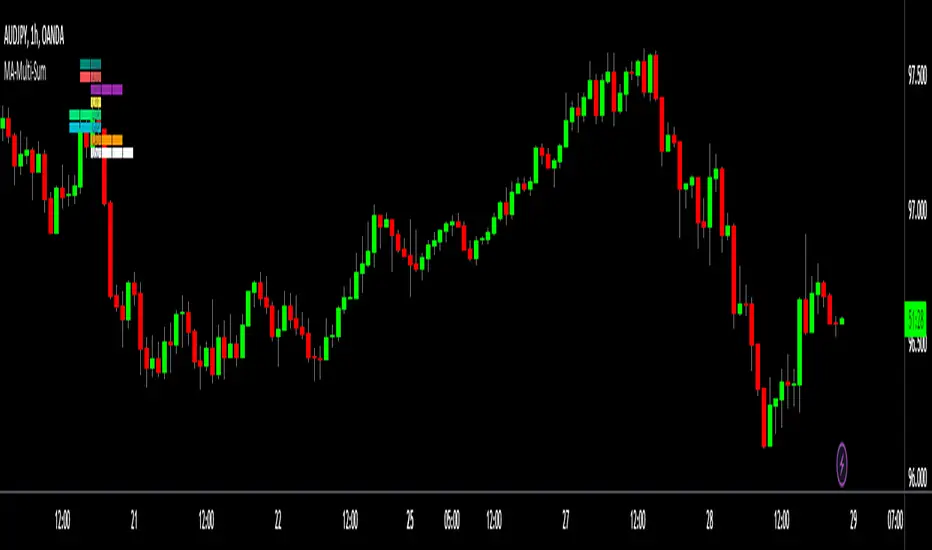
SMA Direction Cross Currency SummaryThis script shows the average SMA direction of each of the majors and crosses when compared to each other. The more blocks to the right the stronger the currency on that timeframe. The more blocks to the left the weaker the currency.
I'm finding it useful to quickly know the average flow of movement for each currency on the higher timeframes and then focus on that for a daily trade. I also like how i dont have to keep jumping between instruments to stay upto date. I'm not a 'real' trader so I have very limited time and attention for this so this does the job as a crude replacement for trawling all the chart each day.
The currencies compared are:
-NZD
-AUD
-JPY
-CHF
-EUR
-GBP
-CAD
-USD
The way it is calculated is that its based on the 20 SMA. For each currency vs the other crosses:
if the SMA is pointing up and price is higher = +2
if the SMA is pointing up and price is lower = +1
if the SMA is pointing down and price is higher = -2
if the SMA is pointing down and price is lower = -1
So if we where considering GBP. We would do that for GBPNZD, GBPAUD, GBPPJY, GBPCHF, GBPEUR, GBPCAD, GBPUSD. We would then consider this sum against all the currencies to understand the relative strength.
Due to the limit on how many instruments can be called in a single indicated you need to load it for each currencies so 8 currencies = 8 indicators.
Its a bit of a frankinstien script - it just throw it togeather so its probably got redundant code etc. Its built around 20 SMA - no idea what would happens when you change that.
Relative Volume Candles [QuantVue]In the words of Dan Zanger, "Trying to trade without using volume is like trying to drive a few hundred miles without putting gas in your tank. Trying to trade without chart patterns is like leaving without having an idea how to get there!"
Volume tends to show up at the beginning and the end of trends. As a general rule, when a stock goes up on low volume, it's seen as negative because it means buyers aren't committed. When a stock goes down on low volume, it means that not many people are trying to sell it, which is positive.
The Relative Volume Candles indicator is based on the Zanger Volume Ratio and designed to help identify key volume patterns effortlessly, with color coded candles and wicks.
The indicator is designed to be used on charts less than 1 Day and calculates the average volume for the user selected lookback period at the given time of day. From there a ratio of the current volume vs the average volume is used to determine the candle’s colors.
The candles wicks are color coded based on whether or not the volume ratio is rising or falling.
So when is it most important to have volume? When prices break out of a consolidation pattern like a bull flag or cup and handle pattern, volume plays a role. When a stock moves out of a range, volume shows how committed buyers are to that move.
Note in order to see this indicator you will need to change the visual order. This is done by selecting the the 3 dots next to the indicator name, scrolling down to visual order and selecting bring to front.
Indicator Features
🔹Selectable candle colors
🔹Selectable ratio levels
🔹Custom lookback period***
***TradingView has a maximum 5,000 bar lookback for most plans. If you are on a lower time frame chart and you select a lookback period larger than 5,000 bars the indicator will not show and you will need to select a shorter lookback period or move to a higher time frame chart.
Give this indicator a BOOST and COMMENT your thoughts!
We hope you enjoy.
Cheers!

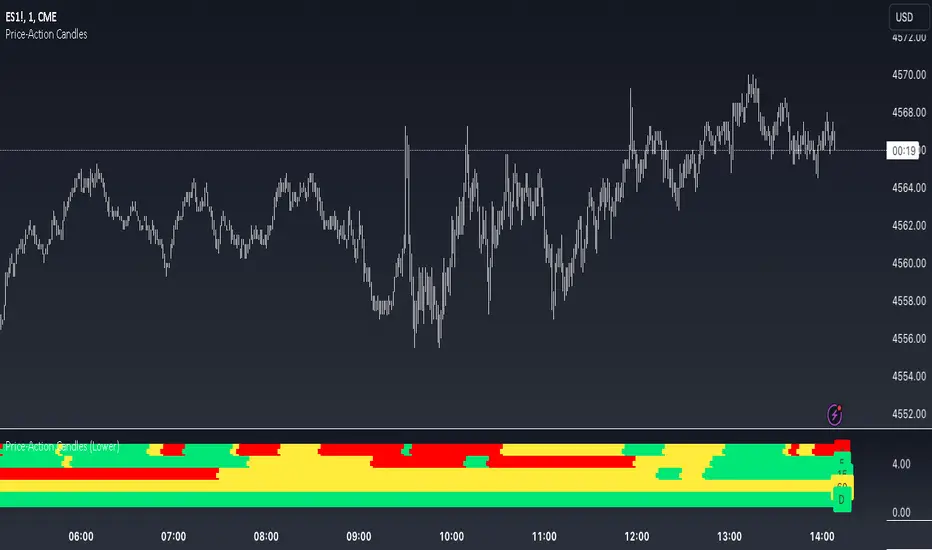
Price-Action Candles (Lower)What is a swing high or swing low?
Swing highs and lows are price extremes. For example say we set our swing length to 5. A candle that is a swing high with a swing length of 5 will have 5 bars to the left that are lower and 5 bars to the right that are lower. A candle that is a swing low with a swing length of 5 will have 5 bars to the left that are higher and 5 bars to the right that are higher.
How is the trend coloring calculated?
The trend coloring is calculated the exact same way as our trend candles study... by storing and comparing historical swing lows and swing highs.
The pinescript code goes as follows:
The pinescript code goes as follows:
var int trend = na
trend := ((hh and high >= psh) or close > csh) ? 1 : ((ll and low <= psl) or close < csl) ? -1 : lh or hl ? 0 : trend
What does that gibberish mean?
-Trend can be GREEN IF
- We have a higher high (current swing high is greater than the previous swing high) and the high is greater than the previous swing high
- OR The current close is greater than the current swing high
-Trend can be RED IF
- We have a lower low (current swing low is less than the previous swing low) and the low is less than the previous swing low
- OR The current close is less than the current swing low
-Trend can be YELLOW IF
- We have a new swing high and the new swing high is less than the previous swing high
- OR We have a new swing low and the new swing low is greater than the previous swing low
If none of the conditions above are true then we continue with whatever color the previous bar was.
What is repainting?
Repainting is "script behavior causing historical vs realtime calculations or plots to behave differently." That definition comes directly from Tradingview. If you want to read the full explanation you can visit it here www.tradingview.com . The price-action candles use swing highs and swing lows which need bars to the left (past) and bars to the right ("future") in order to confirm the swing level. Because of the need to wait for confirmation for swing levels the plot style can be repainting. The Price-Action Candles (Lower) indicator, or this indicator, has no repainting anywhere. We opt to not shift back the candle coloring which causes the repainting, but it is relevant to discuss since this indicator's sibling (Price-Action Candles) can have repainting labels.
Repaint
Here the labels are shifted back the price-action length. Repainting is not present in the Price-Candles (Lower) study, but can be found in this indicator's sibling (Price-Action Candles).
Non-Repaint
Here the labels are not shifted back or "repainted". Repainting is not present in the Price-Candles (Lower) study, but can be found in this indicator's sibling (Price-Action Candles).
Multi-timeframe Analysis
The users can view multi-timeframe historical price action trend via this lower study. Each timeframe is plotted as its own on the lower pane and you can determine what timeframe it is by the label next to the plot.
More examples
Pair the Price-Action Candles (Lower) indicator with our main price indicator that colors candles based on trend and can show price action labels.
Price-Action CandlesWhat is a swing high or swing low?
Swing highs and lows are price extremes. For example say we set our swing length to 5. A candle that is a swing high with a swing length of 5 will have 5 bars to the left that are lower and 5 bars to the right that are lower. A candle that is a swing low with a swing length of 5 will have 5 bars to the left that are higher and 5 bars to the right that are higher.
How are the trend candles calculated?
The trend candles are calculated by storing and comparing historical swing lows and swing highs.
The pinescript code goes as follows:
The pinescript code goes as follows:
var int trend = na
trend := ((hh and high >= psh) or close > csh) ? 1 : ((ll and low <= psl) or close < csl) ? -1 : lh or hl ? 0 : trend
What does that gibberish mean?
-Candle can be GREEN IF
- We have a higher high (current swing high is greater than the previous swing high) and the high is greater than the previous swing high
- OR The current close is greater than the current swing high
-Candle can be RED IF
- We have a lower low (current swing low is less than the previous swing low) and the low is less than the previous swing low
- OR The current close is less than the current swing low
-Candle can be YELLOW IF
- We have a new swing high and the new swing high is less than the previous swing high
- OR We have a new swing low and the new swing low is greater than the previous swing low
If none of the conditions above are true then we continue with whatever color the previous bar was.
What is repainting?
Repainting is "script behavior causing historical vs realtime calculations or plots to behave differently." That definition comes directly from Tradingview. If you want to read the full explanation you can visit it here www.tradingview.com . The price-action candles use swing highs and swing lows which need bars to the left (past) and bars to the right ("future") in order to confirm the swing level. Because of the need to wait for confirmation to for swing levels the plot style can be repainting. With the price-action candles indicator the only repainting part of the indicator is the labels. The price-action candles themselves WILL NOT REPAINT. The labels however can be set to repaint or not depending on the user preference. If the user opts to use repainting then the label location is shifted back by the length of the price-action. So if the "Price-Action Length" input is set to 10, and the user wants repainting, the swing high/low label will be shifted back 10 bars. If the user opts for no repainting, the label will not be shifted and instead show on the exact bar the swing level was confirmed.
Examples Below.
Repaint
Here the labels are shifted back the price-action length.
Non-Repaint
Here the labels are not shifted back because the input setting is set to not repaint.
Multi-timeframe Analysis
The users can view the trend from multiple different timeframes at once with a table displayed at the bottom of their charts. The timeframe can be lower or higher than the chart timeframe.
More examples
Be on the lookout for the Price Action Candles (Lower) indicator where you can view the multi-timeframe labels on a lower price grid in order to see the history over time!

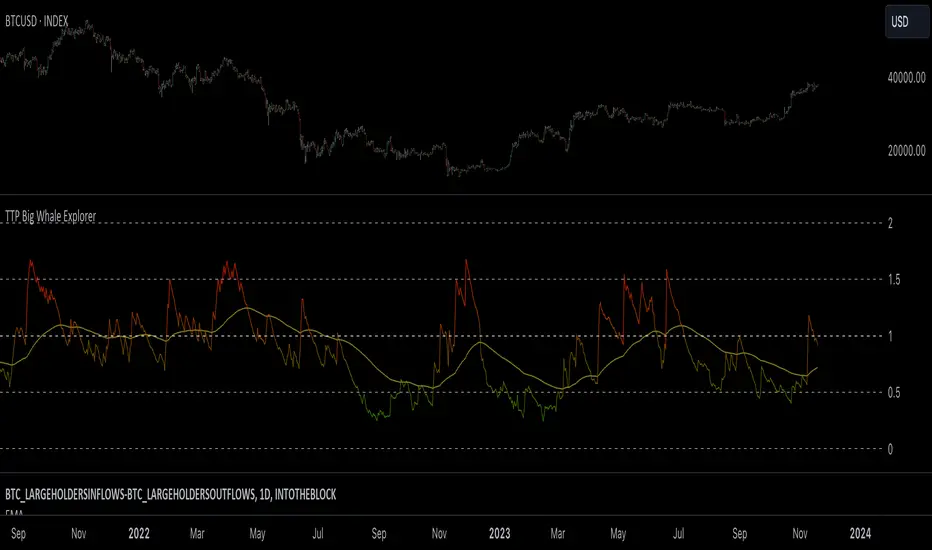
TTP Big Whale ExplorerThe Big Whale Explorer is an indicator that looks into the ratio of large wallets deposits vs withdrawals.
Whales tend to sale their holding when they transfer their holdings into exchanges and they tend to hold when they withdraw.
In this overlay indicator you'll be able to see in an oscillator format the moves of large wallets.
The moves above 1.5 turn into red symbolising that they are starting to distribute. This can eventually have an impact in the price by causing anything from a mild pullback to a considerable crash depending on how much is being actually sold into the market.
Moves below 0.5 mean that the large whales are heavily accumulating and withdrawing. During these periods price could still pullback or even crash but eventually the accumulation can take prices to new highs.
Instructions:
1) Load INDEX:BTCUSD or BNC:BLX to get the most historic data as possible
2) use the daily timeframe
3) load the indicator into the chart
Logical Trading Indicator V.1Features of the Logical Trading Indicator V.1
ATR-Based Trailing Stop Loss
The Logical Trading Indicator V.1 utilizes the Average True Range (ATR) to implement a dynamic trailing stop loss. You can customize the sensitivity of your alerts by adjusting the ATR Multiple and ATR Period settings.
Higher ATR Multiple values create wider stops, while lower values result in tighter stops. This feature ensures that your trades are protected against adverse price movements. For best practice, use higher values on higher timeframes and lower values on lower term timeframes.
Bollinger Bands
The Logical Trading Indicator V.1 includes Bollinger Bands, which can be customized to use either a Simple Moving Average (SMA) or an Exponential Moving Average (EMA) as the basis.
You can adjust the length and standard deviation multiplier of the Bollinger Bands to fine-tune your strategy. The color of the basis line changes to green when price is above and red when price is below the line to represent the trend.
The bands show a range vs a single band that also represents when the price is in overbought and oversold ranges similar to an RSI. These bands also control the take profit signals.
You also have the ability to change the band colors as well as toggle them off, which only affects the view, they are still active which will still fire the take profit signals.
Momentum Indicator
Our indicator offers a momentum filter option that highlights market momentum directly on the candlesticks, identifying periods of bullish, bearish, or consolidation phases. You can enable or disable this filter as needed, providing valuable insights into market conditions.
By default, you will see the candlestick colors represent the momentum direction as green or red, and consolidation periods as white, but the filter on the BUY and SELL signals is not active. The view options and filter can be toggled on and off in the settings.
Buy and Sell Signals
The Logical Trading Indicator V.1 generates buy and sell signals based on a combination of ATR-based filtering, Bollinger Band basis crossover, and optional momentum conditions if selected in the settings. These signals help you make informed decisions about when to enter or exit a trade. You can also enable a consolidation filter to stay out of trades during tight ranges.
Basically a BUY signal fires when the price closes above the basis line, and the price meets or exceeds the ATR multiple from the previous candle length, which is also editable in the settings.
If the momentum filter is engaged, it will not fire BUY signals when in consolidation periods. It works just the opposite for SELL signals.
Take Profit Signals
We've integrated a Take Profit feature that helps you identify points to exit your trades with profits. The indicator marks Long Take Profit when prices close below the upper zone line of the Bollinger Bands after the previous candle closes inside the band, suggesting an optimal point to exit a long trade or consider a short position.
Conversely, Short Take Profit signals appear when prices close above the lower zone after the previous candle closes inside of it, indicating the right time to exit a short trade or contemplate a long position.
Alerts for Informed Trading
The Logical Trading Indicator V.1 comes equipped with alert conditions for buy signals, sell signals, take profit points, and more. Receive real-time notifications to your preferred devices or platforms to stay updated on market movements and trading opportunities.

3x MTF MACD v3.0MACD's on 3 different Time Frames
Indicator Information
- Each Time Frame shows start of Trend and end of trend of the MACD vs the Signal Cross
- They are labled 1,2,3 with respective up or down triangle for possible direction.
User Inputs
- configure the indicator by specifying various inputs. These inputs include colors for bullish
and bearish conditions, the time frame to use, whether to show a Simple Moving Average
(SMA) line, and other parameters.
- Users can choose time frames for analysis (like 30 minutes, 1 hour, etc.)
but they must be in mintues.
- The code also allows users to customize how the indicator looks on the chart by providing
options for position and color.
Main Calculations
- The script calculates the Simple Moving Average (SMA) based on the user-defined time
frame.
- It then determines the color of the plot (line) based on certain conditions, such as whether
the SMA is rising or falling. These conditions help users quickly identify market trends.
Label Creation
- The code creates labels that can be displayed on the chart.
These labels indicate whether there's a bullish or bearish signal.
Level Detection
- The script determines and labels key levels or points of interest in the chart based on
certain conditions.
- It can show labels like "①" and "▲" for bullish conditions and "▼" for bearish conditions.
Table Display
- There's an option to show a table on the chart that displays information about the MACD
indicator Chosen and the NUmber Bubble assocated with that time frame
- The table can include information like which time frame is being analyzed, whether the SMA
line is shown, and other relevant data.
Plotting on the Chart
- The script plots the Simple Moving Average (SMA) on the chart. The color of this line
changes based on the calculated trend conditions.
ATR (Average True Range)
- The script also plots the Average True Range (ATR) on the chart. ATR is used to measure
market volatility.
"In essence, this script is a highly customizable MACD and SMA indicator for traders. It assists traders in comprehending market trends, offering insights into different MACD cycles concerning various timeframes.
Users can configure it to match their trading strategies, and it presents information in a user-friendly manner with colors, labels, and tables.
This simplifies market analysis, allowing traders to make more informed decisions without the distraction of multiple indicators."

Astro: Planetary Aspects v2.0I have updated the excellent script originally written by @BarefootJoey with additional functionality as listed below the script's original description:
@BarefootJoey:
In astrology, planetary aspects refer to the angles formed between two or more planets in a horoscope or birth chart. These angles are created by the positions of the planets in the sky and are thought to represent a particular energy or influence that can impact events on Earth.
The most common planetary aspects are the conjunction (when two planets are in the same position in the zodiac), the opposition (when two planets are direct across from each other in the zodiac), the trine (when two planets are 120 degrees apart in the zodiac), and the square (when two planets are 90 degrees apart in the zodiac).
This oscillator plots the current geocentric/heliocentric aspect for up to two planets and features a customizable precision of degree (up to +/- 15 degrees) for each aspect.
Additional functionality added in by @Yevolution:
1. Overlay the indicator plot on top of the main chart, with the indicator's scale placed on the left - I found it easier to spot price reactions at a given planetary aspect vs seeing the plot in a separate frame
2. Add options to plot a vertical bar for every occurrence of chosen aspects
The script source code has remained open and additional comments have been added by me to explain the changes where relevant.
When I get some more spare time I will add a function to enable future planetary aspect events to also be displayed on the chart to make forecasting using this data easier.

Supertrend x4 w/ Cloud FillSuperTrend is one of the most common ATR based trailing stop indicators.
The average true range (ATR) plays an important role in 'Supertrend' as the indicator uses ATR to calculate its value. The ATR indicator signals the degree of price volatility. In this version you can change the ATR calculation method from the settings. Default method is RMA, when the alternative method is SMA.
The indicator is easy to use and gives an accurate reading about an ongoing trend. It is constructed with two parameters, namely period and multiplier.
The implementation of 4 supertrends and cloud fills allows for a better overall picture of the higher and lower timeframe trend one is trading a particular security in.
The default values used while constructing a supertrend indicator is 10 for average true range or trading period.
The key aspect what differentiates this indicator is the Multiplier. The multiplier is based on how much bigger of a range you want to capture. In our case by default, it starts with 2.636 and 3.336 for Set 1 & Set 2 respectively giving a narrow band range or Short Term (ST) timeframe visual. On the other hand, the multipliers for Set 3 & Set 4 goes up to 9.736 and 8.536 for the multiplier respectively giving a large band range or Long Term (LT) timeframe visual.
A ‘Supertrend’ indicator can be used on equities, futures or forex, or even crypto markets and also on minutes, hourly, daily, and weekly charts as well, but generally, it fails in a sideways-moving market. That's why with this implementation it enables one to stay out of the market if they choose to do so when the market is ranging.
This Supertrend indicator is modelled around trends and areas of interest versus buy and sell signals. Therefore, to better understand this indicator, one must calibrate it to one's need first, which means day trader (shorter timeframe) vs swing trader (longer time frame), and then understand how it can be utilized to improve your entries, exits, risk and position sizing.
Example:
In this chart shown above using SPX500:OANDA, 15R Time Frame, we can see that there is at any give time 1 to 4 clouds/bands of Supertrends. These four are called Set 1, Set 2, Set 3 and Set 4 in the indicator. Set's 1 & 2 are considered short term, whereas Set's 3 & 4 are considered long term. The term short and long are subjective based on one's trading style. For instance, if a person is a 1min chart trader, which would be short term, to get an idea of the trend you would have to look at a longer time frame like a 5min for instance. Similarly, in this cases the timeframes = Multiplier value that you set.
Optional Ideas:
+ Apply some basic EMA/SMA indicator script of your choice for easier understanding of the trend or to allow smooth transition to using this indicator.
+ Split the chart into two vertical layouts and applying this same script coupled with xdecow's 2 WWV candle painting script on both the layouts. Now you can use the left side of the chart to show all bearish move candles only (make the bullish candles transparent) and do the opposite for the right side of the chart. This way you enhance focus to just stick to one side at a given time.
Credits:
This indicator is a derivative of the fine work done originally by KivancOzbilgic
Here is the source to his original indicator: ).
Disclaimer:
This indicator and tip is for educational and entertainment purposes only. This not does constitute to financial advice of any sort.

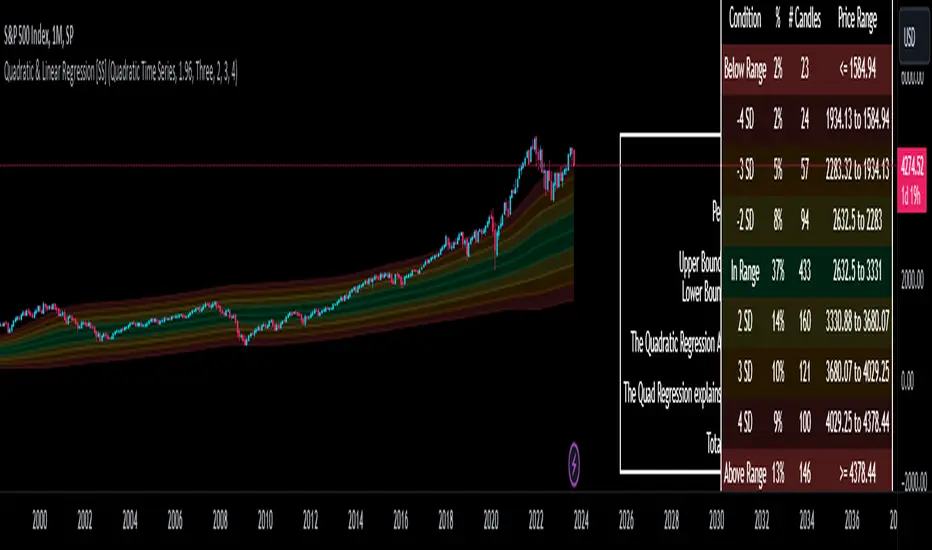
Quadratic & Linear Time Series Regression [SS]Hey everyone,
Releasing the Quadratic/Linear Time Series regression indicator.
About the indicator:
Most of you will be familiar with the conventional linear regression trend boxes (see below):
This is an awesome feature in Tradingview and there are quite a few indicators that follow this same principle.
However, because of the exponential and cyclical nature of stocks, linear regression tends to not be the best fit for stock time series data. From my experience, stocks tend to fit better with quadratic (or curvlinear) regression, which there really isn't a lot of resources for.
To put it into perspective, let's take SPX on the 1 month timeframe and plot a linear regression trend from 1930 till now:
You can see that its not really a great fit because of the exponential growth that SPX has endured since the 1930s. However, if we take a quadratic approach to the time series data, this is what we get:
This is a quadratic time series version, extended by up to 3 standard deviations. You can see that it is a bit more fitting.
Quadratic regression can also be helpful for looking at cycle patterns. For example, if we wanted to plot out how the S&P has performed from its COVID crash till now, this is how it would look using a linear regression approach:
But this is how it would look using the quadratic approach:
So which is better?
Both linear regression and quadratic regression are pivotal and important tools for traders. Sometimes, linear regression is more appropriate and others quadratic regression is more appropriate.
In general, if you are long dating your analysis and you want to see the trajectory of a ticker further back (over the course of say, 10 or 15 years), quadratic regression is likely going to be better for most stocks.
If you are looking for short term trades and short term trend assessments, linear regression is going to be the most appropriate.
The indicator will do both and it will fit the linear regression model to the data, which is different from other linreg indicators. Most will only find the start of the strongest trend and draw from there, this will fit the model to whatever period of time you wish, it just may not be that significant.
But, to keep it easy, the indicator will actually tell you which model will work better for the data you are selecting. You can see it in the example in the main chart, and here:
Here we see that the indicator indicates a better fit on the quadratic model.
And SPY during its recent uptrend:
For that, let's take a look at the Quadratic Vs the Linear, to see how they compare:
Quadratic:
Linear:
Functions:
You will see that you have 2 optional tables. The statistics table which shows you:
The R Squared to assess for Variance.
The Correlation to assess for the strength of the trend.
The Confidence interval which is set at a default of 1.96 but can be toggled to adjust for the confidence reading in the settings menu. (The confidence interval gives us a range of values that is likely to contain the true value of the coefficient with a certain level of confidence).
The strongest relationship (quadratic or linear).
Then there is the range table, which shows you the anticipated price ranges based on the distance in standard deviations from the mean.
The range table will also display to you how often a ticker has spent in each corresponding range, whether that be within the anticipated range, within 1 SD, 2 SD or 3 SD.
You can select up to 3 additional standard deviations to plot on the chart and you can manually select the 3 standard deviations you want to plot. Whether that be 1, 2, 3, or 1.5, 2.5 or 3.5, or any combination, you just enter the standard deviations in the settings menu and the indicator will adjust the price targets and plotted bands according to your preferences. It will also count the amount of time the ticker spent in that range based on your own selected standard deviation inputs.
Tips on Use:
This works best on the larger timeframes (1 hour and up), with RTH enabled.
The max lookback is 5,000 candles.
If you want to ascertain a longer term trend (over years to months), its best to adjust your chart timeframe to the weekly and/or monthly perspective.
And that's the indicator! Hopefully you all find it helpful.
Let me know your questions and suggestions below!
Safe trades to all!
Abz US Real ratesThis indicator shows Fed Funds Rate vs US inflation. It also shows the US 10 year bond yield and provides a color indication that aims to indicate if this is a period where owning TLT is a good idea or not. It is not investment advice and it is only aiming to indicate whether the trend is supportive or not for long dated US bonds in comparison with short dated treasury bills and versus inflation.
Recessions: Recessions are indicated by a grey background.
Yield inversion: Periods where the Fed Funds Rate is above the US 10 year bond yield are shown as a maroon background and frequently are macro indicators of an upcoming recession. Like other macro signals, this can't be relied upon as a timing tool.
This is intended to be used as an indictor on a long term chart. Minimum would be weekly but could be even more valid to focus on a chart with monthly candles.

Volume HeatMap With Profile [ChartPrime]The Volume Heatmap with Profile indicator is a tool designed to provide traders with a comprehensive view of market activity through customizable visualizations. This indicator goes beyond traditional volume analysis by offering a range of adjustable parameters and features that enhance analysis of volume and give a cleaner experience when analyzing it.
To get started click the start and end time for the profile.
Key Features:
Extended Calculation: This indicator extends its calculation to the last bar, ensuring that the user has insights into current market dynamics.
Point of Control (POC): Easily identify the price level at which the highest trading activity has occurred, helping the user pinpoint potential reversal points and significant support/resistance zones.
VWAP Point of Control: Display the Volume Weighted Average Price (VWAP) Point of Control, giving the user a clear reference for determining the average price traders are paying and potential price reversals.
Adjustable Colors for Heatmap: Change the heatmap colors to the users preference, allowing the user to match the indicator's appearance to their chart style and personal visual preferences.
Forecasted Zone: This feature allows traders to forecast areas of high activity by providing the option to adjust colors within this zone. This feature assists in identifying potential breakouts or areas where increased trading volume is anticipated.
Volume Profile: Customize the colors of the volume profile to make it distinct and easily distinguishable on the chart.
Adjustable Volume Levels: Specify the number volume levels that are most relevant to your trading strategy.
Adjustable Placement for Volume Profile: Position the volume profile on the chart. Whether the user prefers it on the left, right, or at the center of the chart, this indicator offers placement flexibility.
The ratio of bull vs bear volume is plotted on the outside of the range indicating how bullish or bearish price action is in a given range.

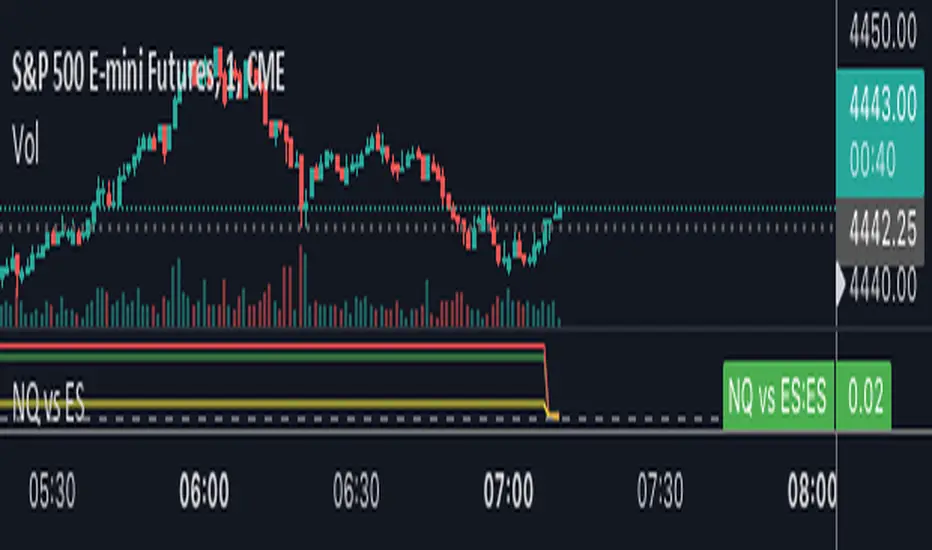
NQ vs ESThe script shows the spread between the realtime NQ and ES percentage change from the day before, from which it is possible to see if NQ is outperforming or underperforming the ES.
TTP SuperTrend ADXThis indicator uses the strength of the trend from ADX to decide how the SuperTrend (ST) should behave.
Motivation
ST is a great trend following indicator but it's not capable of adapting to the trend strength.
The ADX, Average Directional Index measures the strength of the trend and can be use to dynamically tweak the ST factor so that it's sensitivity can adapt to the trend strength.
Implementation
The indicator calculates a normalised value of the ADX based on the data available in the chart.
Based on these values ST will use different factors to increase or reduce the factor use by ST: expansion or compression.
ST expansion vs compression
Expanding the ST would mean that the stronger a trends get the ST factor will grow causing it to distance further from the price delaying the next ST trend flip.
Compressing the ST would mean that the stronger a trends get the ST factor will shrink causing it to get closer to the price speeding up the next ST trend flip.
Features
- Alerts for trend flip
- Alerts for trend status
- Backtestable stream
- SuperTrend color gets more intense with the strength of the trend

Momentum Probability Oscillator [SS]This is the momentum based probability indicator.
What it does?
This takes the average of MFI, Stochastics and RSI and plots it out as an independent oscillator.
It then tracks bullish vs bearish instances. Bullish is defined as a greater move from open to high than open to low and inverse for bearish.
It stores this data and these averages and plots these levels as a graph.
The graph depicts the max bullish values at the top, the min bearish values at the bottom and the averages in between:
It will plot the average "threshold" value in yellow:
The threshold value is key. A ticker trading above the threshold is generally bullish. Below is bearish.
The threshold value frequently acts as support and resistance levels (see below):
Resistance:
Support:
The indicator also shows you the amount of time a ticker has spent in each region, over a defined lookback period (defaulted to 500):
When you see that cumulatively, more time has been spent in a bullish range or a bearish range, it can help you ascertain the prevailing sentiment at that time.
The indicator will also calculate the average price range based on the underlying oscillator value. It does this through use of ATR based techniques, as its not usually possible to calculate a price from an oscillator:
This is intended as a general reference and not a precise target, as it is using ATR as opposed to the actual technical value itself.
As this is an oscillator, you can use it to look for divergences as well. The advantage to having it formulated in this way is:
a) You get the power of all 3 indicators (stochastics, MFI and RSI) in one and
b) You are adding context to the underlying technical reading. The indicator is plotting out the average, max and min ranges for the selected ticker and performing assessments based on these ranges that add context to the current PA.
You also have the ability to see the specific technical levels associated with each specific technical indicator. If you open up the settings menu and select "Show Table", this will appear:
This will show you the exact values of each of the technicals the indicator is using in its range assessment.
And that is basically the bulk of the indicator!
I use this predominately on the smaller timeframes, especially when there is a lot of chop, to ascertain the overall sentiment.
I also will reference it on the 1 hour to see what the prevailing sentiment is and whether the stock is at an area of technical resistance or support. For example, here is what I referenced on SPY today:
QUICK NOTE:
It works best with RTH (regular trading hours) turned on and ETH (extended trading hours) turned off!
That's it!
Hopefully you like it and leave your comments and suggestions below!

MarketSmith Daily Market IndicatorsMarketSmith Daily Market Indicators is designed to mimic the Daily Market Indicators tab found in MarketSmith. This tab contains 4 different secondary indicators to help gauge the health of the overall market.
This indicator allows you to choose which of the 4 indicators to show, as well as which index to pull data from, Nasdaq or NYSE. There is also a snapshot table showing the following:
# of stock advancing and up volume
# of stocks declining and down volume
# of stock unchanged and unchanged volume
# of stocks making new highs and new lows
Now let's look at the 4 indicators and how they work.
Advance/Decline Line
Plots the number of advancing shares vs the number of declining shares. Heavily weighted index stocks can skew price action, this line helps reveal that and whether most stocks are aligned with the trend.
Short Term Overbought/Oversold Oscillator
A 10-day moving average of the number of stocks moving up in price less the number of stocks moving down in price.
10 Day Moving Average of Up & Down Volume
Two 10 day moving averages to represent the volume of all stocks. Blue line: total volume of all stocks moving up in price. Red line: the total volume of all stocks moving down in price.
10 Day Moving Average of New Highs & New Lows
Two 10-day moving average to represent stocks making new highs and new lows. Blue line: The number of stocks making new price highs. Red line: The number of stocks reaching new lows.
Note this indicator is designed to work on a daily time frame chart. Data typically updates 90 minutes after the close. Data may differ from Marketsmith due to different providers, however the general trends are the same.

Filtered Volume Profile [ChartPrime]The "Filtered Volume Profile" is a powerful tool that offers insights into market activity. It's a technical analysis tool used to understand the behavior of financial markets. It uses a fixed range volume profile to provide a histogram representing how much volume occurred at distinct price levels.
Profile in action with various significant levels displayed
How to Use
The script is designed to analyze cumulative trading volumes in different price bins over a certain period, also known as `'lookback'`. This lookback period can be defined by the user and it represents the number of bars to look back for calculating levels of support and resistance.
The `'Smoothing'` input determines the degree to which the output is smoothed. Higher values lead to smoother results but may impede the responsiveness of the indicator to rapid changes in volatility.
The `'Peak Sensitivity'` input is used to adjust the sensitivity of the script's peak detection algorithm. Setting this to a lower value makes the algorithm more sensitive to local changes in trading volume and may result in "noisier" outputs.
The `'Peak Threshold'` input specifies the number of bins that the peak detection mechanism should account for. Larger numbers imply that more volume bins are taken into account, and the resultant peaks are based on wider intervals.
The `'Mean Score Length'` input is used for scaling the mean score range. This is particularly important in defining the length of lookback bars that will be used to calculate the average close price.
Sinc Filter
The application of the sinc-filter to the Filtered Volume Profile reduces the risk of viewing artefacts that may misrepresent the underlying market behavior. Sinc filtering is a high-quality and sharp filter that doesn't manifest any ringing effects, making it an optimal choice for such volume profiling.
Histogram
On the histogram, the volume profile is colored based on the balance of bullish to bearish volume. If a particular bar is more intense in color, it represents a larger than usual volume during a single price bar. This is a clear signal of a strong buying or selling pressure at a particular price level.
Threshold for Peaks
The `peak_thresh` input determines the number of bins the algorithm takes in account for the peak detection feature. The 'peak' represents the level where a significant amount of volume trading has occurred, and usually is of interest as an indicative of support or resistance level.
By increasing the `peak_thresh`, you're raising the bar for what the algorithm perceives as a peak. This could result in fewer, but more significant peaks being identified.
History of Volume Profiles and Evolution into Sinc Filtering
Volume profiling has a rich history in market analysis, dating back to the 1950s when Richard D. Wyckoff, a legendary trader, introduced the concept of volume studies. He understood the critical significance of volume and its relationship with market price movement. The core of Wyckoff's technical analysis suite was the relationship between prices and volume, often termed as "Effort vs Results".
Moving forward, in the early 1800s, the esteemed mathematician J. R. Carson made key improvements to the sinc function, which formed the basis for sinc filtering application in time series data. Following these contributions, trading studies continued to create and integrate more advanced statistical measures into market analysis.
This culminated in the 1980s with J. Peter Steidlmayer’s introduction of Market Profile. He suggested that markets were a function of continuous two-way auction processes thus introducing the concept of viewing markets in price/time continuum and price distribution forms. Steidlmayer's Market Profile was the first wide-scale operation of organized volume and price data.
However, despite the introduction of such features, challenges in the analysis persisted, especially due to noise that could misinform trading decisions. This gap has given rise to the need for smoothing functions to help eliminate the noise and better interpret the data. Among such techniques, the sinc filter has become widely recognized within the trading community.
The sinc filter, because of its properties of constructing a smooth passing through all data points precisely and its ability to eliminate high-frequency noise, has been considered a natural transition in the evolution of volume profile strategies. The superior ability of the sinc filter to reduce noise and shield against over-fitting makes it an ideal choice for smoothing purposes in trading scripts, particularly where volume profiling forms the crux of the market analysis strategy, such as in Filtered Volume Profile.
Moving ahead, the use of volume-based studies seems likely to remain a core part of technical analysis. As long as markets operate based on supply and demand principles, understanding volume will remain key to discerning the intent behind price movements. And with the incorporation of advanced methods like sinc filtering, the accuracy and insight provided by these methodologies will only improve.
Mean Score
The mean score in the Filtered Volume Profile script plays an important role in probabilistic inferences regarding future price direction. This score essentially characterizes the statistical likelihood of price trends based on historical data.
The mean score is calculated over a configurable `'Mean Score Length'`. This variable sets the window or the timeframe for calculation of the mean score of the closing prices.
Statistically, this score takes advantage of the concept of z-scores and probabilities associated with the t-distribution (a type of probability distribution that is symmetric and bell-shaped, just like the standard normal distribution, but has heavier tails).
The z-score represents how many standard deviations an element is from the mean. In this case, the "element" is the price level (Point of Control).
The mean score section of the script calculates standard errors for the root mean squared error (RMSE) and addresses the uncertainty in the prediction of the future value of a random variable.
The RMSE of a model prediction concerning observed values is used to measure the differences between values predicted by a model and the values observed.
The lower the RMSE, the better the model is able to predict. A zero RMSE means a perfect fit to the data. In essence, it's a measure of how concentrated the data is around the line of best fit.
Through the mean score, the script effectively predicts the likelihood of the future close price being above or below our identified price level.
Summary
Filtered Volume Profile is a comprehensive trading view indicator which utilizes volume profiling, peak detection, mean score computations, and sinc-filter smoothing, altogether providing the finer details of market behavior.
It offers a customizable look back period, smoothing options, and peak sensitivity setting along with a uniquely set peak threshold. The application of the Sinc Filter ensures a high level of accuracy and noise reduction in volume profiling, making this script a reliable tool for gaining market insights.
Furthermore, the use of mean score calculations provides probabilistic insights into price movements, thus providing traders with a statistically sound foundation for their trading decisions. As trading markets advance, the use of such methodologies plays a pivotal role in formulating effective trading strategies and the Filtered Volume Profile is a successful embodiment of such advancements in the field of market analysis.

DTR & ATR
Description
This ATR and DTR label is update of Existing Label provided by © ssksubam
Please See Notes on original Script Here :
Original Code is not mine but I have done few code changes which I believe will help everyone who are looking to add more labels together and save space on the chart
ATR & DTR Script is very helpful for Day Traders as I will explain in detail bellow
Following are changes I have incorporated
Previous Label took more space on the charts with Header and Footer.
I removed the Header and moved both DTR vs ATR descriptions on the same line, saving space on the chart.
I updated the code to remove => signs, which are self-explanatory as I will explain below.
I made the label in 1 single compact line for maximum space efficiency and aesthetics.
These changes improve the content's clarity and conciseness while optimizing space on the charts. If you have any further requests or need additional assistance, feel free to let me know!
What Does DTR Signify?
Stock ATR stands for Average True Range, which is a technical indicator used in trading and investment analysis. The Average True Range measures the volatility of a stock over a given period of time. It provides insights into the price movement and potential price ranges of the stock.
The ATR is calculated as the average of the true ranges over a specific number of periods. The true range is the greatest of the following three values:
The difference between the current high and the current low.
The absolute value of the difference between the current high and the previous close.
The absolute value of the difference between the current low and the previous close.
Traders and investors use ATR to assess the potential risk and reward of a stock. A higher ATR value indicates higher volatility and larger price swings, while a lower ATR value suggests lower volatility and smaller price movements. By understanding the ATR, traders can set appropriate stop-loss levels and make informed decisions about position sizing and risk management.
It's important to note that the ATR is not a directional indicator like moving averages or oscillators. Instead, it provides a measure of volatility, helping traders adapt their strategies to suit the current market conditions.
What Does ATR Signify?
The Average True Range (ATR) signifies the level of volatility or price variability in a particular financial asset, such as a stock, currency pair, or commodity, over a specific period of time. It provides valuable information to traders and investors regarding the potential risk and reward associated with the asset.
Here are the key significances of ATR:
Volatility Measurement: ATR measures the average price range between high and low prices over a specified timeframe. Higher ATR values indicate greater volatility, while lower values suggest lower volatility. Traders use this information to gauge the potential price movements and adjust their strategies accordingly.
Risk Assessment: A higher ATR value implies larger price swings, indicating increased market uncertainty and risk. Traders can use ATR to set appropriate stop-loss levels and manage risk by adjusting position sizes based on the current volatility.
Trend Strength: ATR can also be used to assess the strength of a trend. In an uptrend or downtrend, ATR tends to increase, indicating a more powerful price movement. Conversely, a declining ATR might signify a weakening trend or a consolidation period.
Range-Bound Market Identification: In a range-bound or sideways market, the ATR value tends to be relatively low, reflecting the lack of significant price movements. This information can be helpful for range-trading strategies.
Volatility Breakouts: Traders often use ATR to identify potential breakouts from consolidation patterns. When the ATR value expands significantly, it may indicate the beginning of a new trend or a breakout move.
Comparison between Assets: ATR allows traders to compare the volatility of different
How to use DTR & ATR for Trading
Using Average True Range (ATR) and Daily Trading Range (DTR) can be beneficial for day trading to assess potential price movements, manage risk, and identify trading opportunities. Here's how you can use both indicators effectively:
Calculate ATR and DTR: First, calculate the ATR and DTR values for the asset you are interested in trading. ATR is the average of true ranges over a specified period (e.g., 14 days), while DTR is the difference between the high and low prices of a single trading day.
Assess Volatility: Compare the ATR and DTR values to understand the current volatility of the asset. Higher values indicate increased volatility, while lower values suggest reduced volatility.
Setting Stop-Loss: Use ATR to set appropriate stop-loss levels. For example, you might decide to set your stop-loss a certain number of ATR points away from your entry point. This approach allows you to factor in market volatility when determining your risk tolerance.
Identify Trading Range: Analyze DTR to determine the typical daily price range of the asset. This information can help you identify potential support and resistance levels, which are essential for day trading strategies such as breakout or range trading.
Breakout Strategies: ATR can assist in identifying potential breakout opportunities. When ATR values increase significantly, it suggests an expansion in volatility, which may indicate an upcoming breakout from a trading range. Look for breakouts above resistance or below support levels with higher than usual ATR values.
Scalping Strategies: For scalping strategies, where traders aim to profit from small price movements within a single trading session, knowing the typical DTR can help set reasonable profit targets and stop-loss levels.
Confirming Trend Strength: In day trading, you may encounter short-term trends. Use ATR to assess the strength of these trends. If the ATR is rising, it suggests a strong trend, while a declining ATR may indicate a weakening trend or potential reversal.
Risk Management: Both ATR and DTR can aid in risk management. Determine your position size based on the current ATR value to align it with your risk tolerance. Additionally, understanding the DTR can help you avoid overtrading during periods of low volatility.
Combine with Other Indicators: ATR and DTR work well when used in conjunction with other technical indicators like moving averages, Bollinger Bands, or RSI. Combining multiple indicators can provide a mor

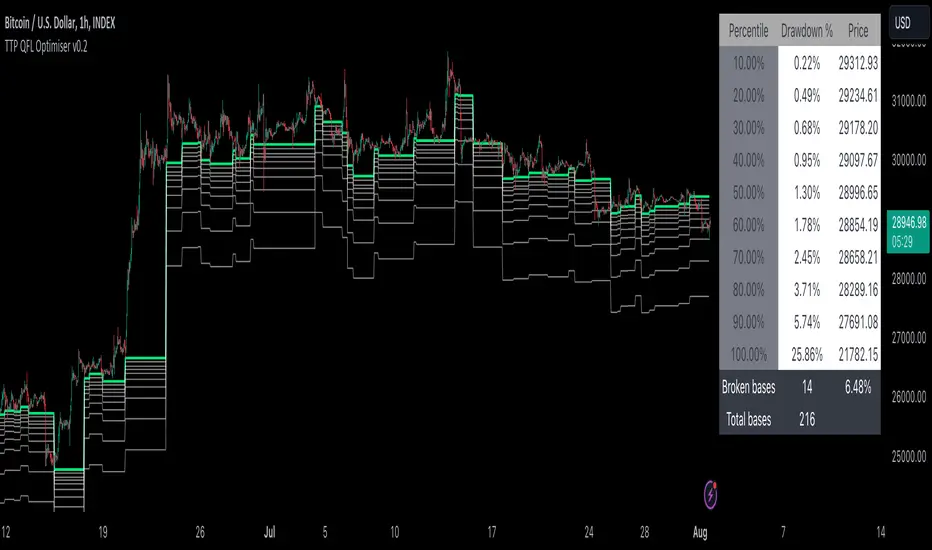
TTP QFL OptimiserThis tool is designed to help finding the best take profit and stop loss levels when trading with QFL bases (Quick Fingers Luc).
You can use it to see the average drawdown among all historic bases broken for an asset and then find the drawdowns that are more frequent using the percentile parameters provided.
For example, by knowing that 98% of the bases got broken with a drawdown of up to 5% can become extremely useful for deciding where to place your take profit or stop loss levels.
It supports QFL 1H, 2H and 4H but make sure to set the chart timeframe to a lower timeframe than QFL to obtain valid results.
Two percentiles are provided to be able to evaluate potential TP and SL at the same time.
Steps:
- Load an asset in the 15min TF
- Select the QFL version: 1H more deals / lower quality vs 4H less deals/ better quality
- Find a percentile that triggers enough deals (example: 70) and then another percentile that doesn't get hit too much (example: 98)
- Confirm the values p1 and p2 provided in the table and the white and grey lines for the results of which drawdown percentages correspond to such selection of percentiles
Once having p1 and p2 use your backtesting and forward testing tools to confirm and adjust accordingly.
Historic Volume/Market ProfilesHistoric Volume/Market Profile is a Periodic Volume Profile with all of the improvements known in the original Volume/Market Profile.
VMP is a 2 in 1 Volume and Market Profile Indicator.
HVMP uses the base of VMP to offer a quick and simple view at multiple historic profiles at the same time.
This includes:
Cluster Identification for High Volume and Low Volume Areas.
Maximizing granularity by utilizing boxes and lines to get up to 1000 rows.
New Inclusions in HVMP vs VMP:
HVMP granularity is determined by the # of profiles on display. By doing this, each profile will get an even amount of allocated rows to use and granularity is scaled per-profile, to fit within the row allowance.
For Example: 1000/(# of profiles) = Maximum # of rows per profile.
HVMP introduces the "Auto-Scale" Option (on by Default), this automatically fits each profile within the defined timeframe period to provide a consistent display when switching timeframes.
Even with "Auto-Scale" enabled, "Display Size" dictates which direction the profile is displayed.
Below is a Negative Display Size (Displays from right to left, starting at the end of the period)
Below is a Positive Display Size (Displays from left to right, starting at the beginning of the period)
HVMP is only for historical data, you can get a live profile with the same Node Identification using VMP (Volume Market/Profile). The indicator that this one is based on.
Find it Here: Volume/Market Profile
Enjoy!

Retest Support Resistance Signals [ChartPrime]The Retest Support Resistance Signals Indicator is a powerful tool designed to assist traders in identifying key support and resistance levels within the market. Most importantly and uniquely it identifies retests of these structures and displays them on the trader's chart. By utilizing a combination of pivot points and price action analysis, this indicator offers valuable insights for both signal-based and support/resistance trading strategies.
Key Features & settings:
Retest Confirmation: The indicator waits for a break above a support or resistance level and observes subsequent price action. If price retraces and forms a wick below the level, followed by a bounce, the indicator identifies it as a retest and labels it as "R" to indicate potential support or resistance confirmation.
This indicator combines the benefits of signal-based trading and support/resistance analysis, providing users with a versatile trading tool suitable for various strategies.
Retest Weaker Toggle: Users have the option to enable or disable the retest weaker feature. When enabled, the indicator considers a support or resistance level weaker if it experiences a test. When disabled, the indicator assumes that a bounce may occur from the level.
Pivot Detection Customization: Users can adjust the pivot detection method based on either wicks or bodies. This flexibility allows traders to adapt the indicator to different market conditions and preferences. The trader can also customize the number of bars used for pivot detection on both the left and right sides. This feature enables traders to fine-tune the indicator's sensitivity and responsiveness.
Users also have control over how support or resistance levels are managed on the chart. They can choose to either stop updating the levels (freeze) or completely remove them (delete) from the chart.
Breakout Threshold Setting: Traders can adjust the breakout threshold until deletion setting. This setting determines the number of successful breakouts through a support or resistance level required to remove it from the chart. This feature helps filter out weaker levels and focus on more significant ones.
Shown above we see the retest labels in action denoted with an R label
This indicator can be a useful addition to an SR trader's toolkit. Identifying when a level in the market is retested can reveal interesting information about the underlying strength of a trend. This indicator has been designed with the two major schools of thought; a level gets weaker the more it's tested vs stronger the more it's tested. We have designed this therefore to be versatile and adapt to both thought procceses. The R labels should be taken and considered as a larger part of an analysis process and not followed blindly.

Earnings Yield & Dividend Yield (vs SP500, treasury, IG)# What's this script?
I created this because I wanted to compare the Earnings/Dividend yield of SP500 and the symbol with the time period of the chart.
Plot the following yields.
Earnings Yield of S&P500.
Calculated using S&P 500 Earnings by Month provided by Nasdaq date link.
(data.nasdaq.com)
Dividend Yield of S&P500.
Calculated using S&P 500 Dividend by Month provided by Nasdaq date link.
(data.nasdaq.com)
Earnings Yield of the displayed symbol.
Dividend Yield of the displayed symbol.
Treasury constant maturity rate. default is 10Y(FRED:DGS10).
Investment grade corporate bond yields by Moody's.
Grades from Aaa to Baa are represented by color bands.
Investment grade bond yields by BofA.
Grades from AAA to BBB are represented by color bands.
-----------
◇これなに?
request.quandl()を用いてSP500の益回りと配当利回りが得られますが
月間データなのでチャートの時間間隔でみたかったのと、
SP500とシンボルの益回りや配当利回りを比較したかったのでつくりました。
下記を表示します
- SP500の益回りと配当利回り
- 表示シンボルの益回りや配当利回り
- 設定画面で指定した財務省債券(デフォルトは10年)
- 投資適格社債(MoodysとBofAでかなり違ったので両方)をカラーバンドで表示
かんたんなものですけど、おやくにたてればさいわいです
