Daily Oversold Swing ScreenerThat script is a **Pine Script Indicator** designed to identify potential **swing trade entry points** on a daily timeframe by looking for stocks that are **oversold** but still in a **healthy long-term uptrend**.
It screens for a high-probability reversal setup by combining four specific technical conditions.
Here is a detailed breakdown of the script's purpose and logic:
---
## 📝 Script Description: Daily Oversold Swing Screener
This Pine Script indicator serves as a **momentum and trend confirmation tool** for active traders seeking short-to-intermediate-term long entries. It uses data calculated on the **Daily** timeframe to generate signals, regardless of the chart resolution you are currently viewing.
The indicator is designed to filter out stocks that are in a strong downtrend ("falling knives") and only signal pullbacks within an established uptrend, which significantly increases the probability of a successful swing trade bounce.
### 🔑 Key Conditions for a Signal:
The indicator generates a buy signal when **all four** of the following conditions are met on the Daily timeframe:
#### 1. Oversold Momentum
* **Condition:** `rsiD < rsiOS` (Daily RSI is below the oversold level, typically **30**).
* **Purpose:** Confirms that the selling pressure has been extreme and the stock is temporarily out of favor, setting up a potential bounce.
#### 2. Momentum Turning Up
* **Condition:** `rsiD > rsiPrev` (Current Daily RSI value is greater than the previous day's Daily RSI value).
* **Purpose:** This is the most crucial filter. It confirms that the momentum has **just started to shift upward**, indicating that the low may be in and the stock is turning away from the oversold region.
#### 3. Established Uptrend (No Falling Knives)
* **Condition:** `sma50 > sma200 and closeD > sma50` (50-day SMA is above the 200-day SMA, AND the current daily close is above the 50-day SMA).
* **Purpose:** This is a **long-term trend filter**. It ensures that the current oversold condition is just a **pullback** within a larger, structurally bullish market (50 > 200), and that the price is still holding above the short-term trend line (Close > 50 SMA). This effectively screens out weak stocks in continuous downtrends.
#### 4. Price at Support (Bollinger Bands)
* **Condition:** `closeD <= lowerBB` (Daily Close is less than or equal to the lower Bollinger Band).
* **Purpose:** Provides a secondary measure of extreme price deviation. When the price touches or breaches the lower band, it suggests a significant move away from the mean (basis), often signaling strong statistical support where price is likely to revert.
### 📌 Summary of Signal
The final signal (`signal`) is triggered only when the market is confirmed to be **in a healthy long-term trend (Condition 3)**, the price is at an **extreme support level (Condition 4)**, the momentum is **oversold (Condition 1)**, and most importantly, the **momentum has begun to reverse (Condition 2)**.
Cari dalam skrip untuk "港股央企红利etf"

SPY EMA + VWAP Day Trading Strategy (Market Hours Only)//@version=5
indicator("SPY EMA + VWAP Day Trading Strategy (Market Hours Only)", overlay=true)
// === Market Hours Filter (EST / New York Time) ===
nySession = input.session("0930-1600", "Market Session (NY Time)")
inSession = time(timeframe.period, "America/New_York") >= time(nySession, "America/New_York")
// EMAs
ema9 = ta.ema(close, 9)
ema21 = ta.ema(close, 21)
// VWAP
vwap = ta.vwap(close)
// Plot EMAs & VWAP
plot(ema9, "EMA 9", color=color.green, linewidth=2)
plot(ema21, "EMA 21", color=color.orange, linewidth=2)
plot(vwap, "VWAP", color=color.blue, linewidth=2)
// ----------- Signals -----------
long_raw = close > ema9 and ema9 > ema21 and close > vwap and ta.crossover(ema9, ema21)
short_raw = close < ema9 and ema9 < ema21 and close < vwap and ta.crossunder(ema9, ema21)
// Apply Market Hours Filter
long_signal = long_raw and inSession
short_signal = short_raw and inSession
// Plot Signals
plotshape(long_signal,
title="BUY",
style=shape.labelup,
location=location.belowbar,
color=color.green,
size=size.small,
text="BUY")
plotshape(short_signal,
title="SELL",
style=shape.labeldown,
location=location.abovebar,
color=color.red,
size=size.small,
text="SELL")
// Alerts
alertcondition(long_signal, title="BUY Alert", message="BUY Signal (Market Hours Only)")
alertcondition(short_signal, title="SELL Alert", message="SELL Signal (Market Hours Only)")

Regime MapRegime Map — Volatility State Detector
This indicator is a PineScript friendly approximation of a more advanced Python regime-analysis engine.
The original backed identifies market regimes using structural break detection, Hidden-Markov Models, wavelet decomposition, and long-horizon volatility clustering. Since Pine Script cannot execute these statistical models directly, this version implements a lightweight, real-time proxy using realised volatility and statistical thresholds.
The purpose is to provide a clear visual map of evolving volatility conditions without requiring any heavy offline computation.
________________________________________
Mathematical Basis: Python vs Pine
1. Volatility Estimation
Python (Realised Volatility):
RVₜ = √N × stdev( log(Pₜ) − log(Pₜ₋₁) )
Pine Approximation:
RVₜ = stdev( log(Pₜ) − log(Pₜ₋₁), lookback )
Rationale:
Realised volatility captures volatility clustering — a key characteristic of regime transitions.
________________________________________
2. Regime Classification
Python (HMM Volatility States):
Volatility is modelled as belonging to hidden states with different means and variances:
State μ₁, σ₁
State μ₂, σ₂
State μ₃, σ₃
with state transitions determined by a probability matrix.
Pine Approximation (Z-Score Regimes):
Zₜ = ( RVₜ − mean(RV) ) / stdev(RV)
Regime assignment:
• Regime 0 (Low Vol): Zₜ < Zₗₒw
• Regime 1 (Normal): Zₗₒw ≤ Zₜ ≤ Zₕᵢgh
• Regime 2 (High Vol): Zₜ > Zₕᵢgh
Rationale:
Z-scores provide clean statistical boundaries that behave similarly to HMM state separation but are computable in real time.
________________________________________
3. Structural Break Detection vs Rolling Windows
Python (Bai–Perron Structural Breaks):
Segments the volatility series into periods with distinct statistical properties by minimising squared error over multiple regimes.
Pine Approximation:
Rolling mean and rolling standard deviation of volatility over a long window.
Rationale:
When structural breaks are not available, long-window smoothing approximates slow regime changes effectively.
________________________________________
4. Multi-Scale Cycles
Python (Wavelet Decomposition):
Volatility decomposed into long-cycle (A₄) and short-cycle components (D bands).
Pine Approximation:
Single-scale smoothing using long-horizon averages of RV.
Rationale:
Wavelets reveal multi-frequency behaviour; Pine captures the dominant low-frequency component.
________________________________________
Indicator Output
The background colour reflects the active volatility regime:
• Low Volatility (Green): trending behaviour, cleaner directional movement
• Normal Volatility (Yellow): balanced environment
• High Volatility (Red): sharp swings, traps, mean-reversion phases
Regime labels appear on the chart, with a status panel displaying the current regime.
________________________________________
Operational Logic
1. Compute log returns
2. Calculate short-horizon realised volatility
3. Compute long-horizon mean and standard deviation
4. Derive volatility Z-score
5. Assign regime classification
6. Update background colour and labels
This provides a stable, real-time map of market state transitions.
________________________________________
Practical Applications
Intraday Trading
• Low-volatility regimes favour trend and breakout continuation
• High-volatility regimes favour mean reversion and wide stop placement
Swing Trading
• Compression phases often precede multi-day trending moves
• Volatility expansions accompany distribution or panic events
Risk Management
• Enables volatility-adjusted position sizing
• Helps avoid leverage during expansion regimes
________________________________________
Notes
• Does not repaint
• Fully configurable thresholds and lookbacks
• Works across indices, stocks, FX, crypto
• Designed for real-time volatility regime identification
________________________________________
Disclaimer
This script is intended solely for educational and research purposes.
It does not constitute financial advice or a recommendation to buy or sell any instrument.
Trading involves risk, and past volatility patterns do not guarantee future outcomes.
Users are responsible for their own trading decisions, and the author assumes no liability for financial loss.

SPY Key LevelsUse Case
Do you belong to a group of traders that post key levels based on their technical analysis to be utilized for trading opportunities? The goal of this indicator is to reduce your daily prep time by allowing you to paste in the actual level values instead of trying to manually create each of the horizontal lines.
How it works
Simply enter the values of the key levels that you would like to plot horizontal lines for
Settings
You can enable/disable any of the levels
You can change the colors of the levels
You can add Previous Day High and Previous Day Low levels to the chart
Limitations
Currently the levels (besides PDH/PDL) are hardcoded to only display for the SPY security "AMEX:SPY"
// Terms \\
Feel free to use the script, If you do use the script could you please just tag me as I am interested to see how people are using it. Good Luck!

@Aladdin's Trading Web – Command CenterThe indicator uses standard Pine Script functionality including z-score normalization, standard deviation calculations, percentage change measurements, and request.security calls for multiple predefined symbols. There are no proprietary algorithms, external data feeds, or restricted calculation methods that would require protecting the source code.
Description:
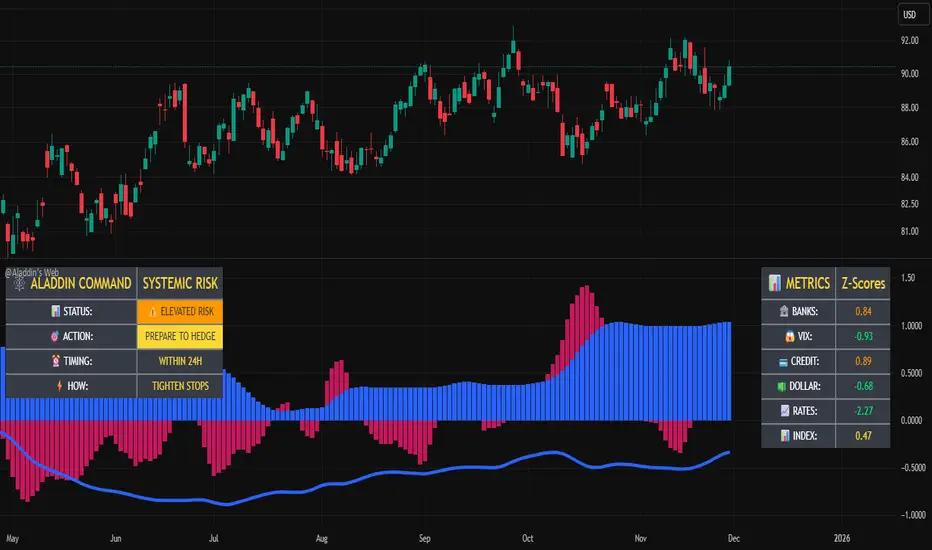
The @Aladdin's Trading Web – Command Center indicator provides a composite market regime assessment through a weighted combination of multiple intermarket relationships. The indicator calculates normalized z-scores across several key market components including banks, volatility, the US dollar, credit spreads, interest rates, and alternative assets.
Each component is standardized using z-score methodology over a user-defined lookback period and combined according to configurable weighting parameters. The resulting composite measure provides a normalized assessment of the prevailing market environment, with the option to invert rate relationships for specific market regime conditions.
The indicator focuses on capturing the synchronized behavior across these interconnected market segments to provide a unified view of systemic market conditions.
Elite Federal Reserve AIThe Elite Federal Reserve AI indicator provides an analytical framework focused on monitoring economic and market conditions that influence Federal Reserve policy decisions. The indicator examines key relationships and rate-of-change metrics across multiple proxies for monetary policy drivers.
The indicator tracks and analyzes:
• Yield curve dynamics through rate-of-change measurements in short and intermediate-term Treasury yields
• Inflation expectations via TIPS breakeven rate momentum
• Dollar strength and its rate of change over specified periods
• Financial market stress indicators including volatility and sector performance metrics
• Breadth measures through small capitalization stock performance
The indicator calculates momentum and rate-of-change values across these variables to identify shifts in the economic and financial conditions that serve as primary inputs to Federal Reserve decision-making. By monitoring the velocity of change in these key relationships, the indicator provides insight into the changing balance between inflationary pressures, growth expectations, financial stability concerns, and currency dynamics.
This approach focuses on the observable market-based indicators that reflect the underlying economic conditions the Federal Reserve considers in its policy formulation, enabling users to assess the prevailing policy environment through the lens of these critical market relationships and their momentum characteristics.

Elite Correlation Matrix AIThe Elite Correlation Matrix AI indicator provides comprehensive real-time correlation analysis across multiple asset classes, displaying the interrelationships between equities, bonds, commodities, currencies, and volatility instruments.
The indicator calculates and displays correlation coefficients between a predefined set of major market indices and instruments, including:
• Major equity indices (SPY, QQQ, IWM)
• Long-term Treasury bonds (TLT)
• Gold (GLD)
• Crude oil (USO)
• Volatility (VIX)
• US Dollar Index (DXY)
• Bitcoin (BTCUSD)
Key features include:
• Rolling correlation calculations across user-defined periods to identify both short-term and longer-term relationships
• Visual correlation heat map showing the strength and direction of relationships between all tracked instruments
• Detection of correlation breakdowns, which often precede significant market regime shifts
• Dashboard display providing summary metrics of prevailing correlation patterns
The indicator enables users to monitor the current state of market relationships and identify when traditional correlations begin to break down, which frequently serves as an early warning of impending changes in market behavior. By tracking the degree of connectedness between different asset classes, the indicator provides insight into the current risk environment and the potential for diversification effectiveness.
This analysis is particularly valuable for understanding periods of market stress when asset relationships deviate from their normal patterns, as well as identifying environments where traditional correlations hold and where they are undergoing structural changes.

Elite Commodities AIThe Elite Commodities AI indicator provides a comprehensive analytical framework designed specifically for commodities trading. It combines multiple technical components to assess price action within the unique characteristics of commodity markets.
The indicator incorporates the following key elements:
Multi-timeframe RSI analysis across the primary timeframe, 4-hour, and daily periods
Multiple exponential moving averages (fast, slow, and trend) to establish directional context
Volume rate analysis measuring current volume relative to recent average volume
Bollinger Band width analysis to identify periods of volatility contraction
True Range volatility expressed as a percentage of price
The indicator evaluates the interaction between momentum, trend structure, volume participation, and volatility dynamics, which are particularly significant in commodities markets due to their sensitivity to changes in supply-demand fundamentals and large institutional order flow.
By combining these analytical components, the indicator provides a layered assessment of price behavior that captures the interplay between trend development, momentum characteristics, participation levels, and volatility compression—key factors that drive commodity market movements.
This approach enables traders to identify significant price action within the context of prevailing market structure, making it suitable for analyzing both directional trends and consolidation periods that are common in commodity price behavior.2.2s

Elite Bond Market AIDescription:
The Elite Bond Market AI indicator provides a comprehensive analytical framework specifically designed for bond market price action. The indicator combines multiple technical components including multi-timeframe RSI analysis, moving average relationships, volume dynamics, and volatility measurements to identify significant price behavior within the unique characteristics of bond market trading.
The indicator incorporates:
Multi-timeframe RSI evaluation across primary, 4-hour, and daily timeframes
Fast, slow, and trend exponential moving averages for directional context
Volume rate analysis relative to recent average volume
Bollinger Band width measurement for volatility contraction assessment
True Range volatility normalized as a percentage of price
This combination provides a layered analytical approach that captures the interplay between momentum, trend structure, participation levels, and volatility compression—key factors in bond market price discovery and directional moves.

Local Watchlist Gauge v6The Local Watchlist Gauge displays a compact monitoring table for a user-defined list of symbols, showing their current trend status and performance relative to their 52-week high.
The indicator presents a table that simultaneously tracks multiple symbols and displays:
• Trend direction for each symbol, determined by whether the closing price is above or below a user-defined moving average
• Percentage distance from the 52-week high, providing a clear measure of recent performance relative to the yearly peak
Each symbol is displayed with:
Trend indicator showing whether the symbol is in an uptrend (above moving average) or downtrend (below moving average)
Distance from 52-week high expressed as a percentage, with color coding to indicate proximity to recent highs
Green indicates symbols trading within 5% of their 52-week high, orange indicates symbols between 5% and 20% below their 52-week high, and red indicates symbols trading more than 20% below their 52-week high.
The table provides an at-a-glance summary of the trend status and relative performance of all symbols in the specified watchlist, allowing users to quickly identify which instruments are maintaining trend strength near their recent highs and which have experienced significant pullbacks from their yearly peaks.

Granville 8-Rule Engine — v6Description:
The Granville 8-Rule Engine systematically implements Joseph Granville's eight original trading rules, which provide a comprehensive framework for interpreting price action relative to a moving average to identify genuine trend changes and avoid false signals.
Granville's methodology focuses on the critical relationship between price movement and the direction of the moving average, recognizing that valid trend changes and continuations exhibit specific behavioral patterns while false breakouts and reversals show characteristic divergences.
The indicator evaluates all eight of Granville's rules and assigns a composite score based on their fulfillment:
Bullish Rules:
Rule 1: Price crosses above a rising moving average (+3 points)
Rule 2: Price remains above a rising moving average after testing support (+2 points)
Rule 3: Price remains above a rising moving average after penetrating below it (+1 point)
Rule 4: Moving average changes from declining to rising (+1 point)
Bearish Rules:
Rule 5: Price crosses below a declining moving average (-3 points)
Rule 6: Price remains below a declining moving average after testing resistance (-2 points)
Rule 7: Price remains below a declining moving average after penetrating above it (-1 point)
The indicator incorporates volume confirmation by adding or subtracting additional points when significant volume accompanies the fulfillment of bullish or bearish rules, respectively.
A buy signal is generated when the composite score reaches +4 or higher, indicating multiple bullish rules are simultaneously satisfied. A sell signal is generated when the score reaches -4 or lower, indicating multiple bearish rules are in effect.
This systematic approach filters out many false breakout and whipsaw signals by requiring multiple confirmatory conditions rather than relying on simple moving average crossovers. The scoring mechanism provides a quantitative measure of the strength of the prevailing trend relationship, enabling traders to distinguish between genuine trend development and deceptive price movements that fail to confirm with the moving average direction.
The Granville 8-Rule Engine provides a disciplined, rule-based method for determining whether price movements represent valid trend continuation, genuine trend reversal, or potentially misleading counter-trend activity that is likely to fail. By requiring multiple confirmatory conditions from Granville's established rules, the indicator helps traders avoid premature entries and provides higher-probability signals for participating in sustained trend movements.

SPX +10 / -10 From 9:30 Open//@version=5
indicator("SPX +10 / -10 From 9:30 Open", overlay=true)
// Exchange Time (New York)
sess = input.session("0930-1600", "Regular Session (ET)")
// Detect session and 9:30 AM bar
inSession = time(timeframe.period, sess)
// Capture the 9:30 AM open
var float open930 = na
if inSession
// If this is the first bar of the session (9:30 AM)
if time(timeframe.period, sess) == na
open930 := open
else
open930 := na
// Calculate movement from 9:30 AM open
up10 = close >= open930 + 10
dn10 = close <= open930 - 10
// Plot reference lines
plot(open930, "9:30 AM Open", color=color.orange)
plot(open930 + 10, "+10 Level", color=color.green)
plot(open930 - 10, "-10 Level", color=color.red)
// Alert conditions
alertcondition(up10, title="SPX Up +10", message="SPX moved UP +10 from the 9:30 AM open")
alertcondition(dn10, title="SPX Down -10", message="SPX moved DOWN -10 from the 9:30 AM open")
// Plot signals on chart
plotshape(up10, title="+10 Hit", style=shape.labelup, color=color.green, text="+10", location=location.belowbar, size=size.tiny)
plotshape(dn10, title="-10 Hit", style=shape.labeldown, color=color.red, text="-10", location=location.abovebar, size=size.tiny)

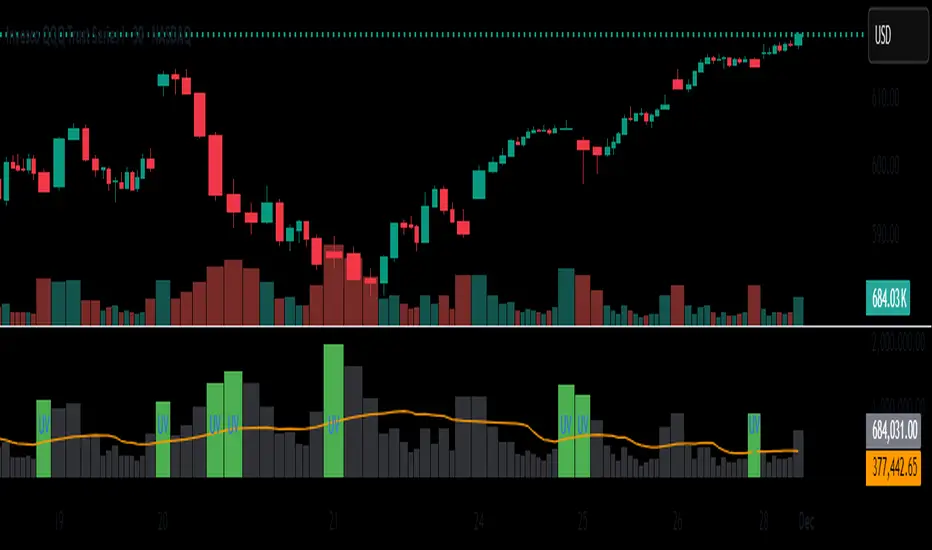
Unusual Volume//@version=5
indicator("Unusual Volume", overlay=false)
// --- Inputs ---
len = input.int(20, "Average Volume Length", minval=1)
mult = input.float(2.0, "Unusual Volume Multiplier", step=0.1)
// --- Calculations ---
avgVol = ta.sma(volume, len)
ratio = volume / avgVol
isBigVol = ratio > mult
// --- Plots ---
plot(volume, "Volume", style=plot.style_columns,
color = isBigVol ? color.new(color.green, 0) : color.new(color.gray, 60))
plot(avgVol, "Average Volume", color=color.orange)
// Mark unusual volume bars
plotshape(isBigVol, title="Unusual Volume Marker",
location=location.bottom, style=shape.triangleup,
color=color.green, size=size.tiny, text="UV")
// Optional: show ratio in Data Window
var label ratioLabel = na

Daily % Change TableDaily % Change Table — Indicator Summary
This indicator provides a compact performance summary for daily candles, designed for backtesting and daily-session analysis. It displays a table in the top-right corner of the chart showing three key percentage-change statistics based on the current candle:
1. Prior Change
Percentage move from the close two days ago to the prior day’s close.
Useful for understanding momentum and context heading into the current session.
2. Change
Percentage move from the prior day's close to the current candle’s close.
Shows today’s full-session change.
3. Premarket
Percentage move from the prior day's close to the current day’s open.
Helps quantify overnight sentiment and gap activity.
Features
Clean, unobtrusive table display
Automatically updates on the most recent bar
Designed for use on Daily timeframe
Useful for gap analysis, backtesting, and volatility/momentum studies

Unusual Volume//@version=5
indicator("Unusual Volume", overlay=false)
// --- Inputs ---
len = input.int(20, "Average Volume Length", minval=1)
mult = input.float(2.0, "Unusual Volume Multiplier", step=0.1)
// --- Calculations ---
avgVol = ta.sma(volume, len)
ratio = volume / avgVol
isBigVol = ratio > mult
// --- Plots ---
plot(volume, "Volume", style=plot.style_columns,
color = isBigVol ? color.new(color.green, 0) : color.new(color.gray, 60))
plot(avgVol, "Average Volume", color=color.orange)
// Mark unusual volume bars
plotshape(isBigVol, title="Unusual Volume Marker",
location=location.bottom, style=shape.triangleup,
color=color.green, size=size.tiny, text="UV")
// Optional: show ratio in Data Window
var label ratioLabel = na
Future High LinePlot a horizontal line from the current high n bars into the future. Line is user configurable.
Works well with Ichimoku Cloud. When line (26 bars) rises into an overhead cloud, this often signals bullish price movement.

10/20 EMA 50/100/200 SMA — by mijoomoCreated by mijoomo.
This indicator combines EMA 10 & EMA 20 with SMA 50/100/200 in one clean package.
Each moving average is toggleable, fully labeled, and alert-compatible.
Designed for traders who want a simple and effective multi-MA trend tool.

Gold Master: Swing + Daily Scalp (Fixed & Working)How to use it correctly
Daily chart → Focus only on big green/red triangles (Swing trades)
5m / 15m / 1H chart → Focus on small circles (Scalp trades)
You can turn each system on/off independently in the settings
Works perfectly on XAUUSD, GLD, GC futures, and even DXY (inverse signals).

Gamma Levels w/AlertsPlots Gamma Levels for identifying Market Positioning. Has alert function on the specific levels.
---To apply to different tickers You Must:
1. apply to chart layout
2. input ticker specific levels
3. Save as an INDICATOR TEMPLATE titled same as ticker (check the remember symbol box)
Now when switching to different tickers, simply open that template

Advanced Trading System - Volume Profile + BB + RSI + FVG + FibAdvanced Multi-Indicator Trading System with Volume Profile, Bollinger Bands, RSI, FVG & Fibonacci
Overview
This comprehensive trading indicator combines five powerful technical analysis tools into one unified system, designed to identify high-probability trading opportunities with precision entry and exit signals. The indicator integrates Volume Profile analysis, Bollinger Bands, RSI momentum, Fair Value Gaps (FVG), and Fibonacci retracement levels to provide traders with a complete market analysis framework.
Key Features
1. Volume Profile & Point of Control (POC)
Automatically calculates the Point of Control - the price level with the highest trading volume
Identifies Value Area High (VAH) and Value Area Low (VAL)
Updates dynamically based on customizable lookback periods
Helps identify key support and resistance zones where institutional traders are active
2. Bollinger Bands Integration
Standard 20-period Bollinger Bands with customizable multiplier
Identifies overbought and oversold conditions
Measures market volatility through band width
Signals generated when price approaches extreme levels
3. RSI Momentum Analysis
14-period Relative Strength Index with visual background coloring
Overbought (70) and oversold (30) threshold alerts
Integrated into buy/sell signal logic for confirmation
Real-time momentum tracking in info dashboard
4. Fair Value Gap (FVG) Detection
Automatically identifies bullish and bearish fair value gaps
Visual representation with colored boxes
Highlights imbalance zones where price may return
Used for high-probability entry confirmation
5. Fibonacci Retracement Levels
Auto-calculated based on recent swing high/low
Key levels: 23.6%, 38.2%, 50%, 61.8%, 78.6%
Perfect for identifying profit-taking zones
Dynamic lines that update with market movement
6. Smart Signal Generation
The indicator generates BUY and SELL signals based on multi-condition confluence:
BUY Signal Requirements:
Price near lower Bollinger Band
RSI in oversold territory (< 30)
High volume confirmation (optional)
Bullish FVG or POC alignment
SELL Signal Requirements:
Price near upper Bollinger Band
RSI in overbought territory (> 70)
High volume confirmation (optional)
Bearish FVG or POC alignment
7. Automated Take Profit Levels
Three dynamic profit targets: 1%, 2%, and 3%
Automatically calculated from entry price
Visual markers on chart
Individual alerts for each level
8. Comprehensive Alert System
The indicator includes 10+ alert types:
Buy signal alerts
Sell signal alerts
Take profit level alerts (TP1, TP2, TP3)
Fibonacci level cross alerts
RSI overbought/oversold alerts
Bullish/Bearish FVG detection alerts
9. Real-Time Info Dashboard
Live display of all key metrics
Color-coded for quick visual analysis
Shows RSI, BB Width, Volume ratio, POC, Fib levels
Current signal status (BUY/SELL/WAIT)
How to Use
Setup
Add the indicator to your chart
Adjust parameters based on your trading style and timeframe
Set up alerts by clicking "Create Alert" and selecting desired conditions
Recommended Timeframes
Scalping: 5m - 15m
Day Trading: 15m - 1H
Swing Trading: 4H - Daily
Parameter Customization
Volume Profile Settings:
Length: 100 (adjust for more/less historical data)
Rows: 24 (granularity of volume distribution)
Bollinger Bands:
Length: 20 (standard period)
Multiplier: 2.0 (adjust for tighter/wider bands)
RSI Settings:
Length: 14 (standard momentum period)
Overbought: 70
Oversold: 30
Fibonacci:
Lookback: 50 (swing high/low detection period)
Signal Settings:
Volume Filter: Enable/disable volume confirmation
Volume MA Length: 20 (for volume comparison)
Trading Strategy Examples
Strategy 1: Trend Reversal
Wait for BUY signal at lower Bollinger Band
Confirm with bullish FVG or POC support
Enter position
Take partial profits at Fib 38.2% and 50%
Exit remaining position at TP3 or SELL signal
Strategy 2: Breakout Confirmation
Monitor price approaching POC level
Wait for volume spike
Enter on signal confirmation with FVG alignment
Use Fibonacci levels for scaling out
Strategy 3: Range Trading
Identify POC as range midpoint
Buy at lower BB with oversold RSI
Sell at upper BB with overbought RSI
Use FVG zones for additional confirmation
Best Practices
✅ Do:
Use multiple timeframe analysis
Combine with price action analysis
Set stop losses below/above recent swing points
Scale out at Fibonacci levels
Wait for volume confirmation on signals
❌ Don't:
Trade every signal blindly
Ignore overall market context
Use on extremely low timeframes without testing
Neglect risk management
Trade during low liquidity periods
Risk Management
Always use stop losses
Risk no more than 1-2% per trade
Consider market conditions and volatility
Scale position sizes based on signal strength
Use the volume filter for additional confirmation
Technical Specifications
Pine Script Version: 6
Overlay: Yes (displays on main chart)
Max Boxes: 500 (for FVG visualization)
Max Lines: 500 (for Fibonacci levels)
Alerts: 10+ customizable conditions
Performance Notes
This indicator works best in:
Trending markets with clear momentum
High-volume trading sessions
Assets with good liquidity
When multiple signals align
Less effective in:
Extremely choppy/sideways markets
Low-volume periods
During major news events (high volatility)
Updates & Support
This indicator is actively maintained and updated. Future enhancements may include:
Additional volume profile features
More sophisticated FVG tracking
Enhanced alert customization
Backtesting integration
Disclaimer
This indicator is for educational and informational purposes only. It does not constitute financial advice. Past performance does not guarantee future results. Always conduct your own research and consider consulting with a financial advisor before making trading decisions. Trading involves substantial risk of loss.

5m1m RSI StrategyIdentify 15m RSI divergence as identified by 5m RSI confirmation. Exit on 1m correction.

Yit's Risk CalculatorIntroducing a risk a bulletproof risk calculator.
I'm tired of sitting on my brokerage, messing with my shares to buy while price action leaves me in the dust.
For my breakout strategy execution is everything i dont have time to stop and think.
within the Indicator settings you have free reign to change account size and risk%
*the stop loss is glued to the low of the day*

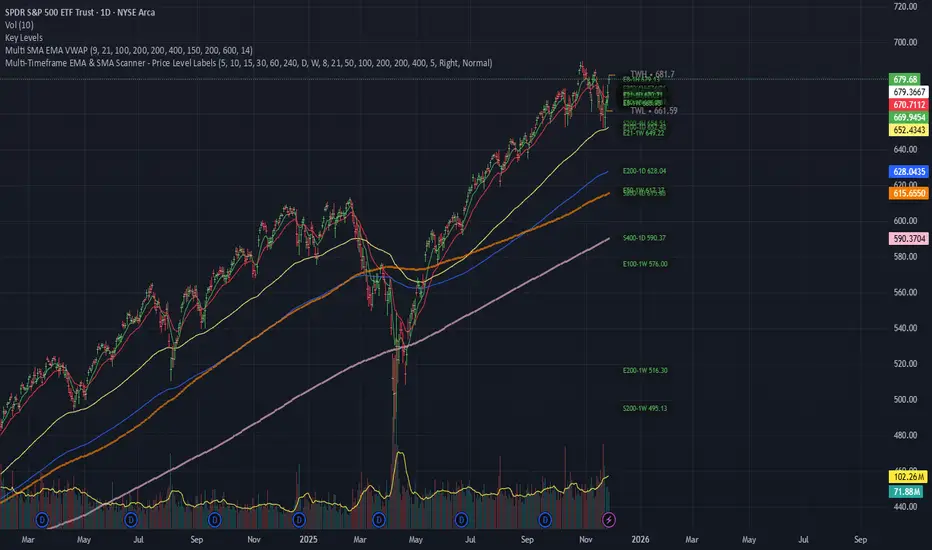
Multi-Timeframe EMA & SMA Scanner - Price Level LabelsOverview
A powerful multi-timeframe moving average scanner that displays EMA and SMA levels from up to 8 different timeframes simultaneously on your chart. Perfect for identifying key support/resistance levels, confluence zones, and multi-timeframe trend analysis.
Key Features
📊 Multi-Timeframe Analysis
Monitor up to 8 different timeframes simultaneously (5m, 10m, 15m, 30m, 1H, 4H, 1D, 1W)
Each timeframe can be independently enabled/disabled
Fully customizable timeframe selection
📈 Comprehensive Moving Averages
5 configurable EMA periods (default: 8, 21, 50, 100, 200)
2 configurable SMA periods (default: 200, 400)
All periods are fully customizable to match your trading strategy
🎯 Smart Price Level Labels
Labels positioned at actual price levels (not in a list)
Color-coded labels for easy identification
Dynamic text color: Green when price is above, Red when below
Compact notation: E8-5m means EMA 8 on 5-minute timeframe
Adjustable label offset from current price
📉 Optional Horizontal Lines
Dotted reference lines at each MA level
Color-matched to corresponding MA type
Can be toggled on/off independently
📋 Comprehensive Data Table
Shows all MA values organized by timeframe
Displays percentage distance from current price
Trend indicator (Strong Up/Up/Neutral/Down/Strong Down)
EMA alignment status (Bullish/Bearish/Mixed)
Color-coded cells for quick visual analysis
🎨 Full Customization
Individual color settings for each MA type
Adjustable table size (Tiny/Small/Normal/Large)
Choose table position (Left/Right)
Toggle any MA or timeframe on/off
🔔 Built-in Alerts
Golden Cross detection (EMA 50 crosses above EMA 200)
Death Cross detection (EMA 50 crosses below EMA 200)
Price crossing major EMAs
Available for multiple timeframes
How to Use
For Day Traders:
Enable lower timeframes (5m, 10m, 15m, 30m)
Focus on faster EMAs (8, 21, 50)
Watch for confluence zones where multiple timeframe MAs cluster
For Swing Traders:
Enable higher timeframes (1H, 4H, 1D)
Use all EMAs plus SMAs for broader perspective
Look for alignment across timeframes for high-probability setups
For Position Traders:
Focus on daily and weekly timeframes
Emphasize 100, 200 EMAs and 200, 400 SMAs
Use for long-term trend confirmation
Understanding the Labels
Label Format: E8-5m 45250.50
E8 = EMA with period 8
5m = 5-minute timeframe
45250.50 = Current price level
Green text = Price is currently above this level (potential support)
Red text = Price is currently below this level (potential resistance)
For SMAs: S200-1D 44500.00
S200 = SMA with period 200
1D = Daily timeframe
Trading Applications
Support/Resistance Identification
MAs act as dynamic support and resistance levels
Multiple timeframe MAs create stronger zones
Confluence Trading
When multiple MAs from different timeframes cluster together, it creates high-probability zones
These areas often result in strong reactions
Trend Analysis
Check the Alignment column: Bullish alignment = all EMAs in ascending order
Trend column shows overall price position relative to all MAs
Entry/Exit Timing
Use lower timeframe MAs for precise entries
Use higher timeframe MAs for trend direction and exits
Settings Guide
Timeframes Section:
Select and enable/disable up to 8 timeframes
Default: 5m, 10m, 15m, 30m, 1H, 4H, 1D, 1W
MA Periods Section:
Customize all EMA and SMA periods
Default EMAs: 8, 21, 50, 100, 200
Default SMAs: 200, 400
Display Section:
Toggle price labels and horizontal lines
Adjust label offset (distance from right edge)
Show/hide data table
Choose table position and size
Colors Section:
Customize colors for each MA type
Each MA has independent color control
Pro Tips
✅ Start with default settings and adjust based on your trading style
✅ Disable timeframes/MAs you don't use to reduce chart clutter
✅ Use the data table for quick overview, labels for precise levels
✅ Look for "confluence clusters" where multiple MAs from different timeframes align
✅ Green labels = potential support, Red labels = potential resistance
✅ Set alerts on key crossovers for automated notifications
Technical Specifications
Pine Script v6
Overlay indicator (displays on main chart)
Maximum 500 labels supported
Real-time updates on each bar close
Compatible with all instruments and timeframes
Perfect For:
Day traders seeking multi-timeframe confirmation
Swing traders looking for high-probability setups
Position traders monitoring long-term trends
Anyone using moving averages as part of their strategy
Note: This indicator does not provide buy/sell signals. It's a tool for analysis and should be used in conjunction with your trading strategy and risk management rules.