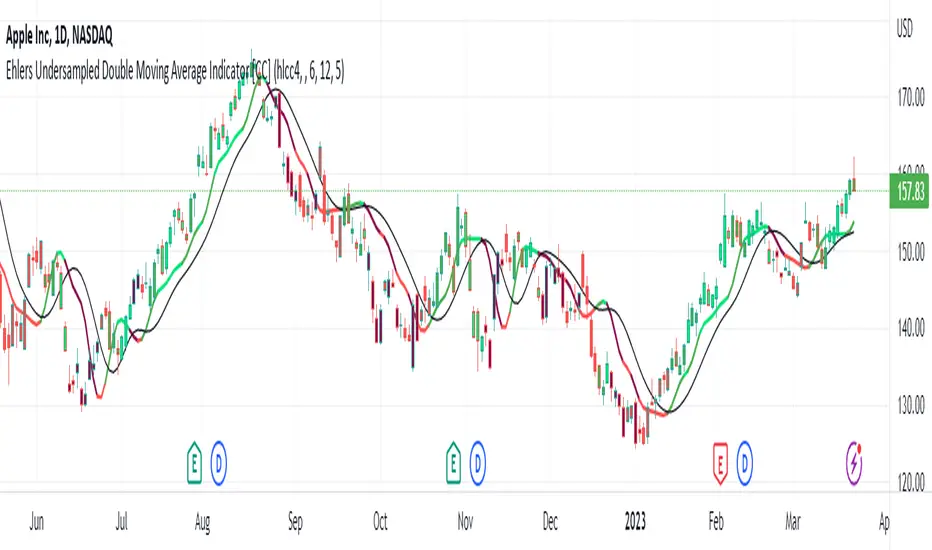
Ehlers Undersampled Double Moving Average Indicator [CC]The Undersampled Double Moving Average was created by John Ehlers (Stocks and Commodities April 2023), and this is a double moving average system which is pretty rare for John Ehlers. For those of you who would like my other take on an Ehlers double moving average, be sure to check out my previous Ehlers double moving average script . He came up with a unique idea for this indicator to create a moving average using a sample of the price data. For example, we use his suggested length of 5 only to use the price data every 5 bars. Feel free to change this, and please let me know if you find a length that works better. He then smooths the indicator using the Hann Windowed Moving Average . I color-coded the lines to show stronger signals in darker colors or standard signals in lighter colors. Buy when the line turns green and sell when it turns red.
Let me know if there is an indicator or script you would like to see me publish!
Cari dalam skrip untuk "移远通信+2023年4月+股价走势"
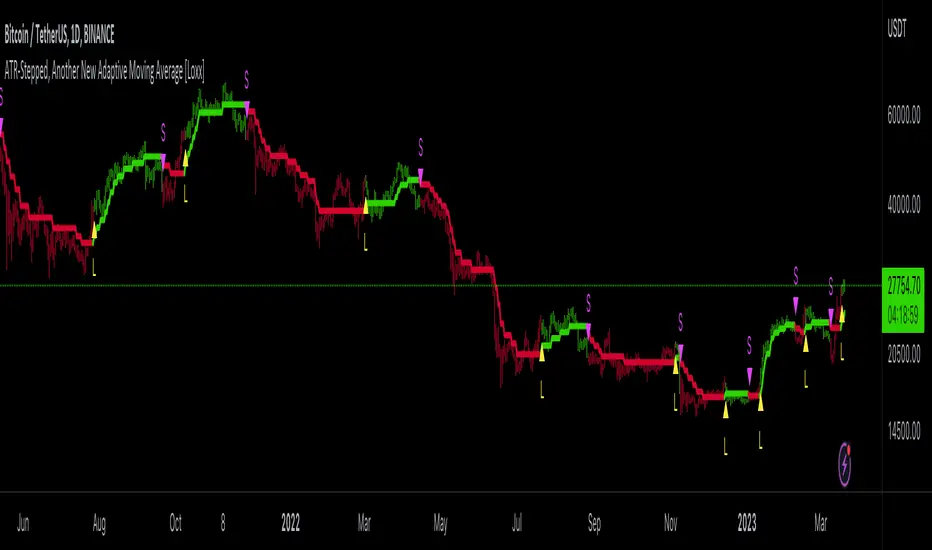
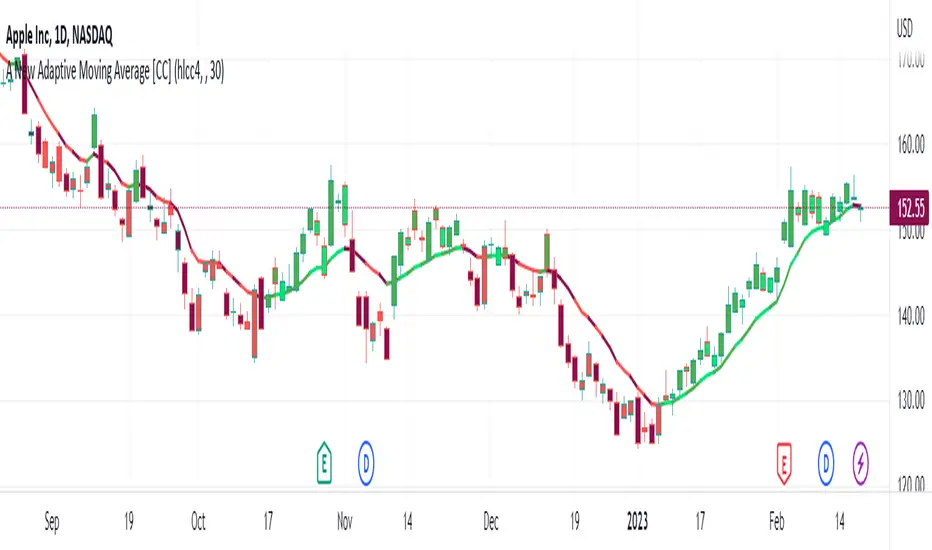
ATR-Stepped, Another New Adaptive Moving Average [Loxx]ATR-Filtered, Another New Adaptive Moving Average is a modification of @cheatcountry's "Another New Adaptive Moving Average " shown below
I've added AT- stepped filtering. This is a standard ATR filter that works by requiring movement by XX multiple of ATR before registering a trend flip. I've also included Loxx's Expanded Source Types. You can read about those here:
From @cheatcountry on A New Adaptive Moving Average
The New Adaptive Moving Average was created by Scott Cong (Stocks and Commodities Mar 2023) and this is a companion indicator to my previous script
This indicator still works off of the same concept as before with effort vs results but this indicator takes a slightly different approach and instead defines results as the absolute difference between the closing price and a closing price x bars ago. As you can see in my chart example, this indicator works great to stay with the current trend and provides either a stop loss or take profit target depending on which direction you are going in. As always, I use darker colors to show stronger signals and lighter colors to show normal signals. Buy when the line turns green and sell when it turns red.
Included
Alerts
Signals
Loxx's Expanded Source Types
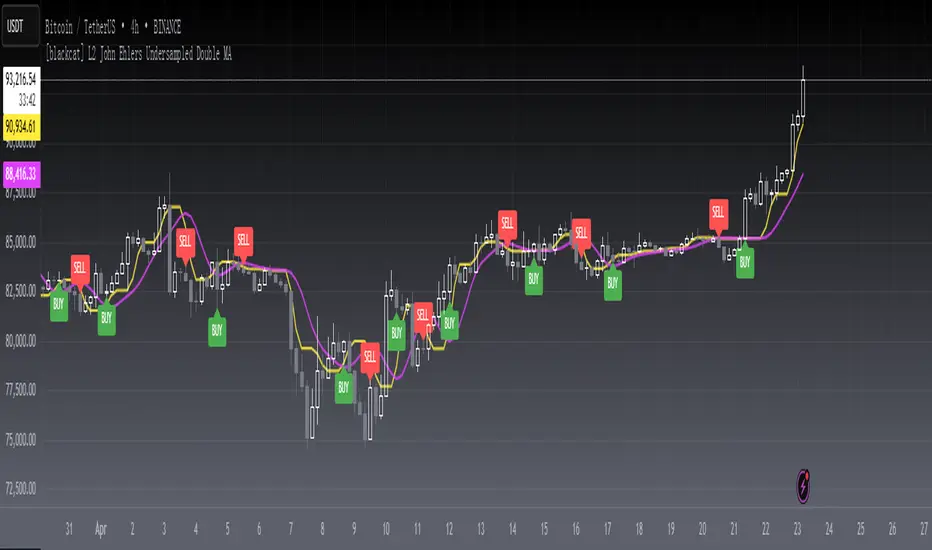
[blackcat] L2 John Ehlers Undersampled Double MALevel2
Background
This is a novel "undersampling data" processing trick proposed by John F. Ehlers in his April 2023 article "Just Ignore Them".
Function
In signal processing, undersampling, or bandpass sampling, is a technique whereby a bandpass-filtered signal is sampled at a sample rate below its Nyquist rate (twice the upper cut-off frequency), but the signal can still be reconstructed. When undersampling a bandpass signal, the samples are indistinguishable from samples of a low-frequency alias of the high-frequency signal.
John Ehlers notes that data smoothing is often used to avoid trading spikes. While this can result in fewer trading signals, it can also result in a delay in those trading signals. He describes how undersampling can be used in conjunction with Hann window finite impulse response (FIR) filters to remove high-frequency components in price data, resulting in less delay than traditional smoothing filters.
In this indicator, Hann windowing is applied a a pair of fast/slow moving averages which is used to improve their response perfomrnace. Yellow line is the fast line while fuchsia line is the slow line. You can judge bull bear stattus by checking the status it is in golden cross or in dead cross status.
Remarks
Feedbacks are appreciated.
Multi-Asset Month/Month % change 10yr Averages10 Year Averages of Month-on-Month % change: Shows current asset, and 3x user input assets
-For comparing seasonal tendencies among different assets.
-Choose from a variety of monthly average measures as source: sma(close, length), sma(ohlc4, length); as well as sma's of vwap, vwma, volume, volatility. (sma = simple moving average).
-Averages based on month cf previous month: i.e. Feb % = Feb compared to Jan; Jan % = Jan compared to prev year's Dec. Average of the last 10yrs of these values is the printed value.
-Plot on current year (2023), or previous year (2022). If Plotting on current year, and a month of year has not yet occured, a 9yr average will be printed.
/// notes ///
-daily bars in month is a global setting; so choose assets which have similar trading days per month. i.e. Crypto: length = 30 (days per month); Stocks/FX/Indices: length = 21 (days per month).
-only plots on Daily timeframe.
10yr Avgs; Plotting with Year = 2022; using sma(close, 21) as source for average M/M change

Global Unemployment RateThe Global Unemployment rate estimates what is the rate of unemployment of the whole world, taking same data from multiple countries and normalizing them.
It includes the Eurozone + 19 countries from all the continents, which are some of the richest countries as well as some of the most populous.
It sadly does not include India as its unemployment data on trading view as of today (Feb 2023) is only since year 2019, which is too short

Strategy for UT Bot Alerts indicator Using the UT Bot alerts indicator by @QuantNomad, this strategy was designed for showing an example of how this indicator could be used, also, it has the goal to help some people from a group that use to use this indicator for their trading. Under any circumstance I recommend to use it without testing it before in real time.
Backtesting context: 2020-02-05 to 2023-02-25 of BTCUSD 4H by Tvc. Commissions: 0.03% for each entry, 0.03% for each exit. Risk per trade: 2.5% of the total account
For this strategy, 3 indicators are used:
UT Bot Alerts indicator by Quantnomad
One Ema of 200 periods for indicate the trend
Atr stop loss from Gatherio
Trade conditions:
For longs:
Close price is higher than Atr from UT Bot
Ema from UT Bot cross over Atr from UT Bot.
This gives us our long signal. Stop loss will be determined by atr stop loss (white point), break even(blue point) by a risk/reward ratio of 0.75:1 and take profit of 3:1 where half position will be closed. This will be showed as buy (open long position)
The other half will be closed when close price is lower than Atr and Ema from UT Bot cross under Atr. This will be showed as cl buy (close long position)
For shorts:
Close price is lower than Atr from UT Bot
Ema from UT Bot cross over Atr from UT Bot.
This gives us our short signal. Stop loss will be determined by atr stop loss (white point), break even(blue point) by a risk/reward ratio of 0.75:1 and take profit of 3:1 where half position will be closed. This will be showed as sell (open short position)
The other half will be closed when close price is higher than Atr and Ema from UT Bot cross over Atr. This will be showed as cl sell (close short position)
Risk management
For calculate the amount of the position you will use just a small percent of your initial capital for the strategy and you will use the atr stop loss for this.
Example: You have 1000 usd and you just want to risk 2,5% of your account, there is a long signal at price of 20,000 usd. The stop loss price from atr stop loss is 19,000. You calculate the distance in percent between 20,000 and 19,000. In this case, that distance would be of 5,0%. Then, you calculate your position by this way: (initial or current capital * risk per trade of your account) / (stop loss distance).
Using these values on the formula: (1000*2,5%)/(5,0%) = 500usd. It means, you have to use 500 usd for risking 2.5% of your account.
We will use this risk management for apply compound interest.
In settings, with position amount calculator, you can enter the amount in usd of your account and the amount in percentage for risking per trade of the account. You will see this value in green color in the upper left corner that shows the amount in usd to use for risking the specific percentage of your account.
Script functions
Inside of settings, you will find some utilities for display atr stop loss, break evens, positions, signals, indicators, etc.
You will find the settings for risk management at the end of the script if you want to change something. But rebember, do not change values from indicators, the idea is to not over optimize the strategy.
If you want to change the initial capital for backtest the strategy, go to properties, and also enter the commisions of your exchange and slippage for more realistic results.
In risk managment you can find an option called "Use leverage ?", activate this if you want to backtest using leverage, which means that in case of not having enough money for risking the % determined by you of your account using your initial capital, you will use leverage for using the enough amount for risking that % of your acount in a buy position. Otherwise, the amount will be limited by your initial/current capital
---> Do not forget to deactivate Trades on chart option in style settings for a cleaner look of the chart <---
Some things to consider
USE UNDER YOUR OWN RISK. PAST RESULTS DO NOT REPRESENT THE FUTURE.
DEPENDING OF % ACCOUNT RISK PER TRADE, YOU COULD REQUIRE LEVERAGE FOR OPEN SOME POSITIONS, SO PLEASE, BE CAREFULL AND USE CORRECTLY THE RISK MANAGEMENT
Do not forget to change commissions and other parameters related with back testing results!
Strategies for trending markets use to have more looses than wins and it takes a long time to get profits, so do not forget to be patient and consistent !
---> The strategy can still be improved, you can change some parameters depending of the asset and timeframe like risk/reward for taking profits, for break even, also the main parameters of the UT Bot Alerts <----

Another New Adaptive Moving Average [CC]The New Adaptive Moving Average was created by Scott Cong (Stocks and Commodities Mar 2023) and this is a companion indicator to my previous script . This indicator still works off of the same concept as before with effort vs results but this indicator takes a slightly different approach and instead defines results as the absolute difference between the closing price and a closing price x bars ago. As you can see in my chart example, this indicator works great to stay with the current trend and provides either a stop loss or take profit target depending on which direction you are going in. As always, I use darker colors to show stronger signals and lighter colors to show normal signals. Buy when the line turns green and sell when it turns red.
Let me know if there are any other indicator scripts you would like to see me publish!

Markdown: The Pine Editor's Hidden Gem💬 Markdown, a markup language
Markdown is a portable, lightweight markup language that can be used for everything whether you're building a website, documentation, or even presentations.
Platforms like Discord, Reddit, and GitHub support Markdown and is the widely go-to option for text formatting due to its simplicity. Pine Script is a language that also utilizes Markdown, specifically in the Pine Editor where it can really be used to some extent.
Since the release of libraries, user-defined types, and methods, Pine Script is entering an age where developers will be highly dependent on libraries due to the capabilities Pine has inherited recently. It would be no surprise if a few people got together and took their time to thoroughly develop an entire project/library centered around improving Pine Script's built-in functions and providing developers with easier ways of achieving things than they thought they could.
As you're all aware, hovering over functions (and more) in the editor pops up a prompt that specifies the parameters, types, and what the function returns. Pine Script uses Markdown for that, so I figured we could go ahead and push that feature to its limits and see what we can do.
Today we'll go over how we can utilize Markdown in Pine Script, and how you can make your library's built-in functions stand out more than they did previously.
For more information, visit www.markdownguide.org
📕 General Notes
Markdown syntax only works on functions and methods.
Using arrays as parameters as of 2/21/2023 breaks the Markdown system.
The prompt window holds a max of 166 characters on one line before overflowing.
There is no limit on how long the prompt window can be.
🔽 Getting Started 🔽
▶️ Headings
If you have experience in HTML, Markdown, or even Microsoft Word then you already have a grasp of how headings work and look.
To simplify it, headings make the given text either massive or tiny depending on how many number symbols are provided.
When defining headings, you must have a space between the number (#) symbol, and the text. This is typical syntax throughout the language.
Pine Script uses bold text by applying (**) for their titles on their built-ins (e.g. @returns) but you could also use heading level 4 (####) and have it look the same.
▶️ Paragraphs & Line Breaks
You may want to provide extensive details and examples relating to one function, in this case, you could create line breaks. Creating line breaks skips to the next line so you can keep things organized as a result.
To achieve a valid line break and create a new paragraph, you must end the line with two or more spaces.
If you want to have an empty line in between, apply a backslash (\).
Backslashes (\) are generally not recommended for every line break. In this case, I only recommend using them for empty lines.
▶️ Text Formatting
Markdown provides text formatting such as bold, italics, and strikethrough.
For bolding text, you can apply open and close (**) or (__).
For italicizing text, you can apply open and close (*) or (_).
For bolding and italicizing text, you can apply open and close (***) or (___).
For s̶t̶r̶i̶k̶e̶t̶h̶r̶o̶u̶g̶h̶, you need to apply open and close (~~).
This was mentioned in the Headers section, but Pine Script's main titles (e.g. @returns or @syntax) use bold (**) by default.
▶️ Blockquotes
Blockquotes in Pine Script can be visualized as a built-in indentation system.
They are declared using greater than (>) and everything will be auto-aligned and indented until closed.
By convention you generally want to include the greater than (>) on every line that's included in the block quote. Even when not needed.
If you would like to indent even more (nested blockquotes), you can apply multiple greater than symbols (>). For example, (>>)
Blockquotes can be closed by ending the next line with only one greater than (>) symbol, or by using a horizontal rule.
▶️ Horizontal Rules
Horizontal rules in Pine Script are what you see at the very top of the prompt in built-ins.
When hovering, you can see the top of the prompt provides a line, and we can actually reproduce these lines.
These are extremely useful for separating information into their own parts and are accessed by applying 3 underscores (___), or 3 asterisks (***).
Horizontal rules were mentioned above, when we were discussing block quotes. These can also be used to close blockquotes as well.
Horizontal rules require a minimum of 3 underscores (___) or 3 asterisks (***).
▶️ Lists
Lists give us a way to structure data in a somewhat neat way. There are multiple ways to start a list, such as
1. First Item (number followed by a period)
- First Item (dash)
+ First Item (plus sign)
* First Item (asterisk)
Using number-based lists provide an ordered list, whereas using (-), (+), or (*) will provide an unordered list (bullet points).
If you want to begin an unordered list with a number that ends with a period, you must use an escape sequence (\) after the number.
Standard indentation (tab-width) list detection isn't supported, so to nest lists you have to use blockquotes (>) which may not look as appealing.
▶️ Code Blocks
Using code blocks allows you to write actual Pine Script code inside the prompt.
It's a game changer that can potentially help people understand how to execute functions quickly.
To use code blocks, apply three 3 open and close backquotes (```). Built-in's use (```pine) but there's no difference when we apply it.
Considering that tab-width indentation isn't detected properly, we can make use of the blockquotes mentioned above.
▶️ Denotation
Denoting can also be seen as highlighting a background layer behind text. They're basically code blocks, but without the "block".
Similar to how code blocks work, we apply one backquote open and close (`).
Make sure to only use this on important keywords. There really isn't a conventional way of applying this.
It's up to you to decide what people should have their eyes tracked onto when they hover over your functions.
If needed, look at how Pine Script's built-in variables and functions utilize this.
▶️ Tables
Tables are possible in Markdown, although they may look a bit different in the Pine Editor.
They are made by separating text with vertical bars (|).
The headers are detected when there is a minimum of one hyphen (-) below them.
You can align text by using a colon as I do in the photo. Hyphens must be connected to the colon in order to display correctly.
Tables aren't ideal to use in the editor but are there if anyone wants to give it a go.
▶️ Links & Images
Markdown supports images and hyperlinks, which means we can also do that here in the Pine Editor. Cool right?
If you want to create a hyperlink, surround the displayed text in open and close brackets .
If you want to load a photo into your prompt, it's the same syntax as the hyperlink, except it uses a (!)
See syntax list below.
Here are realistic usage examples. (Snippets from code below)
These follow the same syntax as the built-ins.
I'm not using horizontal rules here, but it's entirely up to you.
▶️ Syntax List
Headings
Level 1: #
Level 2: ##
Level 3: ###
Level 4: ####
Level 5: #####
Level 6: ######
Line Breaks
Text (two spaces)
Text\ (backslash)
Text Formatting
Bold (**)
Italic (**)
Strikethrough (~~)
Blockquotes
Indent (>)
Double Indent (>>)
Triple Indent (>>>) and so on.
Horizontal Rules
(___) or (***)
Lists
Ordered List (1.)
Unordered List (-) or (+) or (*)
Code Blocks
(```) or (```pine)
Denotation
(`)
Tables
(|) and (-) and (:)
Hyperlinks
(URL)
Images
! (URL)
Hope this helps. 👍

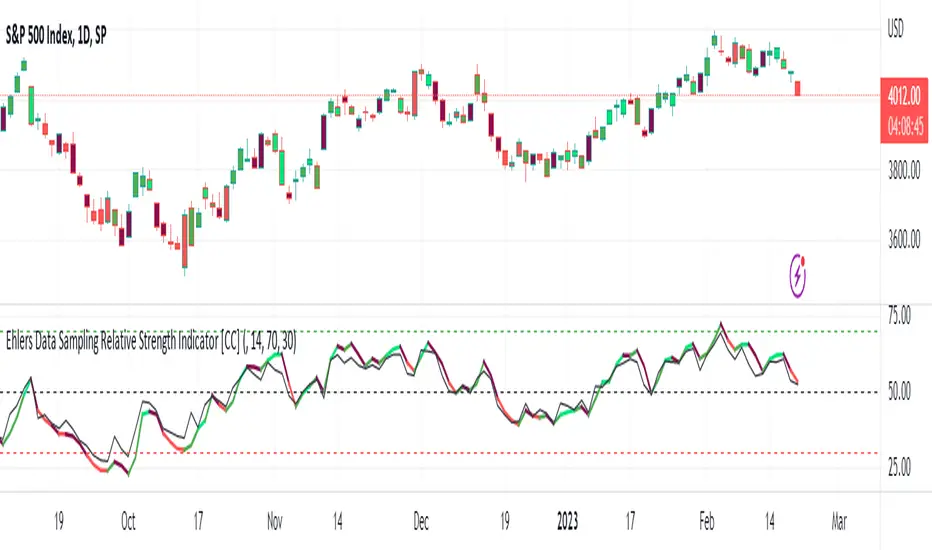
Ehlers Data Sampling Relative Strength Indicator [CC]The Data Sampling Indicator was created by John Ehlers (Stocks and Commodities Mar 2023) and this is a genius method to reduce noise in the market data but also doesn't introduce any lag while doing so. The way this works is because traditionally, people have always relied on the close price as the default input for many indicators such as the RSI or MACD as examples. Since the open is usually virtually identical to the previous close, it has been ignored by most people but Ehlers discovered that if you do a simple average of open and close for the input on any indicator, you can remove much of the noise without any added lag. I have used the RSI as he did in his example and plotted both to show the difference between the traditional RSI and using Ehlers' process as the new Data Sampling RSI. You can clearly see that this new RSI follows the price fluctuations much closer and is much smoother than the traditional RSI. As usual, I have included different colors to show the strength of the buy or sell signals so darker colors mean it is a very strong signal and lighter colors means it is a normal signal. Buy when the line turns green and sell when it turns red.
Feel free to try out this method to replace the input for any indicator and let me know how this works for you! And of course let me know if you would like me to publish any indicator script.
A New Adaptive Moving Average [CC]The New Adaptive Moving Average was created by Scott Cong (Stocks and Commodities Mar 2023) and his idea was to focus on the Adaptive Moving Average created by Perry Kaufman and to try to improve it by introducing a concept of effort vs results. In this case the effort would be the total range of the underlying price action since each bar is essentially a war of the bulls vs the bears. The result would be the total range of the close so we are looking for the highest close and lowest close in that same time period. This gives us an alpha that we can use to plug into the Kaufman Adaptive Moving Average algorithm which gives us a brand new indicator that can hug the price just enough to allow us to ride the stock up or down. I have color coded it to be darker colors when it is a strong signal and lighter colors when it is a normal signal. Buy when the line turns green and sell when it turns red.
Let me know if there are any other indicators you would like to see me publish!
Investments/swing trading strategy for different assetsStop worrying about catching the lowest price, it's almost impossible!: with this trend-following strategy and protection from bearish phases, you will know how to enter the market properly to obtain benefits in the long term.
Backtesting context: 1899-11-01 to 2023-02-16 of SPX by Tvc. Commissions: 0.05% for each entry, 0.05% for each exit. Risk per trade: 2.5% of the total account
For this strategy, 5 indicators are used:
One Ema of 200 periods
Atr Stop loss indicator from Gatherio
Squeeze momentum indicator from LazyBear
Moving average convergence/divergence or Macd
Relative strength index or Rsi
Trade conditions:
There are three type of entries, one of them depends if we want to trade against a bearish trend or not.
---If we keep Against trend option deactivated, the rules for two type of entries are:---
First type of entry:
With the next rules, we will be able to entry in a pull back situation:
Squeeze momentum is under 0 line (red)
Close is above 200 Ema and close is higher than the past close
Histogram from macd is under 0 line and is higher than the past one
Once these rules are met, we enter into a buy position. Stop loss will be determined by atr stop loss (white point) and break even(blue point) by a risk/reward ratio of 1:1.
For closing this position: Squeeze momentum crosses over 0 and, until squeeze momentum crosses under 0, we close the position. Otherwise, we would have closed the position due to break even or stop loss.
Second type of entry:
With the next rules, we will not lose a possible bullish movement:
Close is above 200 Ema
Squeeze momentum crosses under 0 line
Once these rules are met, we enter into a buy position. Stop loss will be determined by atr stop loss (white point) and break even(blue point) by a risk/reward ratio of 1:1.
Like in the past type of entry, for closing this position: Squeeze momentum crosses over 0 and, until squeeze momentum crosses under 0, we close the position. Otherwise, we would have closed the position due to break even or stop loss.
---If we keep Against trend option activated, the rules are the same as the ones above, but with one more type of entry. This is more useful in weekly timeframes, but could also be used in daily time frame:---
Third type of entry:
Close is under 200 Ema
Squeeze momentum crosses under 0 line
Once these rules are met, we enter into a buy position. Stop loss will be determined by atr stop loss (white point) and break even(blue point) by a risk/reward ratio of 1:1.
Like in the past type of entries, for closing this position: Squeeze momentum crosses over 0 and, until squeeze momentum crosses under 0, we close the position. Otherwise, we would have closed the position due to break even or stop loss.
Risk management
For calculating the amount of the position you will use just a small percent of your initial capital for the strategy and you will use the atr stop loss for this.
Example: You have 1000 usd and you just want to risk 2,5% of your account, there is a buy signal at price of 4,000 usd. The stop loss price from atr stop loss is 3,900. You calculate the distance in percent between 4,000 and 3,900. In this case, that distance would be of 2.50%. Then, you calculate your position by this way: (initial or current capital * risk per trade of your account) / (stop loss distance).
Using these values on the formula: (1000*2,5%)/(2,5%) = 1000usd. It means, you have to use 1000 usd for risking 2.5% of your account.
We will use this risk management for applying compound interest.
In settings, with position amount calculator, you can enter the amount in usd of your account and the amount in percentage for risking per trade of the account. You will see this value in green color in the upper left corner that shows the amount in usd to use for risking the specific percentage of your account.
Script functions
Inside of settings, you will find some utilities for display atr stop loss, break evens, positions, signals, indicators, etc.
You will find the settings for risk management at the end of the script if you want to change something. But rebember, do not change values from indicators, the idea is to not over optimize the strategy.
If you want to change the initial capital for backtest the strategy, go to properties, and also enter the commisions of your exchange and slippage for more realistic results.
If you activate break even using rsi, when rsi crosses under overbought zone break even will be activated. This can work in some assets.
---Important: In risk managment you can find an option called "Use leverage ?", activate this if you want to backtest using leverage, which means that in case of not having enough money for risking the % determined by you of your account using your initial capital, you will use leverage for using the enough amount for risking that % of your acount in a buy position. Otherwise, the amount will be limited by your initial/current capital---
Some things to consider
USE UNDER YOUR OWN RISK. PAST RESULTS DO NOT REPRESENT THE FUTURE.
DEPENDING OF % ACCOUNT RISK PER TRADE, YOU COULD REQUIRE LEVERAGE FOR OPEN SOME POSITIONS, SO PLEASE, BE CAREFULL AND USE CORRECTLY THE RISK MANAGEMENT
Do not forget to change commissions and other parameters related with back testing results!
Some assets and timeframes where the strategy has also worked:
BTCUSD : 4H, 1D, W
SPX (US500) : 4H, 1D, W
GOLD : 1D, W
SILVER : 1D, W
ETHUSD : 4H, 1D
DXY : 1D
AAPL : 4H, 1D, W
AMZN : 4H, 1D, W
META : 4H, 1D, W
(and others stocks)
BANKNIFTY : 4H, 1D, W
DAX : 1D, W
RUT : 1D, W
HSI : 1D, W
NI225 : 1D, W
USDCOP : 1D, W

VIB / GIB v1.0The VIB / GIB indicator
V1 ----- 13 Feb 2023 ------------ Inital release.
This gives the user the ability to easily display VIB(Volume ImBalances) and GIB(Gap ImBalances) on their chart.
Volume imbalances (VIB) are created when there is a price difference between the close of a candle and the opening of the next candle. This price difference can be used as a level of support or resistance in future trading.
A Gap imbalance (GIB) has the same principles as a VIB, but also has the feature that no wick closes through the gap, showing an even more powerful imbalance in the market at that point.
GIBs and VIBs can be individually switched on or off via the settings, and optional icons can also be activated or not to show where the imbalance took place.
Please note that this is purely an indicator that should be used with other confluence before making trading decisions.
Kitti-Playbook request.earnings R0.0Date: Feb 5 2023
Objective :
Display Earnings per share
Calculation :
Get Earning value by use Function "request.earnings "
Display :
Plot Earnings Data
Earnings History Tab

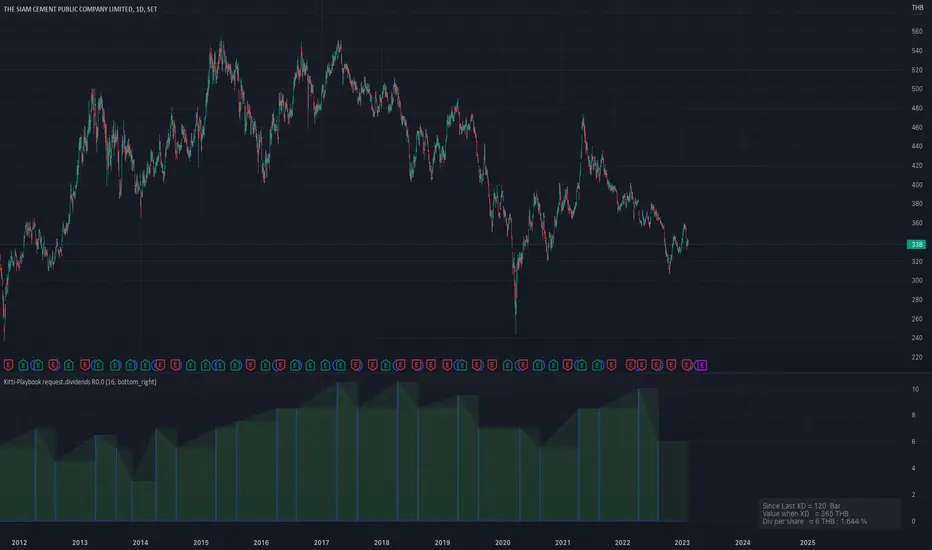
Kitti-Playbook request.dividends R0.0 Date Feb 5 2023
Objective : Display Dividends Amount per Share
Calculation :
Use function ==> request.dividends(ticker, field, gaps, lookahead, ignore_invalid_symbol, currency )
Display : The value get from " request.dividends "
Kitti-Playbook Request.Volume X Price R0.00Date Jan 31 2023
Objective : To display value of Volume X Last Price for Stock Market and Necessary Symbol information such as Listed Shares , Volume
Calculation :
Volume X Price = Volume X Last Price ( Market Cap )

Stock Relative Strength Power IndexAs always, this is not financial advice and use at your own risk. Trading is risky and can cost you significant sums of money if you are not careful. Make sure you always have a proper entry and exit plan that includes defining your risk before you enter a trade.
This idea recently came out of some discussions I stumbled across in a trading group I am a part of regarding Relative Strength and Relative Weakness (shortened to RS and RW from here on out). The whole mechanism behind this trading system is to filter out underperforming securities relative to the current market direction to be in only the strongest or weakest stocks when the market is currently experiencing a bullish or bearish cycle. The idea behind this is there is no point in parking your money into a stock that is treading water or even going down if the market is making strong moves upwards. At that point, you are at worst losing money, and at best trading equal to the index/ETF, in which case the argument is why are you not just trading the index/ETF instead? RS or RW will filter out these sector laggards and allow you to position yourself into strong (or the strongest) stocks at any given time to help improve portfolio performance. Further, not only does it protect your position should the market shift against you briefly, it also often sees exceptional performance in the same cycle. For example, if $SPY makes a 5% move over the course of a month, a stock with RS/RW may make a 10% move, or more, allowing you to see increased profit potential.
RS/RW is based on the idea of performance, that is the raw percent change of a security over a given time period relative to a benchmark. This benchmark is often the S&P500 (ES/SPX/SPY and their derivatives). I have to stress that this is not beta, which measures the volatility of a stock over a given period (i.e. if $SPY moves $1, $NVDA will often move $1.74). This is a measurement of the market (i.e. $SPY) has moved 1% over the course of a day, $NVDA has moved 8% over the course of the day. This is very often used as a signal of institutional interest as apart from some very unique moments, retail traders cannot and will not provide enough market pressure to move a market outside of a stock's normal trading range, nor will they outperform the sector or market as a whole consistently over time without some big money to make them move. The problem with running strict performance analysis (i.e. % change from period T ago to period T + n at present) is that while it gives us a baseline of how much the stock has moved, it doesn't overall mean much. For instance, if a $100 stock has moved 5% today, but has been experiencing a period of increased volatility and it's Average True Range (ATR) (the amount a stock will move over X number of periods, on average) is $7, performance seems impressive but is actually generally fairly weak to what the stock has been doing recently. Conversely, if we take a second stock, this time worth $20, and it too has moved 5% in one day but has an ATR of only $0.25, that stock has made an exceptional move and we want to be part of that.
Here, I have created an indicator called the Stock Relative Strength Power Index. This takes the stock's rate of change (ROC) (the % move it has made over X number of periods), the stock's normalized ATR (the ATR represented as a percentage instead of a raw value), and compares these to one another to get the "Power Rating": a representation of the true strength of a stock over X number of periods. The indicator does two things. First, the raw ROC is divided by the stock's normalized ATR to assess whether the stock is moving outside of its normal range of variation or not. Second, since we are interested in trading only stocks with exceptional RS/RW to the market, I have also applied this same calculation to the S&P500 ($SPY) and the various SPDR sector indexes. These comparisons allow for a rapid and accurate assessment of the true strength of a stock at any given time on any given time frame. To cycle back above to our examples, the $100 stock has a Power Rating of only 0.71 (i.e. it is trading less than its current average), while our $20 stock has a Power Rating of 5. If we then compare these to both the market as a whole and the sector that the stock is a part of, we get a much clearer indication of the true buying or selling pressure imposed on the stock at any given time.
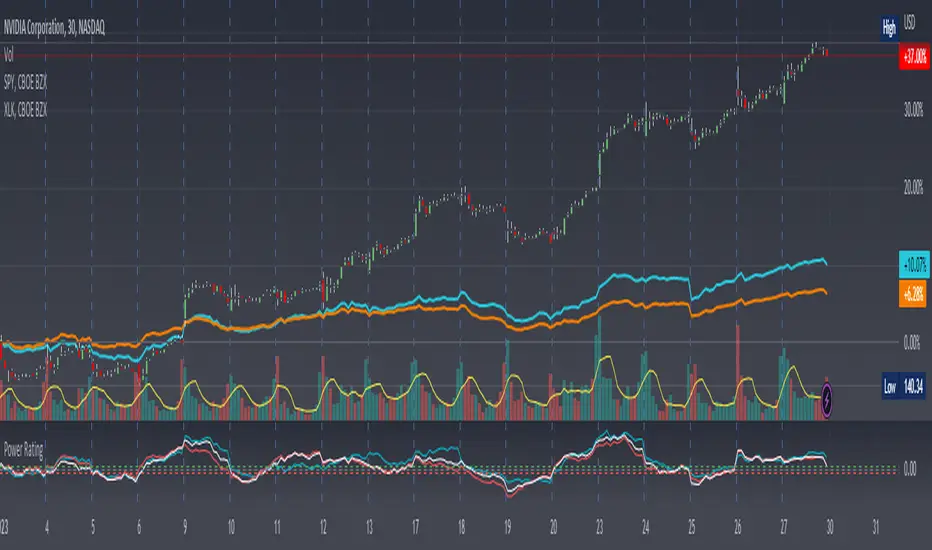
Use:
The indicator has 3 lines. The blue line is the security of interest, the red line is the market baseline (i.e. the sector ETF $SPY), and the white line is the sector index. I have given an example above on the semiconductor/tech stock $NVDA on a 30min timeframe. You can see that since the start of 2023, $NVDA has generally been strong to the market and its own sector since the blue line is greater than both the red and white lines over many days. This would have provided some nice day trading opportunities, or even some nice short term swing trades. The values themselves are generally meaningless outside of either the 1 or -1 value lines. All that matters is that the current ticker is surpassing both the market and the sector while being > 1.0 for a long trade or less than -1.0 for a short trade. However, I must stress this indicator gives no trade signals on its own, it is purely a confirmation indicator. An example of a trade would be if you had a trade signal given by either an indicator or by price action suggesting to buy some $NVDA for a trade to the upside, the Power Rating indicator would confirm this by showing if $NVDA was actually showing true strength by being both greater than 1 (the cutoff for it surpassing its ATR) and being above both the red and white lines. Further, you can see $NVDA has been stronger than the market when using the comparison function as well, but the has fluxed in and out of strength intraday when using the actual indicator vs. the static performance ratio chart (plotted as line graphs on the chart).
I have made it possible to change the colour of the plots and the line levels. The adjustment of the line levels gives the trader the flexibility to change their target breakout level (i.e. only trading stocks that have a Power Rating > 2, for example, meaning they are trading at least 2X their normal trading range). The third security comparison is flexible and can be used to compare to the sector ETF (initial intention) or it can be used to compare to other tickers within the same sector, for example. The trader should select the appropriate ETF for the given security of interest to avoid false confirmation if they want to use an ETF as their third input. The proper sector should be readily available on most online websites and accessible in a matter of seconds meaning that the delay is minimal, at worst. If a trader wishes to add additional functionality, such as a crypto trader using BTCUSD as the benchmark instead of $SPY, I encourage them to copy and paste this script and modify as needed since I have made this open source.
This indicator works on all timeframes. The lookback period can be changed, so a day trader who may use a 5min chart (and use a period of 12 to get the hourly Power Rating) will find this equally useful as someone who may be a core trader who wants to look at the performance over the course of years and may use a 60 period on a monthly chart.
Happy trading and I hope this helps!
Market Structure MA Based BOS [liwei666]
🎲 Overview
🎯 This BOS(Break Of Structure) indicator build based on different MA such as EMA/RMA/HMA, it's usually earlier than pivothigh() method
when trend beginning, customer your BOS with 2 parameters now.
🎲 Indicator design logic
🎯 The logic is simple and code looks complex, I‘ll explain core logic but not code details.
1. use close-in EMA's highest/lowest value mark as SWING High/Low when EMA crossover/under,
not use func ta.pivothigh()/ta.pivotlow()
2. once price reaching EMA’s SWING High/Low, draw a line link High/Low to current bar, labled as BOS
3. find regular pattern benefit your trading.
🎲 Settings
🎯 there are 4 input properties in script, 2 properties are meaningful in 'GRP1' another 2 are display config in 'GRP2'.
GRP1
MA_Type: MA type you can choose(EMA/RMA/SMA/HMA), default is 'HMA'.
short_ma_len: MA length of your current timeframe on chart
GRP2
show_short_zz: Show short_ma Zigzag
show_ma_cross_signal: Show ma_cross_signal
🎲 Usage
🎯 BOS signal usually worked fine in high volatility market, low volatility is meaningless.
🎯 We can see that it performs well in trending market of different symbols, and BOS is an opportunity to add positions
BINANCE:BTCUSDTPERP
BINANCE:ETHUSDTPERP
🎯 MA Based signal is earlier than pivothigh()/pivotlow() method when trend beginning. it means higher profit-loss rate.
🎯 any questions or suggestion please comment below.
Additionally, I plan to publish 20 profitable strategies in 2023; indicatior not one of them,
let‘s witness it together!
Hope this indicator will be useful for you :)
enjoy! 🚀🚀🚀

Multi-Timeframe MA Based Zigzag[liwei666]🎲 Overview
🎯 This Zigzag indicator build based on different MA such as EMA/HMA/RMA/SMA, support multi-timeframe setting .
you can get customer zigzag indicator by change short/long ma length and high-timeframe config(5m/15m/30m/1h/2h) in any symbol.
🎲 Indicator design logic
🎯 entired logic is simple and code looks complex, I‘ll explain core logic here, code already equipped with detailed comments.
1. use close-in EMA's highest/lowest value mark as SWING High/Low when EMA crossover/under, not use func ta.pivothigh()/ta.pivotlow()
2. when EMA crossover/under plot a char as signal like ●/❄/▲, crossover get blue char crossunder get red char
3. latest zigzag line is not drawn until EMA is turned (crossover/under), but signal is realtime
4. you can see diff zigzag structure when you open high-timeframe config, then find regular pattern benefit your trading.
🎲 Settings
🎯 there are 3 group properties in script, just focus on 5 properties in 'GRP1' ,
'GRP2' and 'GRP3' are display config.
'GRP1':
MA_Type: MA type you can choose(EMA/RMA/SMA/HMA/WMA), default is EMA
short_ma_len: short MA length of your current timeframe on chart
long_ma_len: long MA length of your current timeframe on chart
htf_ma_len: MA length of high timeframe, MA type same as 'MA_Type' config
htf_ma_tf: high timeframe ma length, 15/30/60/120 minute
'GRP2':
• show_short_zz • show_long_zz • show_htf_zz:
'GRP3':
• show_short_ma_line • show_short_ma_signal
• show_long_ma_line • show_long_ma_signal
• show_htf_ma_line • show_htf_ma_signal
🎲 Usage
🎯 As we know, MA based signal usually worked fine in trend market , low volatility is unprofitable.
🎯 One of pattern as the chart show below.
1. success example : after a blue ▲ signal, entry long when blue ● signal appear, marked with green box.
2. failed example: after a blue ▲ signal, a red ▼ signal appear, marked with white box.
🎯 BoS(Break of Structure) based on ma zigzag is a good idea I'm implementing, it will be published in next script.
Additionally, I plan to publish 20 profitable strategies in 2023; this indicatior not one of them,
let‘s witness it together!
Hope this indicator will be useful for you :)
enjoy! 🚀🚀🚀

Simple SuperTrend Strategy for BTCUSD 4HHello guys!, If you are a swing trader and you are looking for a simple trend strategy, you should check this one. Based in the supertrend indicator, this strategy will help you to catch big movements in BTCUSD 4H and avoid losses as much as possible in consolidated situations of the market
This strategy was designed for BTCUSD in 4H timeframe
Backtesting context: 2020-01-02 to 2023-01-05 (The strategy has also worked in previous years)
Trade conditions:
Rules are actually simple, the most important thing is the risk and position management of this strategy
For long:
Once Supertrend changes from a downtrend to a uptrend, you enter into a long position. The stop loss will be defined by the atr stop loss
The first profit will be of 0.75 risk/reward ratio where half position will be closed. When this happens, you move the stop loss to break even.
Now, just will be there two situations:
Once Supertrend changes from a uptrend to a downtrend, you close the other half of the initial long position.
If price goes againts the position, the position will be closed due to breakeven.
For short:
Once Supertrend changes from a uptrend to a downtrend, you enter into a short position. The stop loss will be defined by the atr stop loss
The first profit will be of 0.75 risk/reward ratio where half position will be closed. When this happens, you move the stop loss to break even.
Like in the long position, just will be there two situations:
Once Supertrend changes from a downtrend to a uptrend, you close the other half of the initial short position.
If price goes againts the position, the position will be closed due to breakeven.
Risk management
For calculate the amount of the position you will use just a small percent of your initial capital for the strategy and you will use the atr stop loss for this.
Example: You have 1000 usd and you just want to risk 2,5% of your account, there is a long signal at price of 20,000 usd. The stop loss price from atr stop loss is 19,000. You calculate the distance in percent between 20,000 and 19,000. In this case, that distance would be of 5,0%. Then, you calculate your position by this way: (initial or current capital * risk per trade of your account) / (stop loss distance).
Using these values on the formula: (1000*2,5%)/(5,0%) = 500usd. It means, you have to use 500 usd for risking 2.5% of your account.
We will use this risk management for apply compound interest.
Script functions
Inside of settings, you will find some utilities for display atr stop loss, supertrend or positions.
You will find the settings for risk management at the end of the script if you want to change something. But rebember, do not change values from indicators, the idea is to not over optimize the strategy.
If you want to change the initial capital for backtest the strategy, go to properties, and also enter the commisions of your exchange and slippage for more realistic results.
Signals meanings:
L for long position. CL for close long position.
S for short position. CS for close short position.
Tp for take profit (it also appears when the position is closed due to stop loss, this due to the script uses two kind of positions)
Exit due to break even or due to stop loss
Some things to consider
USE UNDER YOUR OWN RISK. PAST RESULTS DO NOT REPRESENT THE FUTURE.
DEPENDING OF % ACCOUNT RISK PER TRADE, YOU COULD REQUIRE LEVERAGE FOR OPEN SOME POSITIONS, SO PLEASE, BE CAREFULL AND USE CORRECTLY THE RISK MANAGEMENT
The amount of trades closed in the backtest are not exactly the real ones. If you want to know the real ones, go to settings and change % of trade for first take profit to 100 for getting the real ones. In the backtest, the real amount of opened trades was of 194.
Indicators used:
Supertrend
Atr stop loss by garethyeo
This is the fist strategy that I publish in tradingview, I will be glad with you for any suggestion, support or advice for future scripts. Do not doubt in make any question you have and if you liked this content, leave a boost. I plan to bring more strategies and useful content for you!

ATR_RSI_Strategy v2 with no repaint [liwei666]🎲 Overview
🎯 this is a optimized version based on ATR_RSI_Strategy with no-repaint.
Sharpe ratio: 1.4, trade times: 116 ,
trade symbol: BINANCE:BTCUSDTPERP 15M
you can get same backtesting result with the correct settings.
🎲 Strategy Logic
🎯 the core logic is quite simple, use ATR and RSI and SMA
1. when price is in high volatility ( atr_value > atr_ma);
2. wait for a break signal (rsi_value > rsi_buy or rsi_value < rsi_sell);
3. entry Long or Short,use trailing stop-loss to max security and percent TP to keep profit.
🎲 Settings
🎯 there are 7 input properties in script, but I only finetune 4 of them ( bold field below ),
you may change other parameter to get better result by yourself.
atr_length: length to get atr value
atr_ma_length : length of smoothing atr value
atr_ma_norm_min : atr_ma normalized min value, filter high volatility ranges
atr_ma_norm_max : atr_ma normalized max value, filter high volatility ranges
rsi_length : length to get rsi value
rsi_entry: 50 +/- rsi_entry to get entry threshold
trailing_percent: trailing stop-loss percent
🎲 Usage
🎯 the commission set to 0.05% , part of exchange the commission is less than 0.05% in reality,
but I will still use 0.05% in my next script.
🎯 this script use 50% of equity to size positions follow general script position,
you can adjust the value to fix size or 100% of equity to compare result with other strategy,
but I still suggest you use 5-10% of equity for each strategy in reality.
🎯any questions please comment below. if there are any words violate House Rule, please tell me below and i will revise immediately
don't want be hiddened again 😂😂
Additionally, I plan to publish 20 profitable strategies in 2023;
let‘s witness it together!
Hope this strategy will be usefull for you :)
enjoy! 🚀🚀🚀

Tick based chart [DotH]Version 1.0 - 2nd January 2023
Hi All,
This is my first published indicator, although I have written several hundreds for private use.
Description
Tick based chart
I got intrigued while reading about tick based charts on this page (please note this link/website owner is not affiliated with me) , so I decided to see if it would be possible to recreate this type of chart in TradingView, and here's the results.
This is an implementation for displaying a tick based chart in Trading View. There are benefits to using ticks based candles, as each candle represents the same number of "price moves" rather than an unknown number of moves.
Tick based charts are charts with candles that are rendered in the same way as traditional candles. However, instead of rendering a new candle at a specific time period,tick based candles are rendered after a set number of ticks have occured. For example, in a 50 tick chart, each candle that you see represents exactly 50 ticks, i.e. 50 price changes/moves. Having a view of what happens on the tick level, may help some traders evaluate what is happening within very large candles, or even detect a change in trend, volatility or some other metric which otherwise may not be visible using a standard chart.
Please note that this indicator DOES NOT match/synchronize timewise with the main chart in TradingView. You must view it independently. If you need to see what times are represented in the tick chart, you can look at the custom time labels and X-Axis grid lines in it to get an idea what parts of the tick based chart correspond to the main chart.
Limitations/known issues:
Currently the indicator has been restricted to 100 candles. This is for limiting the line and box usage to a max of 300 objects.
On timeframes above 1 minute, the seconds values will always be 0. In order to be able to see seconds values in the chart scale you need to be on a second level chart, which requires a premium TradingView subscription.
Changing the parameters in the settings will cause the chart to empty and start redrawing from its first candle again. This is because the tick chart is being drawn from realtime data, unlike the standard TradingView charts.
TODOs & Bugs:
Add some moving average indicators (SMA, EMA as a minimum)
Add a corresponding tick based volume chart
Create RSI, MACD, BB variations of this indicator
If you have any ideas/suggestions or bug reports, please feel free to let me know, however keep in mind that I do not have too much spare time to add things, so updates are going to be sporadic.
ABOUT CODE REUSE:
The code is free to use/change. However, if you plan to use this code to make a derivative indicator or strategy, it would be nice to know, so let me know if you feel like it!

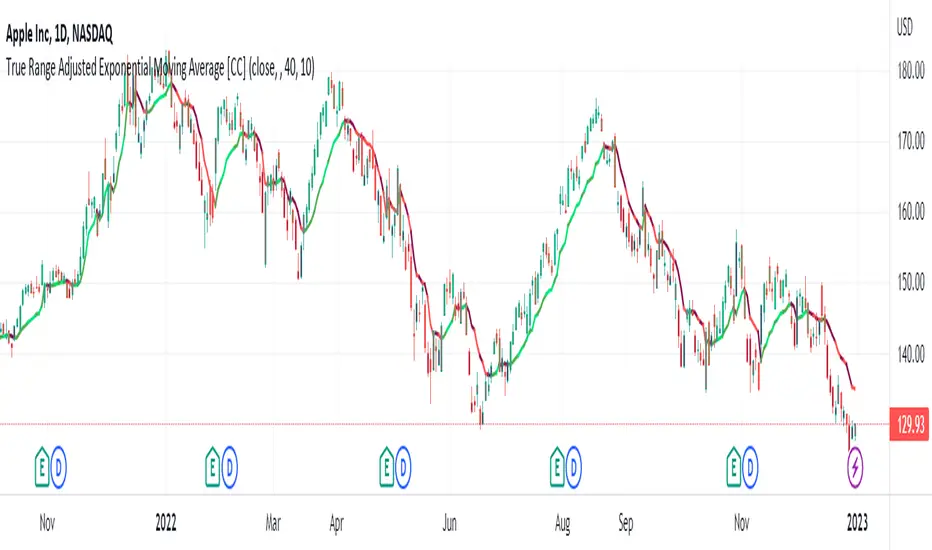
True Range Adjusted Exponential Moving Average [CC]The True Range Adjusted Exponential Moving Average was created by Vitali Apirine (Stocks and Commodities Jan 2023 pgs 22-27) and this is the latest indicator in his EMA variation series. He has been tweaking the traditional EMA formula using various methods and this indicator of course uses the True Range indicator. The way that this indicator works is that it uses a stochastic of the True Range vs its highest and lowest values over a fixed length to create a multiple which increases as the True Range rises to its highest level and decreases as the True Range falls. This in turn will adjust the Ema to rise or fall depending on the underlying True Range. As with all of my indicators, I have color coded it to turn green when it detects a buy signal or turn red when it detects a sell signal. Darker colors mean it is a very strong signal and let me know if you find any settings that work well overall vs the default settings.
Let me know if you would like me to publish any other scripts that you recommend!
Wolfe Strategy [Trendoscope]Hello Everyone,
Wish you all Merry X-Mas and happy new year. Lets start 2023 with fresh new strategy built on Wolfe Indicator. Details of the indicator can be found here
🎲 Wolfe Concept
Wolfe concept is simple. Whenever a wedge is formed, draw a line joining pivot 1 and 4 as shown in the chart below:
For simplicity, we will only consider static value for Target and Stop. But, entry is done based on breaking the triangle. Revised strategy looks something like this:
🎲 Settings
Settings are simple and details of each are provided via tooltips.
Out of these, the most important one is minimum risk reward ratio. If you set lower risk reward threshold then losing few trades may generate more losses than more winning trades. Similarly higher value will filter out most of the trades and may not work efficiently. Default value set to 1 to make sure optimal risk reward is present before placing trade. Also make note that since the entry bar is always moving towards stop, as and when pattern progress, the RR will also increase. Hence, a pattern which is below RR threshold may become good to trade at certain point of time in future.
🎲 Strategy Parameters
Default strategy parameters are initialised via definition. Margins are set to 100 to disable leveraged trades. Appropriate values are chosen for other parameters. These can be altered based on individual strategy and trading plan.
As the strategy concentrates on the single pattern, number of trades generated are comparatively less. But, there is chance to increase the algorithm further to catch more such patterns on larger scale. Will try to work on them in next versions.
🎲 Pine Strategy limitations
Backtest can only be done on one direction as pine strategy cannot have both long and short open trades together. Hence, it is mandatory to chose either long/short trades in settings.
Since pyramiding is limited to 1, there is possibility of a pattern not generating trade even though the entry conditions are met. They are just based on pine limitations and not necessarily mean patterns are not good for placing trades.
