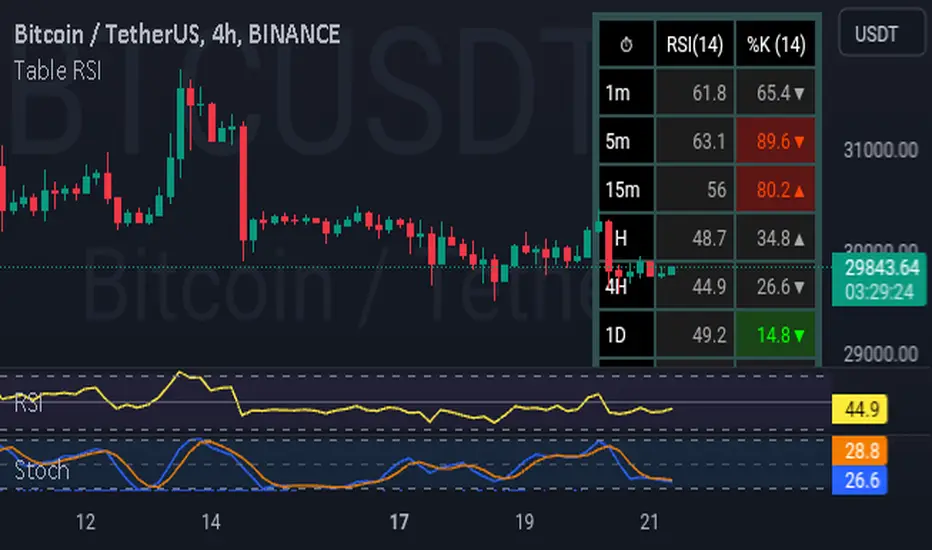
Table rsi multiframes(by Lc_M)- Simultaneous display of RSI values on cells corresponding to each selected timeframe, organized in an intuitive table, adjustable in size and position.
- Color indicator on each cell that presents RSI values within the overbought and oversold levels. example: if the user wants to set the O.S/O.B levels to 20 - 80, the colored cells will only appear at "RSI" => 80 and "RSI" <= 20.
- Free configuration of graphic times, lengths and O.B/O.S, according to user standards
Cari dalam skrip untuk "股价在8元左右净利润为正市值小于80亿的热门股票有哪些"
Stochastic Vix Fix SVIX (Tartigradia)The Stochastic Vix or Stochastic VixFix (SVIX), just like the Williams VixFix, is a realized volatility indicator, and can help in finding market bottoms as well as tops without requiring bollinger bands or any other construct, as the SVIX is bounded between 0-100 which allows for an objective thresholding regardless of the past.
Mathematically, SVIX is the complement of the original Stochastic Oscillator, with such a simple transform reproducing Williams' VixFix and the VIX index signals of high volatility and hence of market bottoms quite accurately but within a bounded 0-100 range. Having a predefined range allows to find markets bottoms without needing to compare to past prices using a bollinger band (Chris Moody on TradingView) nor a moving average (Hesta 2015), as a simple threshold condition (by default above 80) is sufficient to reliably signal interesting entry points at bottoming prices.
Having a predefined range allows to find markets bottoms without needing to compare to past prices using a bollinger band (Chris Moody on TradingView) nor a moving average (Hesta 2015), as a simple threshold condition (by default above 80) is sufficient to reliably signal interesting entry points at bottoming prices.
Indeed, as Williams describes in his paper, markets tend to find the lowest prices during times of highest volatility, which usually accompany times of highest fear.
Although the VixFix originally only indicates market bottoms, the Stochastic VixFix can also indicate good times to exit, when SVIX is at a low value (default: below 20), but just like the original VixFix and VIX index, exit signals are as usual much less reliable than long entries signals, because: 1) mature markets such as SP500 tend to increase over the long term, 2) when market fall, retail traders panic and hence volatility skyrockets and bottom is more reliably signalled, but at market tops, no one is panicking, price action only loses momentum because of liquidity drying up.
Compared to Hesta 2015 strategy of using a moving average over Williams' VixFix to generate entry signals, SVIX generates much fewer false positives during ranging markets, which drastically reduce Hesta 2015 strategy profitability as this incurs quite a lot of losses.
This indicator goes further than the original SVIX, by restoring the smoothed D and second-level smoothed D2 oscillators from the original Stochastic Oscillator, and use a 14-period ZLMA instead of the original 20-period SMA, to generate smoother yet responsive signals compared to using just the raw SVIX (by default, this is disabled, as the original raw SVIX is used to produce more entry signals).
Usage:
Set the timescale to daily or weekly preferably, to reduce false positives.
When the background is highlighted in green or when the highlight disappears, it is usually a good time to enter a long position.
Red background highlighting can be enabled to signal good exit zones, but these generate a lot of false positives.
To further reduce false positives, the SVIX_MA can be used to generate signals instead of the raw SVIX.
For more information on Williams' Vix Fix, which is a strategy published under public domain:
The VIX Fix, Larry Williams, Active Trader magazine, December 2007, web.archive.org
Fixing the VIX: An Indicator to Beat Fear, Amber Hestla-Barnhart, Journal of Technical Analysis, March 13, 2015, ssrn.com
For more information on the Stochastic Vix Fix (SVIX), published under Creative Commons:
Replicating the CBOE VIX using a synthetic volatility index trading algorithm, Dayne Cary and Gary van Vuuren, Cogent Economics & Finance, Volume 7, 2019, Issue 1, doi.org
Note: strangely, in the paper, the authors failed to mention that the SVIX is the complement of the original Stochastic Oscillator, instead reproducing just the original equation. The correct equation for the SVIX was retroengineered by comparing charts they published in the paper with charts generated by this pinescript indicator.
For a more complete indicator, see:

MTF Fantastic Stochastic (FS+)MTF Fantastic Stochastic (FS+) + Alerts
This chart overlay indicator can signal multiple triple-timeframe Stochastic RSI overbought and oversold confluences directly onto your chart, intended for use as a confluence either for reversal trade entries, or potential trade exits, indicating where price may be probable to reverse.
Features include:
- Primary set of fully configurable triple-timeframe overbought and oversold signals, indicating where 3 selected timeframes are all overbought or all oversold at the same time. Enabled by default.
- Secondary set of fully configurable triple-timeframe overbought and oversold signals, indicating where 3 selected timeframes are all overbought or all oversold at the same time, with alert option. Enabled by default.
- Also includes standard configurable Stoch RSI options, including k length, d length, RSI length, Stochastic length, etc.
- The default primary MTF #1 timeframes are set to 1minute, 5minute and 15minute. These are highly suitable for low timeframe scalpers trading on charts less than 5 minutes, and can often pin point price reversals.
- The default Secondary MTF #2 timeframes are set to 15minute, 30minute and 60minute. These are suitable for both low timeframe scalpers and considerably higher timeframe traders.
- Optional drawing of background colours and/or ribbon seen at bottom of the chart.
- Fully configurable timeframes, as well as overbought and oversold threshold levels for each individual timeframe. Overbought and oversold thresholds are set to the factory 80 and 20 levels respectively for all timeframes by default.
- Alert features for both MTF #1 and MTF #2 triple-timeframe confluences, including options for alerting overbought and oversold individually, as well as an option for alerting either overbought or oversold in a single alert.
Note: THe features listed above are accurate at the time of publishing but maybe updated or added to in future.
The Stochastic RSI
The popular oscillator has been described as follows:
“The Stochastic RSI is an indicator used in technical analysis that ranges between zero and one (or zero and 100 on some charting platforms) and is created by applying the Stochastic oscillator formula to a set of relative strength index ( RSI ) values rather than to standard price data. Using RSI values within the Stochastic formula gives traders an idea of whether the current RSI value is overbought or oversold. The Stochastic RSI oscillator was developed to take advantage of both momentum indicators in order to create a more sensitive indicator that is attuned to a specific security's historical performance rather than a generalized analysis of price change.”
How do traders use overbought and oversold levels in their trading?
The oversold level, that is when the Stochastic RSI is above the 80 level is typically interpreted as being 'overbought', and below the 20 level is typically considered 'oversold'. Traders will often use the Stochastic RSI at an overbought level as a confluence for entry into a short position, and the Stochastic RSI at an oversold level as a confluence for an entry into a long position. These levels do not mean that price will necessarily reverse at those levels in a reliable way, however. This is why this version of the Stoch RSI employs the triple timeframe overbought and oversold confluence, in an attempt to add a more confluence and reliability to this usage of the Stoch RSI.
This indicator was originally built as one of a many features included in the RF+ Divergence Scalping System and has been separated into it's own standalone indicator here for traders who do not want the many other features bundled into the original indicator. A number of features that exist in the original were intensive, and also quite niche. Therefore this lightweight single purpose chart overlay indicator offers this versatile feature of the ever popular Stochastic RSI to a wider audience of traders who may add it to various strategies.

KDJ [JoseMetal]============
ENGLISH
============
- Description:
This indicator is a modification of the common KDJ, as you may know the KDJ is just a Stochastic (K+D) with an extra line which is J, the J line can be used as "movement strength" filter and also for overbought and oversold conditions anticipating the K and D.
In this particular modification I've tested many different settings to find the best possible ones, it also has customizable MA type for the calculation and a histogram calculated with the difference between J and D, this is useful to spot divergences and determine trend strength easily, the histogram has a smooth option to make it even more clearer.
- Visual:
So you have K and D from the Stochastic (green and red lines) as well as the J line (white).
Then you have the histogram to show the difference between J and D, the histogram has a similar color scale as a MACD to determine the strength of the trend easily, lighter = stronger, darker = weaker, there are 2 default customizable color setups by the way.
Crossovers between lines (which generates LONG and SHORT entries) are presented with a DOT (green for long and red for short).
Background color also changes, green for bullish, red for bearish, crossovers also marks the background color even more.
- Customization:
As usual in my indicators, everything is customizable, you can pick yours, settings, colors, figures etc.
- Usage and recommendations:
I've tested many different setting setups, for now, the best are the default (14, 21, 21) for the KDJ and (7) for the histogram smooth, 20 and 80 for oversold and overbought levels.
Histogram is great to spot divergences, I recommend to wait for a divergence on a 4H timeframe and wait for the LONG or SHORT signal to appear to enter a trade in the divergence direction.
Enjoy!
============
ESPAÑOL
============
- Descripción:
Éste indicador es una modificación del KDJ común, como sabrás el KDJ es solo un estocástico (K+D) con una línea extra que es la J, la línea J puede ser usada como filtro de "fuerza de movimiento" y también para condiciones de sobrecompra y sobreventa anticipando la K y la D.
En esta modificación en particular he probado muchas configuraciones diferentes para encontrar las mejores posibles, también tiene un tipo de MA personalizable para el cálculo y un histograma calculado con la diferencia entre J y D, esto es útil para detectar divergencias y determinar la fuerza de la tendencia fácilmente, el histograma tiene una opción suave para hacerlo aún más claro.
- Visual:
Por lo tanto, tenemos por un lado la K y D del estocástico (líneas verde y roja), así como la línea J (blanco).
Luego tenemos el histograma para mostrar la diferencia entre J y D, el histograma tiene una escala de colores similar a la del MACD para determinar la fuerza de la tendencia fácilmente, más claro = más fuerte, más oscuro = más débil, hay 2 escalas de color personalizables por defecto.
Los cruces entre líneas (que generan entradas LARGAS y CORTAS) se presentan con un PUNTO (verde para LARGO y rojo para CORTO).
El color de fondo también cambia, verde para alcista, rojo para bajista, los cruces también resaltan el color de fondo aún más.
- Personalización:
Como es habitual en mis indicadores, todo es personalizable, puedes elegir los tuyos, ajustes, colores, figuras, etc.
- Uso y recomendaciones:
He probado muchas configuraciones diferentes, por ahora, las mejores son las predeterminadas (14, 21, 21) para el KDJ y (7) para el histograma suave, 20 y 80 para los niveles de sobreventa y sobrecompra.
El histograma es excelente para detectar divergencias, recomiendo esperar una divergencia en un marco de tiempo de 4H y esperar a que aparezca la señal de LARGO o CORTO para entrar en una operación en la dirección de la divergencia.
¡Que lo disfrutéis!

Stoch/RSI with EMA50 Cross & HHLLA hybrid but simple indicator that plots 4 strategies in one pane .
1) RSI Indicator
2) Stoch RSI
3) EMA50 Cross (To determine direction in current timeframe)
4) Higher Highs & Lower Lows to analyze the trend and break of trend
The relative strength index (RSI) is a momentum indicator used in technical analysis. It is displayed as an oscillator (a line graph) on a scale of zero to 100. When the RSI indicator crosses 30 on the RSI chart, it is a bullish sign and when it crosses 70, it is a bearish sign.
The Stochastic RSI (StochRSI) is also a momentum indicator used in technical analysis. It is displayed as an oscillator (a line graph) on a scale of zero to 100. When the StochRSI indicator crosses 20 on the RSI chart, it is a bullish sign and when it crosses 80, it is a bearish sign.
The EMA50Cross denotes two cases in the script:
a) A crossover of CMP on the EMA50 is highlighted by a green bar signals a possible bullish trend
b) A crossunder of CMP on the EMA50 is highlighted by a red bar signals a possible bearish trend
The HHLL is denoted by mneumonics HH, HL,LH, LL. A combination of HHs and HLs denotes a uptrend while the combination of LLs and LHs denoted a downtrend
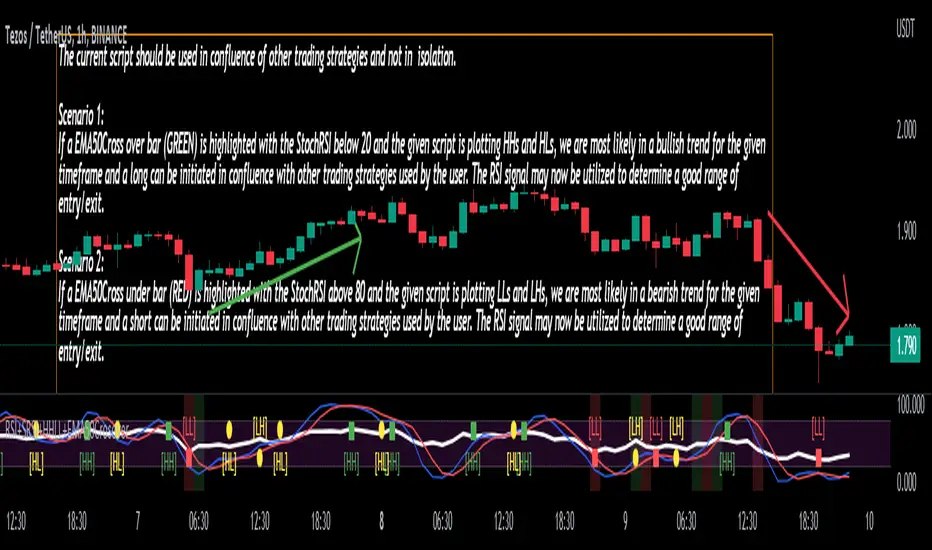
The current script should be used in confluence of other trading strategies and not in isolation.
Scenario 1:
If a EMA50Cross over bar (GREEN) is highlighted with the StochRSI below 20 and the given script is plotting HHs and HLs, we are most likely in a bullish trend for the given timeframe and a long can be initiated in confluence with other trading strategies used by the user. The RSI signal may now be utilized to determine a good range of entry/exit.
Scenario 2:
If a EMA50Cross under bar (RED) is highlighted with the StochRSI above 80 and the given script is plotting LLs and LHs, we are most likely in a bearish trend for the given timeframe and a short can be initiated in confluence with other trading strategies used by the user. The RSI signal may now be utilized to determine a good range of entry/exit.
Disclaimer:
The current script should be used in confluence with other trading strategies and not in isolation. The scripts works best on 4H and 1D Timeframes and should be used with caution on lower timeframes.
This indicator is not intended to give exact entry or exit points for a trade but to provide a general idea of the trend & determine a good range for entering or exiting the trade. Please DYOR
Credit & References:
This script uses the default technical analysis reference library provided by PineScript (denoted as ta)
All TimeFrame OscillatorsI have always fighted to understand the market direction because it looks different on different timeframes.
I wanted an indicator where I can see all the different timeframes at once.
This indicator shows already existing oscillators but not only in the current chart's timeframe, but all the most important higer timeframes at once.
I have started with the stoch, then added as many oscillators as I could.
Experimenting with this I have saw that confluence of 4H 1D and 1W Stoch can be very interesting and can highlight higher timeframe take profit areas and sometimes major tops/bottoms.
Also bounces can be interesting when a lower timeframe stoch is bounced or rejected from a higher one.
Oscillators:
Stoch - Stochastic Oscillator
SMI - Stochastic Momentum Index
Rsi - Relative Strength Index
StochRsi - Stochastic RSI
WaveTrend - Vumanchu alias Market Cypher Wave Trend line
CCI - Commodity Channel Index
CCIStoch - Stochastic CCI
Williams Percent Range - Williams %R
Norm. MACD - Normalized Moving Average Convergence Divergence
Norm. MACD Hist - Normalized MACD Histogramm
PVT - Normalized Price Volume Trend
MFI - Money Flow Index
CMF - Chaikin Money Flow
Chande Momentum - Chande Momentum
Volume - Normalized Volume
CandleValue - Vumanchu alias Market Cypher MoneyFlow
BBWP - Bollinger Band Width Percentile
Line Type
Smooth: lines are smoothed, but the actualy not closed values are not shown
Step: Step lines, the actually open timeframes are calculated as they closed at the current values
Plot Oscillator or it's Slope:
its possible to not plot the oscillator but it's slope
Print dots when:
Cross Up/Down oversold/overbougt level - best for most oscillators. for example when Stoch crosses above 20 or below 80
Cross os/ob and the one higher TF is about to cross - when it's crosses beolw 80 and the higher timeframe oscillator is still above ans sloping down
Cross above/below middle line - for example on RSI being above or below 50 can be interesting
Print triangles when:
All Slope Match - all visible timeframe lines are pointing up or down at the same time
All above/belove middle line - all visible lines are above or belove the middle line
All above/belove middle line and slope match - like the previous one and the slope direction is the same
All above/below oversold/overbougt - all lines are above or below os/ ob. this is the default. it can be a very important confluence
Lower TF in order - 5, 15, 30, 60 minute timeframes are in order.
Higher TF in order - 4H 1D 1W in order (like 4H above 1D abd 1D above 1W). can be interesting at RSI
4H-1D in order - 4H 1D in order .
Print triangles
Print all triangles - print all triangles when the condition is met
Print only first triangles - only show when the condition starts to met
Print only last triangles - small triangles when the condition met first, large when last. tis is the default.
Timeframes to show:
You can turn on/off different timeframs to show or not from the list below:
1m 5m 15m 30m 1H 4H D 5D W M
This is for experimenting/ understanding the market direction on multiple timeframes at once.
Don't take it's signals (and any other indicator's) as exact trade signals. use it as confirmation instead.
Any comments, insights, ideas are welcome.

RSI Trend Heatmap in Multi TimeframesRSI Trend Heatmap in Multi Timeframes
Description
Sometimes you want to look at the RSI Trend across multiple time frames.
You have to waste time browsing through them.
So we've put together every time frame you want to see in one indicator.
We have 10 layers of RSI Trend heatmap available for you.
You can set the timeframe as you want on the Settings page.
Description of Parameter RSI Setting ** You can change it by setting.
RSI Trend Length : (Default 50)
Source : (Default close)
RSI Sideways Length : (Default 2 = RSI between 48 .. 52)
Description of Parameter RSI Timeframe ** You can change it by setting.
""=None,
"M"=1Month, "2W"=2Weeks, "W"=1Week,
"3D"=3Days, "2D"=2Days, "D"=1Day,
"720"=12Hours, "480"=4Hours, "240"=4Hours, "180"=3Hours, "120"=2Hours,
"60"=60Minutes, "30"=30Minutes, "15"=15Minutes, "5"=5Minutes, "1"=1Minute
Default Configurate of RSI Timeframe (for a time frame of 1 hour to 1 day)
"W"= Timeframe 1 month shown in line 90-100 --> Represent Long Trend of RSI
---------------------------------------
"D2"= Timeframe 2 days shown in line 70-80 --> Represent Trend of RSI
"D"= Timeframe 1 day shown in line 60-70 --> Represent Trend of RSI
---------------------------------------
"240"= Timeframe 3 hours shown in line 40-50 --> Represent Signal Up/Signal Down/Divergence of RSI
"120"= Timeframe 2 hours shown in line 30-40 --> Represent Signal Up/Signal Down/Divergence of RSI
"60"= Timeframe 1 hour shown in line 20-30 --> Represent Signal Up/Signal Down/Divergence of RSI
"30"= Timeframe 30 minutes shown in line 10-20 --> Represent Signal Up/Signal Down/Divergence of RSI
"15"= Timeframe 15 minutes shown in line 00-10 --> Represent Signal Up/Signal Down/Divergence of RSI
Description of Colors
Dark Bule = Extreme Uptrend / Overbought / Bull Market (RSI > 67)
Light Bule = Uptrend (RSI between 50-52 .. 67)
Yellow = Sideways Trend / Trend Reversal (RSI between 48 .. 52) ** You can change it by setting.
Light Red = Downtrend (RSI between 33 .. 48-50)
Dark Red = Extreme Downtrend / Oversold / Bear Market (RSI < 33)
How to use
1. You must first know what the main trend of the RSI is (look at the 60-80 line). If it is red, it is a downtrend. and if it's blue shows that it is an uptrend
2. Throughout the period of the main trend There will always be a reversal of the sub-trend. (Can see from the 0-50 line), but eventually will return to follow the main trend.
3. Unless the sub trend persists for a long time until the main trend changes.

Stochastic ATR Volatility OscillatorNOTES: As x, k and d use;
21-10-3 for 1 Hour candles
5-4-2 for 4 Hour candles
21-21-3 for 1 Day candles
Yellow plot is the main oscillator. Orange plot, and hlines at 20, 50 and 80 can be used as signal lines.
I personally use hlines as the signal in 1H as it's the best timeframe for the indicator.
If you are in a long position, sell when yellow plot crosses 80 or 50 line downwards;
and buy when the line crosses 20, 50 or 75 upwards while you are not in a trade.

USFuturesInvestments Moving Averages - Exponencia and SimpleThis indicator contains the main exponential moving averages (9, 21 and 80) and the simple moving averages (200, 305 and 610), which I use in my operational.
It was developed by my friend Giovani, who is a 10 note guy!
I hope he can help you on your journey to becoming a Professional Trader.
You can modify it the way you prefer, it is very simple.
Neste indicador estão reunidas as principais médias móveis exponenciais (9, 21 e 80) e as médias móveis simples (200, 305 e 610), que uso em meu operacional.
Ele foi desenvolvido por meu amigo Giovani, que é um cara nota 10!
Espero que ele possa ajudar a você na jornada para se tornar um Trader Profissional.
Você pode modifica-la do jeito que preferir, é muito simples.

Triple ThreatThis indicator provides buy and sell signals for Bitcoin based on confluence from well-known momentum, volatility, and trend indicators. It has successfully captured the major directional trends on Bitcoin's daily chart since 2018, and the settings are currently optimized for this chart in particular. This indicator implements RSI to gauge momentum, BBWP to gauge volatility, and an EMA to gauge trend. Maximum confluence signals are represented by horizontal bars in the indicator's pane, where the tallest green bar is a confirmed buy signal, and the tallest red bar is a confirmed sell signal. The shortest bar represents a momentum-only signal, and the second-shortest bar represents a volatility signal in confluence with the previously given momentum signal.
To track momentum, the RSI is plotted to the indicator plane against a moving average of the RSI. A momentum signal is generated when the RSI crosses over its moving average, retests/approaches the moving average, and then continues in the crossover direction (i.e., it fails to cross the moving average to the opposite side, creating a successful retest). The settings that affect this trigger are the "Crossover Threshold," which specifies how much the RSI should exceed the moving average to be considered a crossover, and the "Retest threshold," which specifies how closely the RSI should approach the moving average to be considered a retest. A momentum signal is ALSO generated if the RSI or its moving average exceed their counterpart by a certain threshold. For example, if the threshold was set at 10, a BUY signal would be generated when the RSI exceeds the moving average by 10, or a SELL signal would be generated when the moving average exceeds the RSI by 10. This threshold can be set using the "Instant Signal Threshold" setting. Either type of momentum signal will be plotted on the pane as the shortest horizontal bar, with its color indicating the signal's direction.
Volatility is primarily measured using the Bollinger Band Width Percentile (BBWP) indicator, which was created by The_Caretaker. BBWP plots the volatility of the asset's price, given by Bollinger Band width, relative to past volatility by assigning the volatility readings into percentiles. The indicator also includes a moving average of the BBWP itself, where a crossover to the upside represents expanding volatility and a crossover to the downside represents contracting volatility. This indicator is used to confirm a signal given by the momentum indicators - a momentum signal that is given during a period of expanding volatility has a greater likelihood of success. Therefore, when the BBWP crosses above its moving average by a given threshold, a previously triggered momentum signal is considered to be "confirmed." The threshold for this crossover can be set using the "BBWP Confirmation Threshold" setting. However, it is also relevant that periods of extreme volatility often accompany an extremity in price action (a "top" or "bottom"), in which case the BBWP is likely to contract after price reaches such an extremity. This phenomenon is captured by also using "extreme reads" on the momentum indicator to signal that there has already been enough volatility to confirm a momentum signal. If the RSI gives an "extreme read" before triggering a signal, the momentum signal is also considered to be confirmed. For example, if the RSI is above 80, breaks below 80, and then gives a SELL signal, this sell signal is considered to be confirmed without requiring the BBWP to crossover its moving average to the upside. The threshold that would confirm a SELL signal can be set with the "Overbought" setting, and the threshold that would confirm a BUY signal can be set with the "Oversold" setting. Whenever a volatility signal confirms a momentum signal, a medium-sized horizontal bar will be plotted on the pane in the same directional color as the momentum signal. Note that a momentum signal may trigger at the exact same time as the volatility signal which confirms it; in this case, only the medium-sized bar will be visible on the pane, but its direction can still be identified by its color.
Lastly, to reduce the likelihood of "false signals," a trend indicator is used to confirm the direction of the signal. This is typically an exponential moving average. If a confirmed volatility SELL signal is given, and the closing price is below the moving average, then the SELL signal is also confirmed by the trend. Likewise, if a confirmed volatility BUY signal is given, and the closing price is above the moving average, then the BUY signal is confirmed by the trend. The type and length of the moving average used to verify the trend can be set using the "Moving Average Type" and "Moving Average Length" settings found below the momentum/volatility settings. A trend signal is plotted on the pane as a tall horizontal bar, and is more deeply colored than the momentum and volatility signals.
For maximum confluence, it is recommended that the trend signal, given by the tallest bar, is the one that forms the basis of trades executed while using the Triple Threat indicator. It is possible to enter more aggressive trades with better entries by using only the volatility signal, given by the medium-sized bar, however this entails greater risk and should only be done in confluence with an additional trading strategy of your own discretion. Backtesting has shown that using the volatility signal alone underperforms using the volatility signal in confluence with the trend signal.
Please also be advised that the default setting are optimized for Bitcoin's daily chart only. The indicator is still applicable to other timeframes and asset classes, but the settings may need to be modified. I have a list of settings for other Bitcoin timeframes, and I would be happy to share them upon request.
I hope you can find this indicator to be of some use to your trading strategies. I'd be happy to hear any feedback from the community, so please don't hesitate to reach out. Stay safe, and happy trading.

Trend-Quality IndicatorBINANCE:BTCUSDT
Open source version of the Trend-Quality Indicator as described by David Sepiashvili in [ Stocks & Commodities V. 22:4 (14-20) ]
Q-Indicator and B-Indicator are available both separately or together
█ OVERVIEW
The Trend-Quality indicator is a trend detection and estimation tool that is based on a two-step filtering technique. It measures cumulative price changes over term-oriented semicycles and relates them to “noise”. The approach reveals congestion and trending periods of the price movement and focuses on the most important trends, evaluating their strength in the process. The indicator is presented in a centered oscillator (Q-Indicator) and banded oscillator format (B-Indicator).
Semicycles are determined by using a short term and a longer term EMAs. The starting points for the cycles are determined by the moving averages crossover.
Cumulative price change (CPC) indicator measures the amount that the price has changed from a fixed starting point within a given semicycle. The CPC indicator is calculated as a cumulative sum of differences between the current and previous prices over the period from the fixed starting point.
The trend within the given semicycle can be found by calculating the moving average of the cumulative price change.
The noise can be defined as the average deviation of the cumulative price change from the trend. To determine linear noise, we calculate the absolute value of the difference between CPC and trend, and then smooth it over the n-point period. The root mean square noise, similar to the conventional standard deviation, can be derived by summing the squares of the difference between CPC and trend over each of the preceding n-point periods, dividing the sum by n, and calculating the square root of the result.
█ Q-INDICATOR
The Q-Indicator is a centered oscillator that fluctuates around a zero line with no upper or lower limits, is calculated by dividing trend by noise.
The Q-Indicator is intended to measure trend activity. The further the Q is from 0, the less the risk of trading with a trend, and the more reliable the trading opportunity. Values exceeding +2 or -2 can be qualified as promising
Values:
in the -1 to +1 range (GRAY) indicate that the trend is buried beneath noise. It is preferable to stay out of this zone
in the +1 to +2 or -1 to -2 range (YELLOW) indicate weak trending
in the +2 to +5 range (BLUE) or -2 to -5 range (ORANGE) indicate moderate trending
above +5 range (GREEN) or below -5 (RED) indicate strong trending
Readings exceeding strong trending levels can indicate overbought or oversold conditions and signal that price action should be monitored closely.
█ B-INDICATOR
The B-Indicator is a banded oscillator that fluctuates between 0 and 100, is calculated by dividing the absolute value of trend by noise added to absolute value of trend, and scaling the result appropriately.
The B-indicator doesn’t show the direction of price movement, but only the existence of the trend and its strength. It requires additional tools for reversal manifestations.
The indicator’s interpretation is simple. The central line suggests that the trend and noise are in equilibrium (trend is equal to noise).
Values:
below 50 (GRAY) indicate ranging market
in the 50 to 65 range (YELLOW) indicate weak trending
in the 65 to 80 range (BLUE) indicate moderate trending
above 80 (GREEN) indicate strong trending
The 65 level can be thought of as the demarcation line of trending and ranging markets and can help determine which type of technical analysis indicator (lagging or leading) is better suited to current market conditions. Readings exceeding strong trending levels can indicate overbought or oversold conditions.

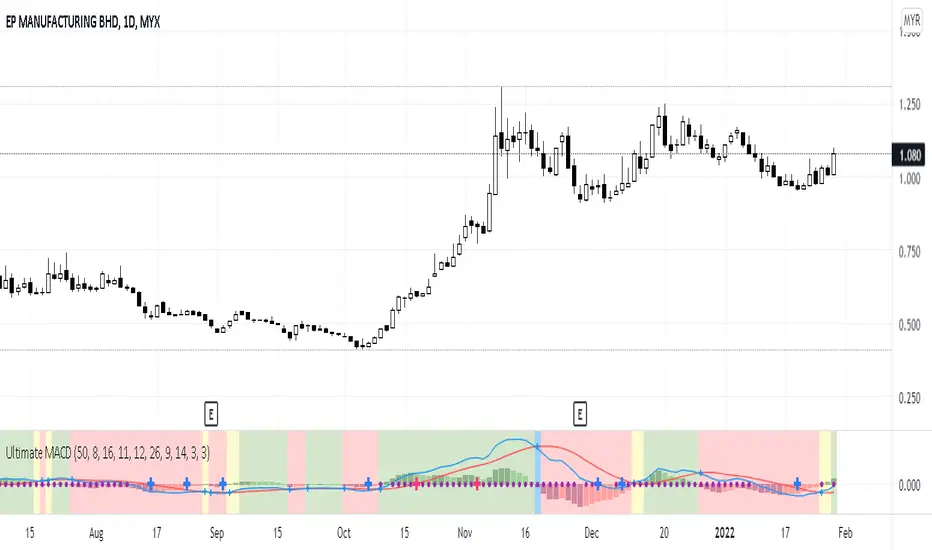
Ultimate MACDThis indicator is an improved version of MACD+RSI (refer to my script list). Basically, this indicator is a combination of several indicators:
1. Fast MACD (preset at 8, 16, 11 - it is my own preference settings and the red and blue line in this indicator are referring to the Fast MACD settings)
2. Slow MACD (preset at 12, 26, 9 - standard settings and the Slow MACD lines are not displayed in this indicator)
3. RSI (preset over value 50)
4. Stochastic (preset overbought at 80, oversold at 20)
How to read:
1. Fast and Slow MACD:
- Two red and blue lines are displaying the Fast MACD lines
- Small blue cross will appear at every crossover of the Fast MACD lines
- Golden Cross 1: Yellow background will appear if only Fast MACD lines are crossing to each other (blue crossover red)
- Golden Cross 2: Green background will appear if both Fast and Slow MACD lines are crossing to each other (blue crossover red but for Slow MACD, I didn't put those lines in this indicator)
- Death Cross 1: Blue background will appear if only Fast MACD lines are crossing to each other (red crossover blue)
- Death Cross 2: Red background will appear if both Fast and Slow MACD lines are crossing to each other (red crossover blue)
2. RSI:
- Purple dots will appear on the center line if RSI value is over 50
3. Stochastic:
- Big Blue cross will appear on the center line if stochastic line are crossing to each other in the oversold area (preset at 20)
- Big Red cross will appear on the center line if stochastic line are crossing to each other in the overbought area (preset at 80)
That's all about this indicator, you can use it based on your own trading style if it suits you. And again I let the script open for anyone to modify it based on your own preferences.
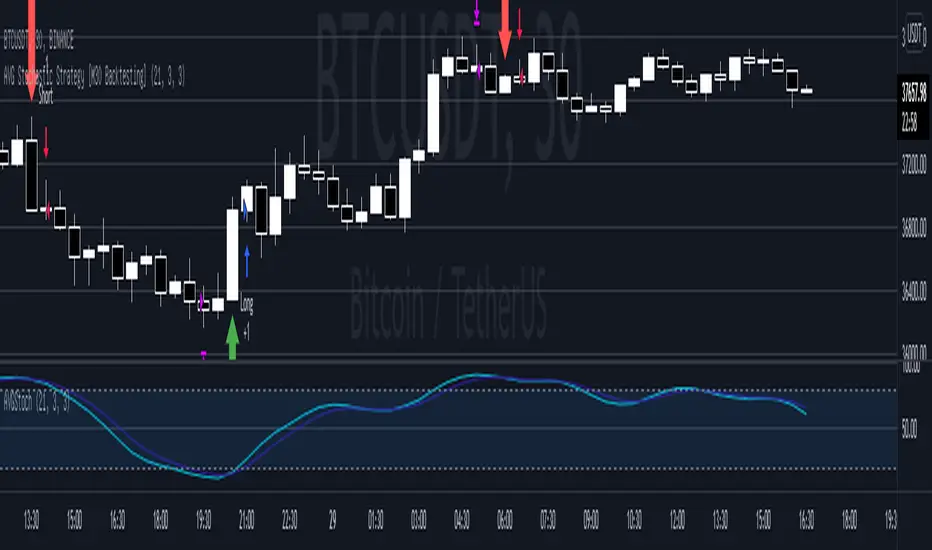
AVG Stochastic Strategy [M30 Backtesting]1. AVG Stochastic Calculate
1.1 AVG %K is calculated by apply EMA with smooth K period on Average of Original Stochastic %k & %d
+ avg_k=ema((%k+%d)/2,smoothK)
1.2 AVG %D is calculated by apply EMA with %d period on AVG %K
+ avg_d=ema(avg_k,periodD)
2. Parameter
+ %K Length: 21
+ %K Smoothing: 3
+ %D Smoothing: 3
+ Symbol: BTC/USDT
+ Timeframe: M30
+ Pyramiding: Maximum 3 orders at the same direction.
3. Signal
3.1 Buy Signal
+ Entry: AVG %K crossover AVG %D and AVG %D < 20
+ Exit: AVG %D > 80
3.2 Sell Signal
+ Entry: AVG %K crossunder AVG %D and AVG %D > 80
+ Exit: AVG %D < 20
Logger Library For Pinescript (Logging and Debugging)Library "LoggerLib"
This is a logging library for Pinescript. It is aimed to help developers testing and debugging scripts with a simple to use logger function.
Pinescript lacks a native logging implementation. This library would be helpful to mitigate this insufficiency.
This library uses table to print outputs into its view. It is simple, customizable and robust.
You can start using it's .log() method just like any other logging method in other languages.
//////////////////
USAGE
//////////////////
-- Recommended: Please Read The Documentation From Source Code Below. It Is Much More Readable There And Will Be Updated Along With Newer Versions. --
Importing the Library
---------------------
import paragjyoti2012/LoggerLib/ as Logger
.init() : Initializes the library and returns the logger pointer. (Later will be used as a function parameter)
.initTable: Initializes the Table View for the Logger and returns the table id. (Later will be used as a function parameter)
parameters:
logger: The logger pointer got from .init()
max_rows_count: Number of Rows to display in the Logger Table (default is 10)
offset: The offset value for the rows (Used for scrolling the view)
position: Position of the Table View
Values could be:
left
right
top-right
(default is left)
size: Font Size of content
Values could be:
small
normal
large
(default is small)
hide_date: Whether to hide the Date/Time column in the Logger (default is false)
returns: Table
example usage of .initTable()
import paragjyoti2012/LoggerLib/1 as Logger
var logger=Logger.init()
var logTable=Logger.initTable(logger, max_rows_count=20, offset=0, position="top-right")
-------------------
LOGGING
-------------------
.log() : Logging Method
params: (string message, |string| logger, table table_id, string type="message")
logger: pass the logger pointer from .init()
table_id: pass the table pointer from .initTable()
message: The message to log
type: Type of the log message
Values could be:
message
warning
error
info
success
(default is message)
returns: void
///////////////////////////////////////
Full Boilerplate For Using In Indicator
///////////////////////////////////////
P.S: Change the | (pipe) character into square brackets while using in script (or copy it from the source code instead)
offset=input.int(0,"Offset",minval=0)
size=input.string("small","Font Size",options=|"normal","small","large"|)
rows=input.int(15,"No Of Rows")
position=input.string("left","Position",options=|"left","right","top-right"|)
hide_date=input.bool(false,"Hide Time")
import paragjyoti2012/LoggerLib/1 as Logger
var logger=Logger.init()
var logTable=Logger.initTable(logger,rows,offset,position,size,hide_date)
rsi=ta.rsi(close,14)
|macd,signal,hist|=ta.macd(close,12,26,9)
if(ta.crossunder(close,34000))
Logger.log("Dropped Below 34000",logger,logTable,"warning")
if(ta.crossunder(close,35000))
Logger.log("Dropped Below 35000",logger,logTable)
if(ta.crossover(close,38000))
Logger.log("Crossed 38000",logger,logTable,"info")
if(ta.crossunder(rsi,20))
Logger.log("RSI Below 20",logger,logTable,"error")
if(ta.crossover(macd,signal))
Logger.log("Macd Crossed Over Signal",logger,logTable)
if(ta.crossover(rsi,80))
Logger.log("RSI Above 80",logger,logTable,"success")
////////////////////////////
// For Scrolling the Table View
////////////////////////////
There is a subtle way of achieving nice scrolling behaviour for the Table view. Open the input properties panel for the table/indicator. Focus on the input field for "Offset", once it's focused, you could use your mouse scroll wheel to increment/decrement the offset values; It will smoothly scroll the Logger Table Rows as well.
/////////////////////
For any assistance using this library or reporting issues, please write in the comment section below.
I will try my best to guide you and update the library. Thanks :)
/////////////////////

Reverse Cutlers Relative Strength Index On ChartIntroduction
The Reverse Cutlers Relative Strength Index (RCRSI) OC is an indicator which tells the user what price is required to give a particular Cutlers Relative Strength Index ( RSI ) value, or cross its Moving Average (MA) signal line.
Overview
Background & Credits:
The relative strength index ( RSI ) is a momentum indicator used in technical analysis that was originally developed by J. Welles Wilder Jr. and introduced in his seminal 1978 book, “New Concepts in Technical Trading Systems.”.
Cutler created a variation of the RSI known as “Cutlers RSI” using a different formulation to avoid an inherent accuracy problem which arises when using Wilders method of smoothing.
Further developments in the use, and more nuanced interpretations of the RSI have been developed by Cardwell, and also by well-known chartered market technician, Constance Brown C.M.T., in her acclaimed book "Technical Analysis for the Trading Professional” 1999 where she described the idea of bull and bear market ranges for RSI , and while she did not actually reveal the formulas, she introduced the concept of “reverse engineering” the RSI to give price level outputs.
Renowned financial software developer, co-author of academic books on finance, and scientific fellow to the Department of Finance and Insurance at the Technological Educational Institute of Crete, Giorgos Siligardos PHD . brought a new perspective to Wilder’s RSI when he published his excellent and well-received articles "Reverse Engineering RSI " and "Reverse Engineering RSI II " in the June 2003, and August 2003 issues of Stocks & Commodities magazine, where he described his methods of reverse engineering Wilders RSI .
Several excellent Implementations of the Reverse Wilders Relative Strength Index have been published here on Tradingview and elsewhere.
My utmost respect, and all due credits to authors of related prior works.
Introduction
It is worth noting that while the general RSI formula, and the logic dictating the UpMove and DownMove data series has remained the same as the Wilders original formulation, it has been interpreted in a different way by using a different method of averaging the upward, and downward moves.
Cutler recognized the issue of data length dependency when using wilders smoothing method of calculating RSI which means that wilders standard RSI will have a potential initialization error which reduces with every new data point calculated meaning early results should be regarded as unreliable until enough calculation iterations have occurred for convergence.
Hence Cutler proposed using Simple Moving Averaging for gain and loss data which this Indicator is based on.
Having "Reverse engineered" prices for any oscillator makes the planning, and execution of strategies around that oscillator far simpler, more timely and effective.
Introducing the Reverse Cutlers RSI which consists of plotted lines on a scale of 0 to 100, and an optional infobox.
The RSI scale is divided into zones:
• Scale high (100)
• Bull critical zone (80 - 100)
• Bull control zone (62 - 80)
• Scale midline (50)
• Bear control zone (20 - 38)
• Bear critical zone (0 - 20)
• Scale low (0)
The RSI plots which graphically display output closing price levels where Cutlers RSI value will crossover:
• RSI (eq) (previous RSI value)
• RSI MA signal line
• RSI Test price
• Alert level high
• Alert level low
The info box displays output closing price levels where Cutlers RSI value will crossover:
• Its previous value. ( RSI )
• Bull critical zone.
• Bull control zone.
• Mid-Line.
• Bear control zone.
• Bear critical zone.
• RSI MA signal line
• Alert level High
• Alert level low
And also displays the resultant RSI for a user defined closing price:
• Test price RSI
The infobox outputs can be shown for the current bar close, or the next bar close.
The user can easily select which information they want in the infobox from the setttings
Importantly:
All info box price levels for the current bar are calculated immediately upon the current bar closing and a new bar opening, they will not change until the current bar closes.
All info box price levels for the next bar are projections which are continually recalculated as the current price changes, and therefore fluctuate as the current price changes.
Understanding the Relative Strength Index
At its simplest the RSI is a measure of how quickly traders are bidding the price of an asset up or down.
It does this by calculating the difference in magnitude of price gains and losses over a specific lookback period to evaluate market conditions.
The RSI is displayed as an oscillator (a line graph that can move between two extremes) and outputs a value limited between 0 and 100.
It is typically accompanied by a moving average signal line.
Traditional interpretations
Overbought and oversold:
An RSI value of 70 or above indicates that an asset is becoming overbought (overvalued condition), and may be may be ready for a trend reversal or corrective pullback in price.
An RSI value of 30 or below indicates that an asset is becoming oversold (undervalued condition), and may be may be primed for a trend reversal or corrective pullback in price.
Midline Crossovers:
When the RSI crosses above its midline ( RSI > 50%) a bullish bias signal is generated. (only take long trades)
When the RSI crosses below its midline ( RSI < 50%) a bearish bias signal is generated. (only take short trades)
Bullish and bearish moving average signal Line crossovers:
When the RSI line crosses above its signal line, a bullish buy signal is generated
When the RSI line crosses below its signal line, a bearish sell signal is generated.
Swing Failures and classic rejection patterns:
If the RSI makes a lower high, and then follows with a downside move below the previous low, a Top Swing Failure has occurred.
If the RSI makes a higher low, and then follows with an upside move above the previous high, a Bottom Swing Failure has occurred.
Examples of classic swing rejection patterns
Bullish swing rejection pattern:
The RSI moves into oversold zone (below 30%).
The RSI rejects back out of the oversold zone (above 30%)
The RSI forms another dip without crossing back into oversold zone.
The RSI then continues the bounce to break up above the previous high.
Bearish swing rejection pattern:
The RSI moves into overbought zone (above 70%).
The RSI rejects back out of the overbought zone (below 70%)
The RSI forms another peak without crossing back into overbought zone.
The RSI then continues to break down below the previous low.
Divergences:
A regular bullish RSI divergence is when the price makes lower lows in a downtrend and the RSI indicator makes higher lows.
A regular bearish RSI divergence is when the price makes higher highs in an uptrend and the RSI indicator makes lower highs.
A hidden bullish RSI divergence is when the price makes higher lows in an uptrend and the RSI indicator makes lower lows.
A hidden bearish RSI divergence is when the price makes lower highs in a downtrend and the RSI indicator makes higher highs.
Regular divergences can signal a reversal of the trending direction.
Hidden divergences can signal a continuation in the direction of the trend.
Chart Patterns:
RSI regularly forms classic chart patterns that may not show on the underlying price chart, such as ascending and descending triangles & wedges , double tops, bottoms and trend lines etc.
Support and Resistance:
It is very often easier to define support or resistance levels on the RSI itself rather than the price chart.
Modern interpretations in trending markets:
Modern interpretations of the RSI stress the context of the greater trend when using RSI signals such as crossovers, overbought/oversold conditions, divergences and patterns.
Constance Brown, CMT , was one of the first who promoted the idea that an oversold reading on the RSI in an uptrend is likely much higher than 30%, and that an overbought reading on the RSI during a downtrend is much lower than the 70% level.
In an uptrend or bull market, the RSI tends to remain in the 40 to 90 range, with the 40-50 zone acting as support.
During a downtrend or bear market, the RSI tends to stay between the 10 to 60 range, with the 50-60 zone acting as resistance.
For ease of executing more modern and nuanced interpretations of RSI it is very useful to break the RSI scale into bull and bear control and critical zones.
These ranges will vary depending on the RSI settings and the strength of the specific market’s underlying trend.
Limitations of the RSI
Like most technical indicators, its signals are most reliable when they conform to the long-term trend.
True trend reversal signals are rare, and can be difficult to separate from false signals.
False signals or “fake-outs”, e.g. a bullish crossover, followed by a sudden decline in price, are common.
Since the indicator displays momentum, it can stay overbought or oversold for a long time when an asset has significant sustained momentum in either direction.
Data Length Dependency when using wilders smoothing method of calculating RSI means that wilders standard RSI will have a potential initialization error which reduces with every new data point calculated meaning early results should be regarded as unreliable until calculation iterations have occurred for convergence.

Reverse Cutlers Relative Strength IndexIntroduction
The Reverse Cutlers Relative Strength Index (RCRSI) is an indicator which tells the user what price is required to give a particular Cutlers Relative Strength Index (RSI) value, or cross its Moving Average (MA) signal line.
Overview
Background & Credits:
The relative strength index (RSI) is a momentum indicator used in technical analysis that was originally developed by J. Welles Wilder Jr. and introduced in his seminal 1978 book, “New Concepts in Technical Trading Systems.”.
Cutler created a variation of the RSI known as “Cutlers RSI” using a different formulation to avoid an inherent accuracy problem which arises when using Wilders method of smoothing.
Further developments in the use, and more nuanced interpretations of the RSI have been developed by Cardwell, and also by well-known chartered market technician, Constance Brown C.M.T., in her acclaimed book "Technical Analysis for the Trading Professional” 1999 where she described the idea of bull and bear market ranges for RSI, and while she did not actually reveal the formulas, she introduced the concept of “reverse engineering” the RSI to give price level outputs.
Renowned financial software developer, co-author of academic books on finance, and scientific fellow to the Department of Finance and Insurance at the Technological Educational Institute of Crete, Giorgos Siligardos PHD. brought a new perspective to Wilder’s RSI when he published his excellent and well-received articles "Reverse Engineering RSI " and "Reverse Engineering RSI II " in the June 2003, and August 2003 issues of Stocks & Commodities magazine, where he described his methods of reverse engineering Wilders RSI.
Several excellent Implementations of the Reverse Wilders Relative Strength Index have been published here on Tradingview and elsewhere.
My utmost respect, and all due credits to authors of related prior works.
Introduction
It is worth noting that while the general RSI formula, and the logic dictating the UpMove and DownMove data series as described above has remained the same as the Wilders original formulation, it has been interpreted in a different way by using a different method of averaging the upward, and downward moves.
Cutler recognized the issue of data length dependency when using wilders smoothing method of calculating RSI which means that wilders standard RSI will have a potential initialization error which reduces with every new data point calculated meaning early results should be regarded as unreliable until enough calculation iterations have occurred for convergence.
Hence Cutler proposed using Simple Moving Averaging for gain and loss data which this Indicator is based on.
Having "Reverse engineered" prices for any oscillator makes the planning, and execution of strategies around that oscillator far simpler, more timely and effective.
Introducing the Reverse Cutlers RSI which consists of plotted lines on a scale of 0 to 100, and an optional infobox.
The RSI scale is divided into zones:
• Scale high (100)
• Bull critical zone (80 - 100)
• Bull control zone (62 - 80)
• Scale midline (50)
• Bear critical zone (20 - 38)
• Bear control zone (0 - 20)
• Scale low (0)
The RSI plots are:
• Cutlers RSI
• RSI MA signal line
• Test price RSI
• Alert level high
• Alert level low
The info box displays output closing price levels where Cutlers RSI value will crossover:
• Its previous value. (RSI )
• Bull critical zone.
• Bull control zone.
• Mid-Line.
• Bear control zone.
• Bear critical zone.
• RSI MA signal line
• Alert level High
• Alert level low
And also displays the resultant RSI for a user defined closing price:
• Test price RSI
The infobox outputs can be shown for the current bar close, or the next bar close.
The user can easily select which information they want in the infobox from the setttings
Importantly:
All info box price levels for the current bar are calculated immediately upon the current bar closing and a new bar opening, they will not change until the current bar closes.
All info box price levels for the next bar are projections which are continually recalculated as the current price changes, and therefore fluctuate as the current price changes.
Understanding the Relative Strength Index
At its simplest the RSI is a measure of how quickly traders are bidding the price of an asset up or down.
It does this by calculating the difference in magnitude of price gains and losses over a specific lookback period to evaluate market conditions.
The RSI is displayed as an oscillator (a line graph that can move between two extremes) and outputs a value limited between 0 and 100.
It is typically accompanied by a moving average signal line.
Traditional interpretations
Overbought and oversold:
An RSI value of 70 or above indicates that an asset is becoming overbought (overvalued condition), and may be may be ready for a trend reversal or corrective pullback in price.
An RSI value of 30 or below indicates that an asset is becoming oversold (undervalued condition), and may be may be primed for a trend reversal or corrective pullback in price.
Midline Crossovers:
When the RSI crosses above its midline (RSI > 50%) a bullish bias signal is generated. (only take long trades)
When the RSI crosses below its midline (RSI < 50%) a bearish bias signal is generated. (only take short trades)
Bullish and bearish moving average signal Line crossovers:
When the RSI line crosses above its signal line, a bullish buy signal is generated
When the RSI line crosses below its signal line, a bearish sell signal is generated.
Swing Failures and classic rejection patterns:
If the RSI makes a lower high, and then follows with a downside move below the previous low, a Top Swing Failure has occurred.
If the RSI makes a higher low, and then follows with an upside move above the previous high, a Bottom Swing Failure has occurred.
Examples of classic swing rejection patterns
Bullish swing rejection pattern:
The RSI moves into oversold zone (below 30%).
The RSI rejects back out of the oversold zone (above 30%)
The RSI forms another dip without crossing back into oversold zone.
The RSI then continues the bounce to break up above the previous high.
Bearish swing rejection pattern:
The RSI moves into overbought zone (above 70%).
The RSI rejects back out of the overbought zone (below 70%)
The RSI forms another peak without crossing back into overbought zone.
The RSI then continues to break down below the previous low.
Divergences:
A regular bullish RSI divergence is when the price makes lower lows in a downtrend and the RSI indicator makes higher lows.
A regular bearish RSI divergence is when the price makes higher highs in an uptrend and the RSI indicator makes lower highs.
A hidden bullish RSI divergence is when the price makes higher lows in an uptrend and the RSI indicator makes lower lows.
A hidden bearish RSI divergence is when the price makes lower highs in a downtrend and the RSI indicator makes higher highs.
Regular divergences can signal a reversal of the trending direction.
Hidden divergences can signal a continuation in the direction of the trend.
Chart Patterns:
RSI regularly forms classic chart patterns that may not show on the underlying price chart, such as ascending and descending triangles & wedges, double tops, bottoms and trend lines etc.
Support and Resistance:
It is very often easier to define support or resistance levels on the RSI itself rather than the price chart.
Modern interpretations in trending markets:
Modern interpretations of the RSI stress the context of the greater trend when using RSI signals such as crossovers, overbought/oversold conditions, divergences and patterns.
Constance Brown, CMT, was one of the first who promoted the idea that an oversold reading on the RSI in an uptrend is likely much higher than 30%, and that an overbought reading on the RSI during a downtrend is much lower than the 70% level.
In an uptrend or bull market, the RSI tends to remain in the 40 to 90 range, with the 40-50 zone acting as support.
During a downtrend or bear market, the RSI tends to stay between the 10 to 60 range, with the 50-60 zone acting as resistance.
For ease of executing more modern and nuanced interpretations of RSI it is very useful to break the RSI scale into bull and bear control and critical zones.
These ranges will vary depending on the RSI settings and the strength of the specific market’s underlying trend.
Limitations of the RSI
Like most technical indicators, its signals are most reliable when they conform to the long-term trend.
True trend reversal signals are rare, and can be difficult to separate from false signals.
False signals or “fake-outs”, e.g. a bullish crossover, followed by a sudden decline in price, are common.
Since the indicator displays momentum, it can stay overbought or oversold for a long time when an asset has significant sustained momentum in either direction.
Data Length Dependency when using wilders smoothing method of calculating RSI means that wilders standard RSI will have a potential initialization error which reduces with every new data point calculated meaning early results should be regarded as unreliable until calculation iterations have occurred for convergence.

[VJ]Thor for MFIThis is a simple intraday strategy for working on Stocks or commodities . You can modify the start time and end time based on your timezones. Session value should be from market start to the time you want to square-off
Important: The end time should be at least 2 minutes before the intraday square-off time set by your broker
Comment below if you get good returns
Strategy:
Indicators used :
Moving average (MA) is a widely used technical indicator that smooths out price trends by filtering out the “noise” from random short-term price fluctuations. Here moving averages are used to identify trend direction and to determine support and resistance levels. Overbought and oversold regions are also taken into consideration
The Money Flow Index ( MFI ) is a momentum indicator that measures the flow of money into and out of a security over a specified period of time. It is related to the Relative Strength Index ( RSI ) but incorporates volume , whereas the RSI only considers price. The MFI is calculated by accumulating positive and negative Money Flow values (see Money Flow ), then creating a Money Ratio. The Money Ratio is then normalized into the MFI oscillator form.
Using the combination of Overbought and Oversold values and varying MFI and using the MA filter to ensure the direction , we can buy/sell when conditions are met
Buying with MFI
1. MFI drops below 20 and enters inside oversold zone.
2. MFI bounces back above 20.
3. MFI pulls back but remains above 20.
4. A MFI break out above its previous high is a good buy signal.
Selling with MFI
1. MFI rises above 80 and enters inside overbought zone.
2. MFI drops back below 80.
3. MFI rises slightly but remains below 80.
4. MFI drops lower than its previous low is a signal to short sell or profit booking
Usage & Best setting :
Choose a good volatile stock and a time frame - 5m.
MFI factor : 3
Moving Average : 80
Overbought & Oversold - can be varied as per user
There is stop loss and take profit that can be used to optimise your trade
The template also includes daily square off based on your time.

"DSS" Bessert Double Smooth Stochastic Alma Variant Hi colleagues I share this time DSS bressert.
As usual they have all the adjustable colors and signals. I hope you enjoy them and leave here below the length of signals that best suit your needs so that we can continue sharing content
Description
One after the other, William Blau and Walter Bressert each presented a version of the Double Smoothed Stochastics. Two exponentially smoothed MAs are used to even out the input values (H, L and C), in a similar way to the well-known stochastic formula.
Parameters
The adjustable period length can be chosen from 2 to 500. The most common settings will have a period length ranging from 5 to 30. In addition, the indicator can be smoothed in the interval from 1 to 50. Meaningful smoothing values lie in the short-term range.
Interpretation
The application of the DSS is comparable with that of the stochastic method. Accordingly, values above 70 or 80 must be regarded as overbought and values below 20 or 30 as oversold. A rise of the DSS above its center line should be viewed as bullish, and a fall of the DSS below its center line as bearish.
/// Quick Explained ALMA ///
//Window size: The window size is the look-back period and it is a basic setting of ALMA.
//Experienced traders can change this setting according to their preference.
//But if you are using this indicator for the first time, it is recommended to go with the default setting.
//Offset: The offset value is used to tweak the ALMA so that it will be more inclined
//towards responsiveness or smoothness. You can set the offset in decimals between the 0 to1.
//The value of 0.01 makes it smoother, while a setting of 0.99 makes the indicator more responsive.
//Sigma: The sigma is used for the filter. Any value less than 6 makes the indicator
//more focused, whereas the setting of 6 makes the filter large. According to Mr Arnaud,
//a sigma value of 6 is offer good performance.
/// Explain DSS ///
//Parameters
//The adjustable period length can be chosen from 2 to 500.
//The most common settings will have a period length ranging from 5 to 30.
//In addition, the indicator can be smoothed in the interval from 1 to 50.
//Meaningful smoothing values lie in the short-term range.
//Interpretation
//The application of the DSS is comparable with that of the stochastic method.
//Accordingly, values above 70 or 80 must be regarded as overbought and values below 20 or 30 as oversold.
//A rise of the DSS above its center line should be viewed as bullish,
//and a fall of the DSS below its center line as bearish
/// End Of The Code///
Modified RSI Multi-Time Frame (HM)Effective RSI with Multi-Timeframe with Hilema - Milega(HM) concept (HM=WMA -EMA). RSI Script is included with WMA and EMA band for RSI1 and it works very simple
i) When the RSI band turns to Green its a Buy signal. Normally whenever Bearish strength weakens and move towards the Bullish area, the WMA and EMA cross each other and that tends to provide a possible trend change. A trade at crossover normally provides a very good trading oppertunity. One can combine with some other Price action if needed for double confirmation.
ii)When RSI band turns to RED its a Sell signal. As explained in the point 1 , its a vice-versa where a crossover of WMA and EMA is perfect entry to get a good swing trade. Once can combine this tool with Price action for double confirmation.
iii) Using the Multi timeframe user could able to find the trend at higher timeframe to take double confirm on the trend strength and take a perfect oppertunity to take the trade.
By default, script uses the RSI with length 14, WMA 21 and EMA 3 which perfectly working for Index in NSE. Please change as per your requirement.
Apart from the above band, RSI is not have the different levels like 20/ 40 /50/60/80
Multi-timeframes currently set as
RSI1 - Same as Chart
RSI2 - 15 Min
RSI3 - 60 Min
RSI4 - Daily
Script has enabled the option to change the values for these timeframes as per the user requirement.
These ranges can be interpreted and acts as a probable swing points based on the trend and momentum.
40-60 - Neutral Range or Sideways
20 - 60 Bearish range
40 - 70 - Bullish range
Below 20 -- Over Sold Zone
Above 80 - over Bought zone
Also, the crossovers of the WMA and EMA on the RSI gives a very good momentum towards that trend.
[blackcat] L1 Mel Widner Rainbow OscillatorNOTE: Because the originally released script failed to comply with the House Rule in the description, it was banned. After revising and reviewing the description, it is republished again. Please forgive the inconvenience caused.
Level: 1
Background
Mel Widner developed the Rainbow Oscillator and published it in 1997 in the Technical Analysis of Stocks and Commodities magazine.
Function
Mel Widner Rainbow Oscillator helps to predict the changes in the market trend and to follow trends. The oscillator is derived from a consensus of trends that, when plotted in color, has the appearance of a rainbow. It offers only two possible states, the upward and the downward. The Rainbow Oscillator is based on the Rainbow charts trend and is just like the Rainbow Moving Average charts. It works on the basis of a two-period moving average and its graph also helps to identify the highest high value and the lowest low value among moving averages. The Rainbow Oscillator is a simple indicator used to forecast trend reversal. It is a simple yet very important technical analysis tool. The oscillator works on the same rules as does the Rainbow indicator. It uses two simple moving averages, HHV and LLV. The Rainbow Oscillator creates an oscillator with bandwidth lines. Although it is a relatively new indicator but has become very popular for effectively forecasting the changes in the trend direction. The Rainbow Oscillator appears as a director of the trend as it follows the ups and downs of the market. The growing width of the Rainbow indicates that the current trend is likely to continue. The values of the Rainbow Oscillator beyond 80 suggest an unstable market and prone to a sudden reversal of the current market trend. On the other hand, when the prices move to the Rainbow and the Rainbow Oscillator begins to become flat, it indicates that the market is stable and the bandwidth decreases. The Rainbow Oscillator values falling below 20 again indicate an unstable market and also prone to a sudden reversal of the current trend in the market.
In simple words, we can derive the following rules.
The Rainbow Oscillator’s wider width suggests a continuation of the current trend.
The Rainbow Oscillator between -50 and +50 indicates a stable trend.
When traveling beyond 80, the Rainbow Oscillator suggests an unstable market and a possible reversal of the current trend.
The Rainbow Oscillator traveling below 20 also indicates instability and a potential reversal of the current market trend.
Key Signal
PosNeg --> Rainbow Oscillator Output.
Labels and alerts are added.
Remarks
This is a Level 1 free and open source indicator.
Feedbacks are appreciated.
Stochastic RSI - DurbtradeDurbtrade Stoch RSI -
1) Stoch RSI
A) The K line can be customized to change color based on vertical direction.
B) The space between K line and D line can be filled with a color depending on whether K line is above or below the D line.
C) There are color-coded, cross-over and cross-under background fills, to signal when the K line crosses the D line.
D) K line is drawn in front of D line (D line is drawn behind K line).
E) Default values : K = 3, D = 4, RSI Length = 14, Stoch Length = 14
2) Horizontal Lines
A) Horizontal lines can be drawn automatically, so you don't have to draw them, and they don't extend past the current bar.
B) There are 11 customizable horizontal lines,
and each line is set to non-customizable increments (zero, 10, 20, 30, 40, fifty, 60, 70, 80, 90, hundred).
C) The 11 lines are divided into 2 groups:
a) 4 PAIRS of lines WITH fill options (10/90, 20/80, 30/70, 40/60... 8 lines total), and
b) 3 INDIVIDUAL lines WITHOUT fill options (zero, fifty, hundred).
D) The 4 fills give you the option to fill the space between each pair with a customizable color and opacity,
regardless of whether the lines themselves are drawn or not.
(all default values are what I feel work best for this indicator...
and initially, only the zero, fifty, and hundred lines are drawn automatically .
You may add the other lines if you choose to, by adjusting the opacity to your liking).
3) Conclusion
A) As with my previous indicators, this one maximizes information, color, discernment, clarity, and customization.
B) It is optimized for your ability to be able to easily customize the indicator according to your preferences...
for use on your own personal television, laptop, or cellular phone screen setup... and on all chart zoom levels and layouts.
C) Please feel free to comment your thoughts, critiques, or suggestions. They are all helpful!
D) Check out my previous pine script indicators if you like this one. They work really well together.
E) I hope that you find this script useful.
F) Enjoy!
//Durbtrade

Combo Backtest 123 Reversal & Rainbow Oscillator This is combo strategies for get a cumulative signal.
First strategy
This System was created from the Book "How I Tripled My Money In The
Futures Market" by Ulf Jensen, Page 183. This is reverse type of strategies.
The strategy buys at market, if close price is higher than the previous close
during 2 days and the meaning of 9-days Stochastic Slow Oscillator is lower than 50.
The strategy sells at market, if close price is lower than the previous close price
during 2 days and the meaning of 9-days Stochastic Fast Oscillator is higher than 50.
Second strategy
Ever since the people concluded that stock market price movements are not
random or chaotic, but follow specific trends that can be forecasted, they
tried to develop different tools or procedures that could help them identify
those trends. And one of those financial indicators is the Rainbow Oscillator
Indicator. The Rainbow Oscillator Indicator is relatively new, originally
introduced in 1997, and it is used to forecast the changes of trend direction.
As market prices go up and down, the oscillator appears as a direction of the
trend, but also as the safety of the market and the depth of that trend. As
the rainbow grows in width, the current trend gives signs of continuity, and
if the value of the oscillator goes beyond 80, the market becomes more and more
unstable, being prone to a sudden reversal. When prices move towards the rainbow
and the oscillator becomes more and more flat, the market tends to remain more
stable and the bandwidth decreases. Still, if the oscillator value goes below 20,
the market is again, prone to sudden reversals. The safest bandwidth value where
the market is stable is between 20 and 80, in the Rainbow Oscillator indicator value.
The depth a certain price has on a chart and into the rainbow can be used to judge
the strength of the move.
WARNING:
- For purpose educate only
- This script to change bars colors.
3x SuperTrend Strategy (Mel0nTek) V1This is a triple SuperTrend based strategy for lower time frame trades such as day trades and scalping. I have not seen many strategies that combine multiple SuperTrends so I thought I would publish this one since I put it together and have been quite happy with the results. I have found through testing that the best results are on currency exchange markets such as Crypto or Forex on 1-15 min time frames.
The core idea was inspired by a youtube video put out by Trade Pro:
"Trade Pro - HIGHEST PROFIT Triple Supertrend Trading Strategy Proven 100 Trade Results"
I went ahead and set the defaults to the ones he uses in his video for anyone who wants to try a configuration similar to his. They work pretty well in general, however the EMA, SuperTrend ATR multipliers, and P/L ratio can be tuned/optimized to fit the timeframe/market desired. The video is quite good but not a required watch as I will explain below.
The 200EMA is used as a medium-term trend direction indicator.
- Price closing consistently above the 200EMA means that only long positions should be entered.
- Price closing consistently below 200EMA means that only short positions should be entered.
The 3 SuperTrend indicators should be used as direction confirmation for entries. Typically, price above SuperTrend indicates bullish movement, while price below SuperTrend indicates Bearish movement. However by itself, it is not a great indication to enter/exit positions in my experience. By combining 3 of them with slightly longer periods and increased ATR multipliers, we can get much stronger confirmation of trend direction/strength.
The way they are used in this strategy is such that:
- We only want to enter a position if at least 2 out of 3 SuperTrends are on our side.
- 3/3 SuperTrends on our side is the best case, since we are taking trades WITH momentum/price strength.
- The second farthest SuperTrend from entry price is used as a Stop Loss
SuperTrend being on our side is not the only requirement for an entry however. The probability of success is increased with SuperTrend, and a longer EMA on our side, but we want to be sure that we aren't getting in too late/after the movement has already happened.
So we use Stoch RSI to pick our entries where price is oversold/overbought and reversing. That means the Stoch RSI is above 80, or below 20, and our indication to enter the trade is when the 2 lines cross/begin reversing direction.
So with trend direction on our side, we can get really good entries at these oversold/overbought extremes, especially as it's reversing (Stoch RSI K and D are crossing). This allows us to use the SuperTrend as a support/stop loss on our entry since price should be above it.
Then we just target 1.5x our max loss so that even if we only win 50% of the time, we still make a profit.
The explicit rules of this strategy are as follows:
=== Rules ===
long only
- price above EMA200
short only
- price below EMA200
Stop Loss = 2nd SuperTrend line above (short) or below(long) entry candle
Profit = 1.5x SL/risk (Profit Ratio x Max Loss)
=== Entry Setup ===
LONG
- Stoch RSI below 20, cross up
- at least 2 SuperTrend lines below close
SHORT
- Stoch RSI above 80, cross down
- at least 2 SuperTrend lines above close
P.S. Special thanks to Trade Pro for producing so many quality videos, putting strategy claims to the test, and providing me with so many good ideas I apply to my own strategies.
