Sector
Sector Rotation & Money Flow Dashboard📊 Overview
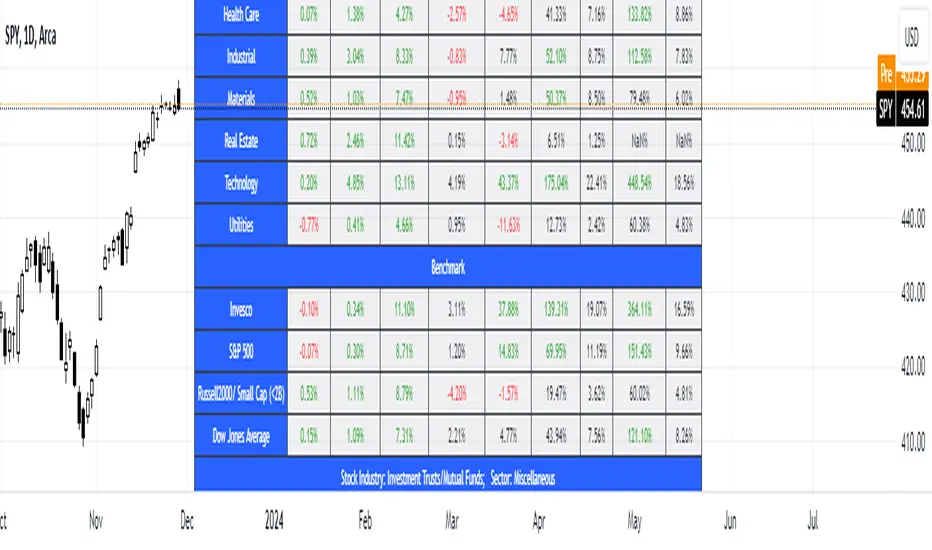
The Sector Rotation & Money Flow Dashboard is a comprehensive market analysis tool that tracks 39 major sector ETFs in real-time, providing institutional-grade insights into sector rotation, momentum shifts, and money flow patterns. This indicator helps traders identify which sectors are attracting capital, which are losing favor, and where the next opportunities might emerge.
Perfect for swing traders, position traders, and investors who want to stay ahead of sector rotation and ride the strongest trends while avoiding weak sectors.
🎯 What This Indicator Does
Tracks 39 Major Sectors: From technology to utilities, cryptocurrencies to commodities
Calculates Multiple Timeframes: 1-week, 1-month, 3-month, and 6-month performance
Advanced Momentum Metrics: Proprietary momentum score and acceleration calculations
Relative Strength Analysis: Compare sector performance against any benchmark index
Money Flow Signals: Visual indicators showing where institutional money is moving
Smart Filtering: Pre-built strategy filters for different trading styles
Trend Detection: Emoji-based visual system for quick trend identification
💡 Key Features
1. Performance Metrics
Multiple timeframe analysis (1W, 1M, 3M, 6M)
Month-over-month change tracking
Relative strength vs benchmark index
2. Advanced Analytics
Momentum Score: Weighted composite of recent performance
Acceleration: Rate of change in momentum (second derivative)
Money Flow Signals: IN/OUT/TURN/WATCH indicators
3. Strategy Preset Filters
🎯 Swing Trade: High momentum opportunities
📈 Trend Follow: Established uptrends
🔄 Mean Reversion: Oversold bounce candidates
💎 Value Hunt: Deep value opportunities
🚀 Breakout: Emerging strength
⚠️ Risk Off: Sectors to avoid
4. Customization
All 39 sector ETFs can be customized
Adjustable benchmark index
Flexible display options
Multiple sorting methods
📋 Settings Documentation
Display Settings
Show Table (Default: On)
Toggles the entire dashboard display
Table Position (Default: Middle Center)
Choose from 9 positions on your chart
Options: Top/Middle/Bottom × Left/Center/Right
Rows to Show (Default: 15)
Number of sectors displayed (5-40)
Useful for focusing on top/bottom performers
Sort By (Default: Momentum)
1M/3M/6M: Sort by specific timeframe performance
Momentum: Weighted recent performance score
Acceleration: Rate of momentum change
1M Change: Month-over-month improvement
RS: Relative strength vs benchmark
Flow: IN First: Prioritize sectors with inflows
Flow: TURN First: Focus on reversal candidates
Recovery Plays: Oversold sectors recovering
Oversold Bounce: Deepest declines with positive signs
Top Gainers/Losers 3M: Best/worst quarterly performers
Best Acc + Mom: Combined strength score
Worst Acc (Topping): Sectors losing momentum
Filter Settings
Strategy Preset Filter (Default: All)
All: No filtering
🎯 Swing Trade: Mom >5, Acc >2, Money flowing in
📈 Trend Follow: Positive 1M & 3M, RS >0
🔄 Mean Reversion: Oversold but improving
💎 Value Hunt: Down >10% with recovery signs
🚀 Breakout: Rapid momentum surge
⚠️ Risk Off: Declining or topping sectors
Custom Flow Filter: Use manual flow filter
Custom Flow Signal Filter (Default: All)
Only active when Strategy Preset = "Custom Flow Filter"
IN Only: Strong inflows
TURN Only: Reversal signals
WATCH Only: Recovery candidates
OUT Only: Outflow sectors
Active Flows Only: Any non-neutral signal
Hide Low Volume ETFs (Default: Off)
Filters out illiquid sectors (future enhancement)
Visual Settings
Show Trend Emojis (Default: On)
🚀 Breakout (Strong 1M + High Acceleration)
🔥 Hot Recovery (From -10% to positive)
💪 Steady Uptrend (All timeframes positive)
➡️ Sideways/Ranging
⚠️ Warning/Topping (Up >15%, now slowing)
📉 Falling (Negative + declining)
🔄 Bottoming (Improving from lows)
Compact Mode (Default: Off)
Removes decimals for cleaner display
Useful when showing many rows
Min Data Points Required (Default: 3)
Minimum data points needed to display a sector
Prevents showing sectors with insufficient data
Relative Strength Settings
RS Benchmark Index (Default: AMEX:SPY)
Index to compare all sectors against
Can use SPY, QQQ, IWM, or any other index
RS Period (Days) (Default: 21)
Lookback period for RS calculation
21 days = 1 month, 63 days = 3 months, etc.
Sector ETF Settings (Groups 1-39)
Each sector has two inputs:
Symbol: The ticker (e.g., "AMEX:XLF")
Name: Display name (e.g., "Financials")
All 39 sectors can be customized to track different ETFs or markets.
📈 Column Explanations
Sector: ETF name/description
1M%: 1-month (21-day) performance
3M%: 3-month (63-day) performance
6M%: 6-month (126-day) performance
Mom: Momentum score (weighted average, recent-biased)
Acc: Acceleration (momentum rate of change)
Δ1M: Month-over-month change
RS: Relative strength vs benchmark
Flow: Money flow signal
↗️ IN: Strong inflows
🔄 TURN: Potential reversal
👀 WATCH: Recovery candidate
↘️ OUT: Outflows
—: Neutral
🎮 Usage Tips
For Swing Traders (3-14 days)
Use "🎯 Swing Trade" filter
Sort by "Acceleration" or "Momentum"
Look for Flow = "IN" and Mom >10
Confirm with positive RS
For Position Traders (2-8 weeks)
Use "📈 Trend Follow" filter
Sort by "RS" or "Best Acc + Mom"
Focus on consistent green across timeframes
Ensure RS >3 for market leaders
For Value Investors
Use "💎 Value Hunt" filter
Sort by "Recovery Plays" or "Top Losers 3M"
Look for improving Δ1M
Check for "WATCH" or "TURN" signals
For Risk Management
Regularly check "⚠️ Risk Off" filter
Sort by "Worst Acc (Topping)"
Review holdings for ⚠️ warning emojis
Exit sectors showing "OUT" flow
Market Regime Recognition
Bull Market: Many sectors showing "IN" flow, positive RS
Bear Market: Widespread "OUT" flows, negative RS
Rotation: Mixed flows, some "IN" while others "OUT"
Recovery: Multiple "TURN" and "WATCH" signals
🔧 Pro Tips
Combine Filters + Sorting: Filter first to narrow candidates, then sort to prioritize
Multi-Timeframe Confirmation: Best setups show alignment across 1M, 3M, and momentum
RS is Key: Sectors outperforming SPY (RS >0) tend to continue outperforming
Acceleration Matters: Positive acceleration often precedes price breakouts
Flow Transitions: "WATCH" → "TURN" → "IN" progression identifies new trends early
Regular Scans:
Daily: Check "Acceleration" sort
Weekly: Review "1M Change"
Monthly: Analyze "RS" shifts
Divergence Signals:
Price up but Acceleration down = Potential top
Price down but Acceleration up = Potential bottom
Sector Pairs Trading: Long sectors with "IN" flow, short sectors with "OUT" flow
⚠️ Important Notes
This indicator makes 40 security requests (maximum allowed)
Best used on Daily timeframe
Data updates in real-time during market hours
Some ETFs may show "—" if data is unavailable
🎯 Common Strategies
"Follow the Flow"
Only trade sectors showing "IN" flow with positive RS
"Rotation Catcher"
Focus on "TURN" signals in sectors down >15% from highs
"Momentum Rider"
Trade top 3 sectors by Momentum score, exit when Acceleration turns negative
"Mean Reversion"
Buy sectors in bottom 20% by 3M performance when Δ1M improves
"Relative Strength Leader"
Maintain positions only in sectors with RS >5
Not financial advice - always do additional research

Sector Relative StrengthDescription
This script compares sector performance relative to the S&P 500. Sector price levels or charts alone can mislead, because they tend to move with the broader market. An increase in a sector’s price does not necessarily indicate strength, as it may simply be following the index.
For more a more reliable picture, the script calculates a ratio between each sector ETF and SPY. If the ratio has increased, the sector has outperformed the index. In case it has declined, the sector has underperformed. If the value is near zero, the sector has moved in line with the index. The sectors are presented in a table and sorted on relative performance.
Calculation Method
The performance is expressed as a percentage change in the ratio over a user-defined lookback period. The default lookback is set to 21 bars, which corresponds to one month on a daily chart. This value can be adopted in the settings to match preferred time period.
Z-Score
In addition to the percentage change, the script calculates a Z-score of the ratio, which measures how far the current value deviates from its recent mean. A high positive Z-score indicates that the ratio is significantly above its average, while a negative value indicates it is below. This normalization allows for comparison between sectors with different price levels or volatility profiles.
Table Columns
- Relative %: The sector's performance relative to SPY over the selected lookback period
- Z-Score: Standardized measure of current performance ratio is relative to its average
- Trend Arrow: Indicates the direction of relative performance up down or flat
Example Interpretation
For example, if XLK shows a 3.7% change, it has outperformed SPY over the selected period. Another sector might show a -2.1% change, which indicates underperformance. While both values shows relative strength or weakness, the Z-score is optional and can provide additional context based on how unusual that performance is compared to the sector's own recent behavior.
Use Case
This approach helps evaluate overall market conditions and supports a top-down method. By starting with sector performance, it becomes easier to identify where the market is showing leadership or weakness. This allows the stock selection process to be more deliberate and can help refine or customize screeners based on certain sectors.

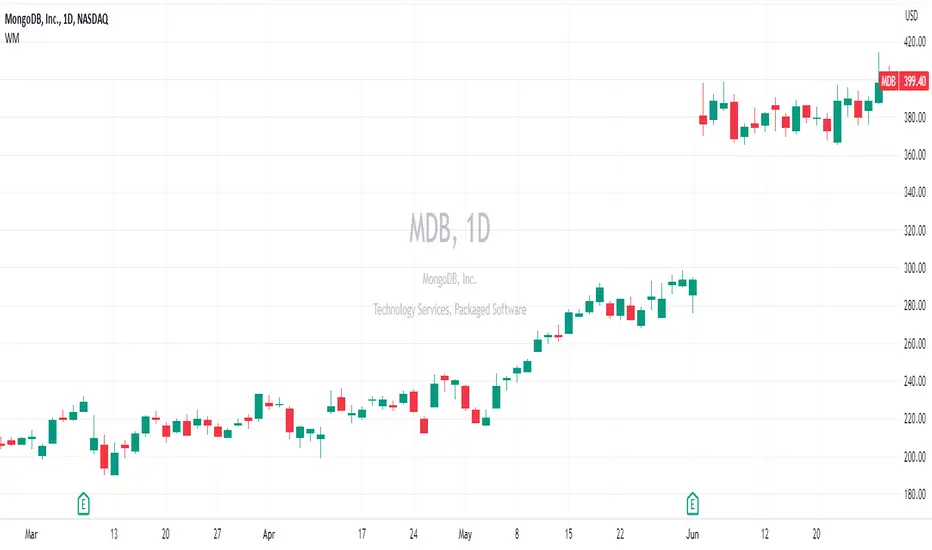
Stock versus IndustryStock vs. Industry Indicator
The Stock vs. Industry Indicator is designed to help traders assess the performance of individual stocks relative to their respective industries. This tool automatically identifies the industry classification of a stock, compares it to a relevant industry ETF, and calculates the stock-to-industry performance ratio in real-time.
Key Features:
Real-Time Performance Comparison: The indicator tracks and compares the price movement of an individual stock against the most relevant ETF for its industry, providing a dynamic view of relative strength.
Stock-to-Industry Ratio: Displays the ratio of stock performance versus industry performance, allowing traders to easily identify outperforming and underperforming stocks within their industry.
SMA Trend Line: The indicator includes a simple moving average (SMA) trend line to assist with visual trend analysis, offering additional context to the stock’s movement in relation to the broader industry.
Customizable Parameters: Users can customize SMA periods, adjust comparison overrides, and use color highlighting to suit their trading preferences and strategies.
Industry Classification: Automatically assigns the correct industry classification to any stock, providing a reliable and automated method for comparing stocks within the same industry.
Benefits:
Identify Leaders and Laggards: Easily distinguish which stocks are outperforming their industry and which are underperforming. This allows traders to make more informed decisions based on relative strength.
Sector Rotation Detection: The indicator helps detect when a stock begins to underperform its industry, which can signal a shift in sector strength. This allows traders to adjust their positions and strategies accordingly.
Breakout Confirmation: When a stock breaks out while outperforming its industry, the indicator provides additional confidence in the breakout’s validity and potential for continued performance.
Avoid Value Traps: By comparing a stock’s performance against its industry, the indicator helps avoid investing in stocks that appear undervalued but are underperforming relative to their peers, reducing the risk of falling into value traps.
Usage:
Timeframes: The indicator works across various timeframes and is adaptable for both short-term and long-term traders.
Customization: Users can modify the parameters and settings to align with their specific trading style, whether day trading or position trading.
Visual Aid: The indicator provides an intuitive chart display, making it easy to understand a stock’s performance relative to its industry at a glance.
Disclaimer:
This indicator does not guarantee future performance or predict market movements. The information provided is based on historical data and current market conditions, which can change rapidly. It is important to use this tool as part of a broader trading strategy, taking into account other market factors and risk management techniques.

Stock ETF Tracker 2.0The Stock Sector ETF tracker with Indicators is a versatile tool designed to track the performance of sector-specific ETFs relative to the current asset. It automatically identifies the sector of the underlying symbol and displays the corresponding ETF’s price action alongside key technical indicators. This helps traders analyze sector trends and correlations in real time.
---
Key Features
Automatic Sector Detection:
Fetches the sector of the current asset (e.g., "Technology" for AAPL).
Maps the sector to a user-defined ETF (default: SPDR sector ETFs) .
Technical Indicators:
Simple Moving Average (SMA): Tracks the ETF’s trend.
Bollinger Bands: Highlights volatility and potential reversals.
Donchian High (52-Week High): Identifies long-term resistance levels.
SPY Regime Filter: Red background color if SP500 is below 200 day SMA.
Customizable Inputs:
Adjust indicator parameters (length, visibility).
Override default ETFs for specific sectors.
Informative Table:
Displays the current sector and ETF symbol in the bottom-right corner.
---
Input Settings
SMA Settings
SMA Length: Period for calculating the Simple Moving Average (default: 200).
Show SMA: Toggle visibility of the SMA line.
Bollinger Bands Settings
BB Length: Period for Bollinger Bands calculation (default: 20).
BB Multiplier: Standard deviation multiplier (default: 2.0).
Show Bollinger Bands: Toggle visibility of the bands.
Donchian High (52-Week High)
Daily High Length: Days used to calculate the high (default: 252, approx. 1 year).
Show High: Toggle visibility of the 52-week high line.
Sector Selections
Customize ETFs for each sector (e.g., replace XLU with another utilities ETF).
---
Example Use Cases
Trend Analysis: Compare a stock’s price action to its sector ETF’s SMA for trend confirmation.
Volatility Signals: Use Bollinger Bands to spot ETF price squeezes or breakouts.
Sector Strength: Monitor if the ETF is approaching its 52-week high to gauge sector momentum.
Enjoy tracking sector trends with ease! 🚀

Stock Sector ETF with IndicatorsThe Stock Sector ETF with Indicators is a versatile tool designed to track the performance of sector-specific ETFs relative to the current asset. It automatically identifies the sector of the underlying symbol and displays the corresponding ETF’s price action alongside key technical indicators. This helps traders analyze sector trends and correlations in real time.
---
Key Features
Automatic Sector Detection:
Fetches the sector of the current asset (e.g., "Technology" for AAPL).
Maps the sector to a user-defined ETF (default: SPDR sector ETFs) .
Technical Indicators:
Simple Moving Average (SMA): Tracks the ETF’s trend.
Bollinger Bands: Highlights volatility and potential reversals.
Donchian High (52-Week High): Identifies long-term resistance levels.
Customizable Inputs:
Adjust indicator parameters (length, visibility).
Override default ETFs for specific sectors.
Informative Table:
Displays the current sector and ETF symbol in the bottom-right corner.
---
Input Settings
SMA Settings
SMA Length: Period for calculating the Simple Moving Average (default: 200).
Show SMA: Toggle visibility of the SMA line.
Bollinger Bands Settings
BB Length: Period for Bollinger Bands calculation (default: 20).
BB Multiplier: Standard deviation multiplier (default: 2.0).
Show Bollinger Bands: Toggle visibility of the bands.
Donchian High (52-Week High)
Daily High Length: Days used to calculate the high (default: 252, approx. 1 year).
Show High: Toggle visibility of the 52-week high line.
Sector Selections
Customize ETFs for each sector (e.g., replace XLU with another utilities ETF).
---
Example Use Cases
Trend Analysis: Compare a stock’s price action to its sector ETF’s SMA for trend confirmation.
Volatility Signals: Use Bollinger Bands to spot ETF price squeezes or breakouts.
Sector Strength: Monitor if the ETF is approaching its 52-week high to gauge sector momentum.
Enjoy tracking sector trends with ease! 🚀

Sector Relative Strength [Afnan]This indicator calculates and displays the relative strength (RS) of multiple sectors against a chosen benchmark. It allows you to quickly compare the performance of various sectors within any global stock market. While the default settings are configured for the Indian stock market , this tool is not limited to it; you can use it for any market by selecting the appropriate benchmark and sector indices.
📊 Key Features ⚙️
Customizable Benchmark: Select any symbol as your benchmark for relative strength calculation. The default benchmark is set to `NSE:CNX100`. This allows for global market analysis by selecting the appropriate benchmark index of any country.
Multiple Sectors: Analyze up to 23 different sector indices. The default settings include major NSE sector indices. This can be customized to any market by using the relevant sector indices of that country.
Individual Sector Control: Toggle the visibility of each sector's RS on the chart.
Color-Coded Plots: Each sector's RS is plotted with a distinct color for easy identification.
Adjustable Lookback Period: Customize the lookback period for RS calculation.
Interactive Table: A sortable table displays the current RS values for all visible sectors, allowing for quick ranking.
Table Customization: Adjust the table's position, text size, and visibility.
Zero Line: A horizontal line at zero provides a reference point for RS values.
🧭 How to Use 🗺️
Add the indicator to your TradingView chart.
Select your desired benchmark symbol. The default is `NSE:CNX100`. For example, use SPY for the US market, or DAX for the German market.
Adjust the lookback period as needed.
Enable/disable the sector indices you want to analyze. The default includes major NSE sector indices like `NSE:CNXIT`, `NSE:CNXAUTO`, etc.
Customize the table's appearance as needed.
Observe the RS plots and the table to identify sectors with relative strength or weakness.
📝 Note 💡
This indicator is designed for sectorial analysis. You can use it with any market by selecting the appropriate benchmark and sector indices.
The default settings are configured for the Indian stock market with `NSE:CNX100` as the benchmark and major NSE sector indices pre-selected.
The relative strength calculation is based on the price change of the sector index compared to the benchmark over the lookback period.
Positive RS values indicate relative outperformance, while negative values indicate relative underperformance.
👨💻 Developer 🛠️
Afnan Tajuddin

S&P 500 Sector StrengthsThe "S&P 500 Sector Strengths" indicator is a sophisticated tool designed to provide traders and investors with a comprehensive view of the relative performance of various sectors within the S&P 500 index. This indicator utilizes the True Strength Index (TSI) to measure and compare the strength of different sectors, offering valuable insights into market trends and sector rotations.
At its core, the indicator calculates the TSI for each sector using price data obtained through the request.security() function. The TSI, a momentum oscillator, is computed using a user-defined smoothing period, allowing for customization based on individual preferences and trading styles. The resulting TSI values for each sector are then plotted on the chart, creating a visual representation of sector strengths.
To use this indicator effectively, traders should focus on comparing the movements of different sector lines. Sectors with lines moving higher are showing increasing strength, while those with descending lines are exhibiting weakness. This comparative analysis can help identify potential investment opportunities and sector rotations. Additionally, when multiple sector lines move in tandem, it may signal a broader market trend.
The indicator includes dashed lines at 0.5 and -0.5, serving as reference points for overbought and oversold conditions. Sectors with TSI values above 0.5 might be considered overbought, suggesting caution, while those below -0.5 could be viewed as oversold, potentially indicating buying opportunities.
One of the key advantages of this indicator is its flexibility. Users can toggle the visibility of individual sectors and customize their colors, allowing for a tailored analysis experience. This feature is particularly useful when focusing on specific sectors or reducing chart clutter for clearer visualization.
The indicator's ability to provide a comprehensive overview of all major S&P 500 sectors in a single chart is a significant benefit. This consolidated view enables quick comparisons and helps in identifying relative strengths and weaknesses across sectors. Such insights can be invaluable for portfolio allocation decisions and in spotting emerging market trends.
Moreover, the dynamic legend feature enhances the indicator's usability. It automatically updates to display only the visible sectors, improving chart readability and interpretation.
By leveraging this indicator, market participants can gain a deeper understanding of sector dynamics within the S&P 500. This enhanced perspective can lead to more informed decision-making in sector allocation strategies and individual stock selection. The indicator's ability to potentially detect early trends by comparing sector strengths adds another layer of value, allowing users to position themselves ahead of broader market movements.
In conclusion, the "S&P 500 Sector Strengths" indicator is a powerful tool that combines technical analysis with sector comparison. Its user-friendly interface, customizable features, and comprehensive sector coverage make it an valuable asset for traders and investors seeking to navigate the complexities of the S&P 500 market with greater confidence and insight.

MultiSector Performance Tracker [LuxAlgo]The MultiSector Performance Tracker tool shows the overall performance of different crypto market sectors within a selected time frame, overlaid on a single chart for easy comparison.
Users can customize the time frame to suit their specific needs, whether daily, weekly, monthly, or yearly.
🔶 USAGE
The tool displays the performance of up to 6 crypto sectors within a selected time period, such as each day, week, month or year, or from the beginning of the year for any of the last 4 years.
The sectors and tickers within each sector are as follows:
Layer 1: CRYPTOCAP:ETH CRYPTOCAP:SOL CRYPTOCAP:TON
Layer 2: SEED_DONKEYDAN_MARKET_CAP:MATIC TSX:MNT AMEX:ARB
CEX: CRYPTOCAP:BNB CRYPTOCAP:OKB NYSE:BGB
DEX: CRYPTOCAP:UNI LSE:JUP CRYPTOCAP:RUNE
AI: CRYPTOCAP:NEAR GETTEX:TAO CRYPTOCAP:ICP
Ethereum Memes: CRYPTOCAP:PEPE CRYPTOCAP:SHIB CRYPTOCAP:FLOKI
Traders can compare the relative performance of a custom ticker against the sector of their choice and view the average of all sectors.
The tool is fully customizable, allowing traders to enable or disable any of the features or sectors.
🔹 Dashboard
The tool also displays the data in an ascending or descending sector performance dashboard, allowing traders to see at a glance which sectors are overperforming or underperforming.
Other dashboard features include custom ticker vs. sector comparison and sectors average, and traders can choose the location and size of the dashboard.
🔶 SETTINGS
Period: View all data by time period, daily, weekly, etc. Or view data from last year, last 2 years, etc.
Relative Performance Against: Enable/Disable relative performance comparison against a sector.
Use chart ticker: Enable the use of the chart ticker or a custom ticker for relative performance comparison.
🔹 Dashboard
Show Dashboard: Enable / disable Dashboard display.
Order: Choose between ascending and descending order.
Position: Selection of dashboard location.
Size: Selection of dashboard size.
🔹 Style
Show Sectors Labels: Enable / disable sector labels
Layer 1: Enable / disable Layer 1 sector
Layer 2: Enable / disable Layer 2 sector
CEX: Enable / disable CEX sector
DEX: Enable / disable DEX sector
AI: Enable / disable AI sector
Ethereum Memes: Enable / disable Ethereum Memes sector
Average: Enable / disable sectors average display
Custom Ticker: Enable / disable custom ticker display

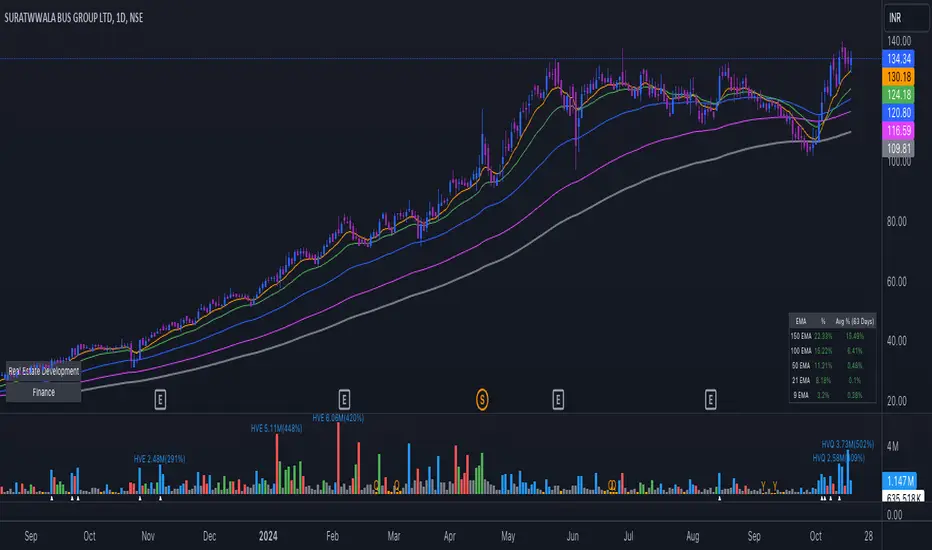
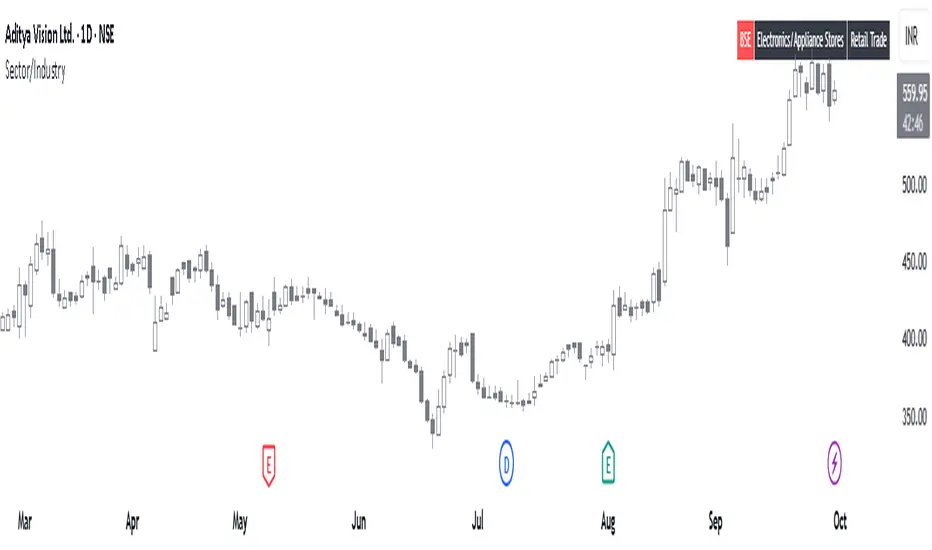
EMA Distance & Sector InfoThis indicator provides insights into price trends relative to Exponential Moving Averages (EMAs) and displays sector/industry information about the asset. Below is a detailed explanation of its purpose and what it is designed to achieve:
Purpose of the Code
The indicator offers two key functionalities:
1. Analyzing Price Distance from Multiple EMAs:
• Helps traders understand how far the current price is from key EMAs, expressed as a percentage.
• Calculates average percentage distances over a specified period (default: 63 days) to spot consistent trends or mean reversion opportunities.
• Useful for trend-following strategies, allowing the trader to see when the price is above or below important EMAs (e.g., 9, 21, 50, 100, and 150-period EMAs).
2. Displaying Asset Sector and Industry Information:
• Displays the sector and industry of the asset being analyzed (e.g., Technology, Consumer Goods).
• Provides additional context when evaluating performance across a specific sector or comparing an asset to its peers.
Who Would Use This Indicator?
This indicator is particularly helpful for:
1. Swing Traders and Positional Traders:
• They can use it to track whether the price is trading significantly above or below critical EMAs, which often signals overbought/oversold conditions or trend strength.
• The average percentage distances help to identify momentum shifts or pullback opportunities.
2. Sector/Industry-Focused Investors:
• Understanding an asset’s sector and industry helps investors gauge how the asset fits into the broader market context.
• This is valuable for sector rotation strategies, where investors shift funds between sectors based on performance trends.
How It Helps in Trading Decisions
1. Entry and Exit Points:
• If the price is far above an EMA (e.g., 21 EMA), it might indicate an overbought condition or a strong trend, while a negative percentage could signal a pullback or reversal opportunity.
• The average percentage distances smooth the fluctuations and reveal longer-term trends.
2. Contextual Information:
• Knowing the sector and industry is useful when analyzing trends. For example, if Technology stocks are doing well, and this asset belongs to that sector, it could indicate sector-wide momentum.
Summary of the Indicator’s Purpose
This code provides:
• EMA trend monitoring: Visualizes the price position relative to multiple EMAs and averages those distances for smoother insights.
• Sector and industry information: Adds valuable context for asset performance analysis.
• Decision-making support: Helps traders identify overbought/oversold levels and assess the asset within the broader market landscape.
In essence, this indicator is a multi-purpose tool that combines technical analysis (through EMA distances) with fundamental context (via sector/industry info), making it valuable for traders and investors aiming to time entries/exits or understand market behavior better.
[KF] Sector & Industry RemappingThis script remaps TradingView's sector and industry categories to standard classifications and displays them in the top-right corner of the chart making it easy to quickly identify a security's sector and industry. This tool is useful for traders and analysts who prefer standard industry classifications while using TradingView's charts.

Sector relative strength and correlation by KaschkoThis script provides a quick overview of the relative strength and correlation of the symbols in a sector by showing a line chart of the close prices on a percent scale with all symbols starting at zero at the left side of the chart. It allows a great deal of flexibility in the configuration of the sectors and symbols in it. The standard preset sectors cover the most important futures markets and their symbols.
However, up to ten sectors with up to ten symbols each can be freely configured. Each sector is defined by a single line that has the following format:
Sector name:Symbol suffix:List of comma separated symbols
For example, the first predefined sector is defined as follows.
Energies:1!:CL,HO,NG,RB
1. The name of the sector is "Energies"
2. The suffix is "1!", i.e., to each symbol in the list "1!" is appended to get the continous future for the given symbol root. When using stock, forex or other symbols, simply leave the suffix empty.
3. The list of comma separated symbols is "CL,HO,NG,RB", i.e. crude oil, heating oil, natural gas and gasoline. As the suffix is "1!", the actual symbols whose prices are shown are "CL1!","HO1!","NG1!" and "RB1!"
You can choose to use settlement-as-close and back-adjusted contracts. The sector can also be determined automatically ("Auto-select"). In this case, it is determined to which sector the symbol currently displayed in the main chart belongs and the script displays it in the context of the other symbols in the sector.
By selecting a suitable chart time frame and time range, you can quickly determine which symbols in the sector are stronger or weaker and which are more or less strongly correlated.
The following symbols are best suited for a quick trial, as the sectors are preset for these:
CL1!,ES1!,6A1!,6B1!,6c1!,6E1!,6J1!,6M1!,6N1!,6S1!,GC1!,GF1!,HE1!,HG1!,HO1!,LBR1!,LE1!,NG1!,NQ1!,PA1!,PL1!,RB1!,SI1!,YM1!,ZB1!,ZC1!,ZF1!,ZL1!,ZM1!,ZN1!,ZO1!,ZR1!,ZS1!,ZT1!,ZW1!,CC1!,CT1!,DX1!,KC1!,OJ1!,SB1!,RTY1!
You can also use the script to compare any symbols (e.g. different shares) with each other. Preferably use the "Custom" sector for this.

S&P Sector PerformanceS&P Sector Performance calculate and display the logarithmic returns of SPX and each S&P Sector for a predefined timeframe or for a custom date.

SFC Valuation Model - US SectorSector analysis is an assessment of the economic and financial condition and prospects of a given sector of the economy. Sector analysis serves to provide an investor with a judgment about how well companies in the sector are expected to perform. Sector analysis is typically employed by investors who specialize in a particular sector, or who use a top-down or sector rotation approach to investing.
Sector analysis is based on the premise that certain sectors perform better during different stages of the business cycle. The business cycle refers to the up and down changes in economic activity that occur in an economy over time. The business cycle consists of expansions, which are periods of economic growth, and contractions, which are periods of economic decline.
Investors who employ a top-down approach to sector analysis focus first on macroeconomic conditions in their search for companies that have the potential to outperform. They start by looking at those macroeconomic factors that have the biggest impact on the largest part of the population and the economy, such as unemployment rates, economic outputs, and inflation.
Every sector shows the average return from three ETFs - SPDR, Vanguard, iShares. There is a possibility to see the returns from every ETF by just holding the cursor on the sector name.
There are few valuation methods/steps
- Macroeconomics - analyse the current economic;
- Define how the sector is performing;
- Relative valuation method - compare few stocks and find the Outlier;
- Absolute valuation method historically- define how the stock performed in the past;
- Absolute valuation method - define how the stock is performed now and find the fair value;
- Technical analysis
How to use:
1. Once you have completed the initial evaluation step, simply load the indicator.
2. Analyse which sector is outperforming.
Sector Spaghetti [CE]Sector Spaghetti
An overlay indicator for multiple sectors that is configurable for multi asset configuration to track the returns of sectors in the market.
The tool provides three different viewing modes for returns; a rolling bar lookback, a specific data and time anchor, and a visible range.
Included is a pre built list of sectors created by none other than DaanCryptoTrades, the list includes a large range of sectors to cover the depth of the market as a whole.
Additionally a pre configured custom sectors list has been provided, we have included Daan's custom list within the custom sectors but provided the use of an additional feature "weight".
The weight feature is an intuitive method of applying importance to assets in there relevant sectors, we have used this as an opportunity to show the ability of creating market cap weighted sectors to balance the assets accordingly. This can provide useful in sectors where a low market cap + high beta asset could typically skew the results in one direction even if the remainder of the sector may be performing differently.
Non Market Cap:
Meme and Dex seem to be performing similarly
Market Cap:
Assets weighted via market cap shows relatively Meme sector is out performing
We have also added an optional table to the right of the screen so that the trader can clearly see outperforming assets. This table is toggleable using radio buttons within the Style menu. Updating the code we have provided users the ability to customize the table to further improve readability of the Text and reduce screen noise where needed.
To improve asset visibility, the script also calculates the 'long tail' of the list distribution and automatically lowers the visibility of clustered assets in the centre.
To Do
Alerts for sector performance

Upgraded WatermarkThis mimics the built in watermark feature, but adds the ability to change location as well as see an equities sector and industry group.
Sector/IndustryThis is a simple script that displays a symbol's sector and industry in a table at bottom right area of the chart.
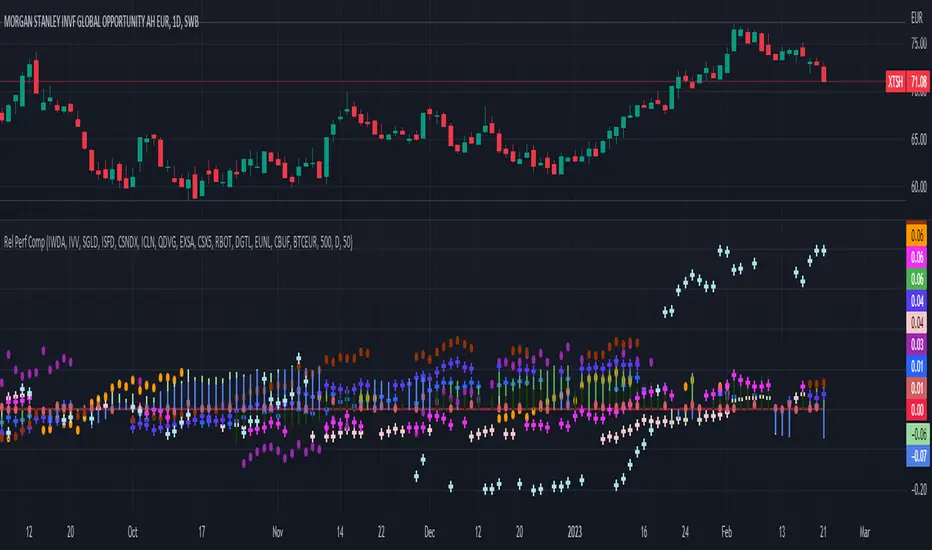
Relative Performance Comparison among different sectorsThis script shows how money is moving among different sectors using relative-strength of the corresponding sector-specific largest ETFs against MSCI World. Trend and current value of Relative-strength can be used to determine the sector in which you should make your investment at this point, considering the movement in markets.
Relative Strength/Weakness ArrowsHello everyone,
This Script is designed to show relative strength or relative weakness. It takes the stock your looking at and compares it to the sector it is in and to SPY. It evaluates strength or weakness on every candle. In this specific script it is only designed for the communications sector(XLC), so all the names I have inputted into the script fall within XLC. It works for all timeframes. It really helps me stay in trades longer as even though stock might be consolidating it can still be weak, making me more confident in holding. Each green arrow shows that the stock is relatively strong compared to SPY and its SECTOR, in this case, XLC. Each red arrow means that the stock is relatively weak to the market and its sector. When there are no arrows on the candles, then the stock is following the market and its sector. Tell me what yall think.
Just add it to your chart, go to any of the stocks within XLC and it will populate arrows based on relative strength and relative weakness. The weakness and strength is based on movement of price using ATR. So if the price of the stock is moving up and so is the sector it will only populate based on how large the move is. So if SPY had ATR of 1 and it moved up .50c that means the stock you're looking at would need to move more than .50c in the same candle if it also had an ATR or 1.
You can add or delete tickers in the code by going to the list of symbols and adding or removing them. Just remember that if you add a stock that doesn't fall within XLC then the arrows wont represent strength/weakness properly.

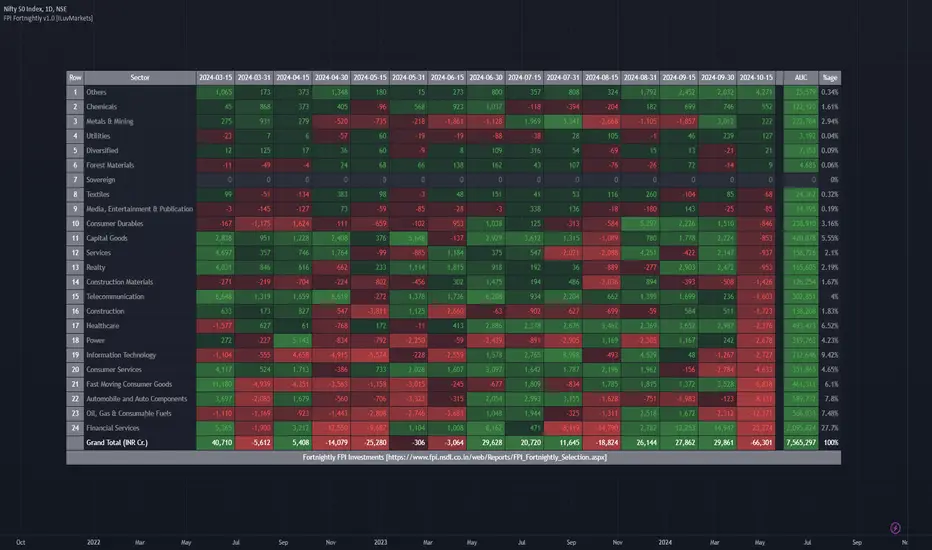
ILM India Sectors NSDL FII/FPI Investments FortnightlyThis indicator shows the FII/FPI fortnightly investments across various sectors for easy consumption.
This data is sourced from website
www.fpi.nsdl.co.in
This data gets published on a fortnightly basis.
This data is very difficult to interpret and not easy to consume.
This indicator makes this data very easy to consume and make good investment decisions by tagging along with Smart Money.
Since Trading View does not expose this data via QUANDL or any other means, the data is updated in the indicator itself.
Hence, indicator needs to be updated as soon as the new data is available on a fortnightly basis.
All the numbers are in INR Cr.
The date columns represent the investment value for that fortnight for the sector
AUC column represents the total Assets held by FPI in that sector
%age column represents the %age of Assets in the sector compared to Total FPI investment
Features Planned in future
- Drill down to Group-A stocks in the sector and show the performance of the stock (% Change, Volume, Delivery) fortnightly so specific stock can be identified
Send me a DM if you would like to see any additional features on this indicator
NSE Sector PerformanceUse this indicator on daily timeframe
This indicator shows the performance of the top NSE Sectors for 4 time periods.
User has the flexibility to define the time periods (ex. Yearly Monthly Quarterly Weekly Daily
indicator shows the performance of the sector for those time periods along with 250d High/Low and distance from the High/Low
User input is provided to drill down into performance of the top stocks in those sectors.

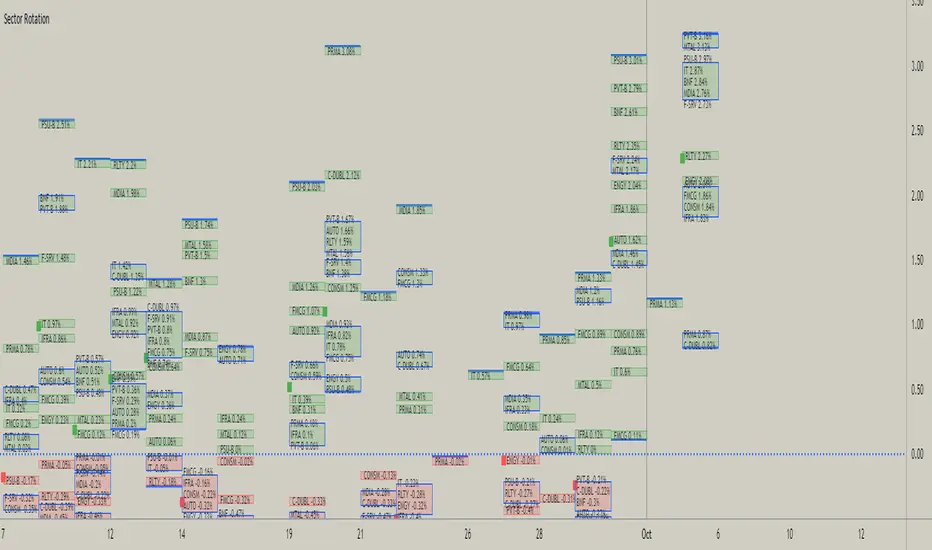
Sector RotationThis script is attempt to create and observe the real-time and historical performance of the all major sectors of Indian Market in one screen.
for Data Presentation I used Short sector names so that I can manage to get space and efficient presentable data.
Short Names and Actual Sector Names
BNF : CNX-BANKNIFTY
IT : CNX-IT
PRMA : CNX - PHARMA
FMCG : CNX-FMCG
AUTO : CNX-AUTO
MTAL : CNX-METAL
MDIA : CNX-MEDIA
RLTY : CNX-REALTY
IFRA : CNX-INFRA
ENGY : CNX-ENERGY
PSU-B : CNX-PSU-BANK
PVT-B : NIFTY-PVT-BANK
F-SRV : CNX-FINANCE
CONSM : CNX-CONSUMPTION
C-DUBL : NIFTY_CONSR_DURBL
You can use this script in 30-min, Daily, Weekly and Monthly Time Frames.
The green Square denotes the current Symbol Performance.
The Blue Border boxes are created when one sector intersects other sector.
In this Update following features are added
Now users have control over sectors, what are all the sectors you wanted to plot you can select from the input menu.
Currently user can highlight any one sector in different border color so that user can easily spot and track particular sector.
This thicker blue line denotes lowest and highest point of the current timeframe.
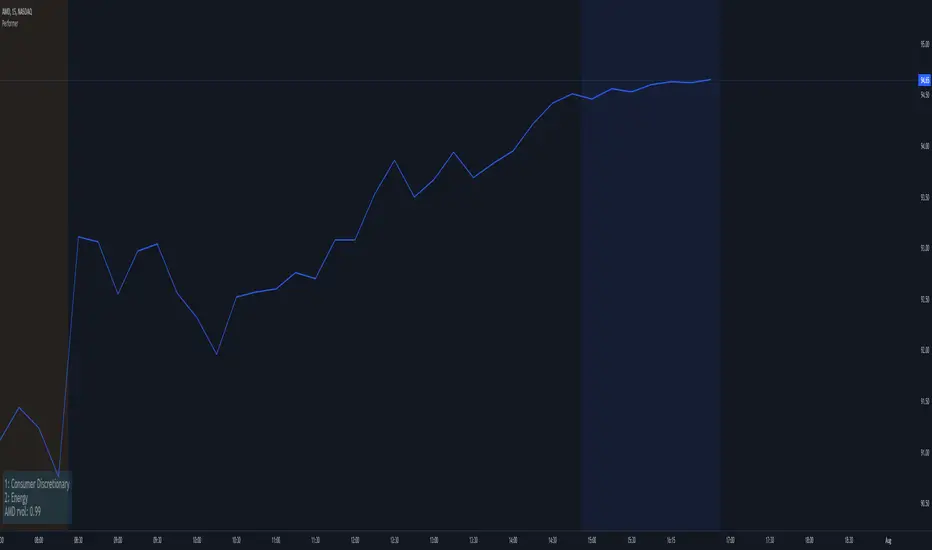
PerformerTired of spending time chasing down top performing sector(s) of the day? With this indicator, it automatically shows you the top two performing sectors for the market's open trading day. Why only two? This is because most people would rather focus their trading only the top one or two performing sector/stock(s) of the trading day and you really need only one good trade to make your money for the trading day. Also, why clutter up your chart with a big information window showing the entire list of sectors? This script is free for all to use and was designed to be non-cluttering for those who like to keep their charts clean. You can tuck this indicator in one of any of the 4 corners of your charting window for that clean look. This script features two things:
- Shows the top two performing sectors (the first 2 lines of the Information Window; there's no option to remove this, as this is the intention of having this indicator - if one of the sectors doesn't work out for you, there's usually another sector, so that's why we have the top 2)
- The last line (3rd line) shows the ticker symbol of the current stock/security you're looking at, along with the relative volume (this relative volume follows my own formula and will not match any other relative volume's found elsewhere - you can hide or show this from the settings menu)
What was removed from the original design?
Parts of this script contains the old original leftover code I disabled where the original idea was to also show you the top performing stock within the absolute top performing sector; however, I ran into a snag in getting this to work properly. I think it's a limitation issue, as well as preventing scripters from unintentionally causing a performance hit on the client and/or server side. Upon running into this issue, I then decided on, how about randomly showing a few tickers for the top performing sector, but also ran into an issue where I didn't like how it behaved. In any case, those who aren't new to the stock market should somewhat have many of these ticker symbols memorized, as well as know (or at least have an idea) a few ticker symbols in the various stock sectors. Again, this extra feature has been disabled and many parts of the original code cleaned up (or disabled) to reduce any unnecessary performance hits (for this published release). Even though this additional feature was removed/disabled from this public release, you can however, utilize the relative volume to help you figure out if the stock/security you're currently looking at is below, at or above the normal average volume. Typically, if you see a high relative volume in a particular stock/security, you know that there's a lot of trading activity with that stock/security for the day, so it's worth keeping that stock/security on your watchlist.
* Please note that this script is in its early beta stage and there could be bugs. This is being provided as is and the information provided by this script is meant for informational/entertainment purposes only. As always, please use proper due-diligence and not 100% relying on a single indicator for your trading.