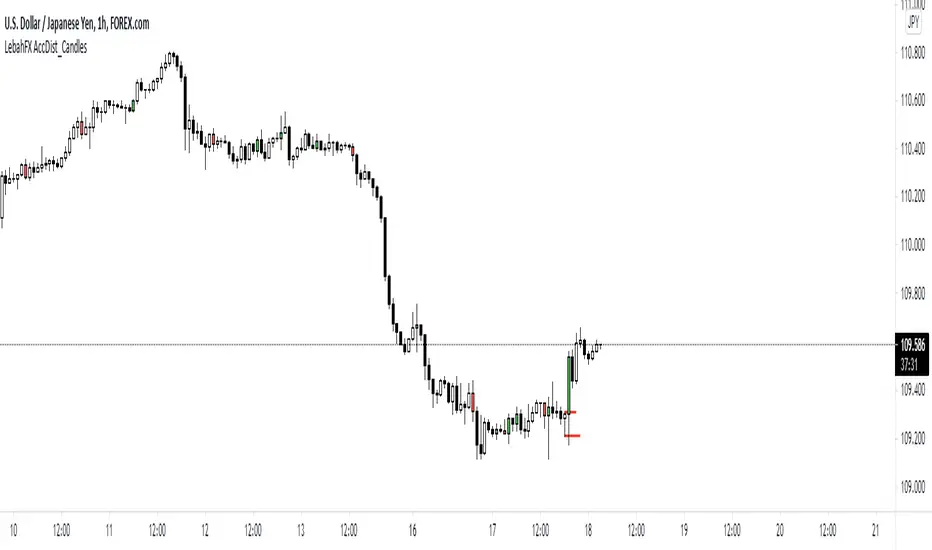
LebahFX AccDist_CandlesLebahFX Indicator that showing Accumulation and Distribution Signal in HTF CandlestickPenunjuk Pine Script®oleh lebahsaham6984
Scalp ProScalp Pro is a scalping tool that uses the MACD mechanism. MACD lines are smoothed using fibonacci numbers and pi numbers. In this way, the noise on the signal is reduced. A " BUY " signal is generated when the lines cross upwards. If the lines cross down, a " SELL " signal is generated. The logic is very simple and the Indicator is very useful. I wish you many profitable trades.Penunjuk Pine Script®oleh ovelixTelah dikemas kini 2323 7.1 K
MTF Technical Ratings [Anan]█ OVERVIEW This indicator is a modified version of "Technical Ratings" v5.0 available in the public library to provide a quick overview of Technical Ratings in 6 optional timeframes. █ FEATURES - Multi-timeframe Table. - Display Technical Ratings for "MAs" with a percentage. - Display Technical Ratings for "Oscillators" with a percentage. - Display Technical Ratings for "All" with a percentage. - Full control of displaying any row(MAs / Oscillators / All) or any column(Multi-timeframe) - Full control of Table position and size. - Full control of displaying any row or column. ORIGINAL DESCRIPTION ABOUT TECHNICAL RATING v1.0 █ OVERVIEW This indicator calculates TradingView's well-known "Strong Buy", "Buy", "Neutral", "Sell" or "Strong Sell" states using the aggregate biases of 26 different technical indicators. █ CALCULATIONS The indicator calculates the aggregate value of two groups of indicators: moving averages and oscillators. The "MAs" group is comprised of 15 different components: • Six Simple Moving Averages of periods 10, 20, 30, 50, 100 and 200 • Six Exponential Moving Averages of the same periods • A Hull Moving Average of period 9 • A Volume-weighed Moving Average of period 20 • Ichimoku The "Oscillators" group includes 11 components: • RSI • Stochastic • CCI • ADX • Awesome Oscillator • Momentum • MACD • Stochastic RSI • Wiliams %R • Bull Bear Power • Ultimate Oscillator The state of each group's components is evaluated to a +1/0/-1 value corresponding to its bull/neutral/bear bias. The resulting value for each of the two groups are then averaged to produce the overall value for the indicator, which oscillates between +1 and -1. The complete conditions used in the calculations are documented in the Help Center.Penunjuk Pine Script®oleh Mohamed3nanTelah dikemas kini 99606
Trend From Volume And Price (TFVAP)Indicator that indicates buying and selling times based on price and volume and who is imposed of the two (VAP). It uses the trends of the Dow theory (primary: 365 days/1 year, secondary: 90 days/3 months and tertiary: 21 days/3 weeks) and the identification of Elliot waves, both impulse and correction, based on the Fibonacci retracements (23.61% , 38.2%, etc.). - Purple line is the evolution in percentage of the price in the primary trend - Blue line is the evolution in percentage of the volume in the primary trend - White line is the evolution in percentage of the (volume % - price %) in the primary trend, if white line > 0 - Green triangleup is time of start to buy - Green square is time of stop to buy - Red triangledown is time of sell To understand it better: If the purple line goes up it indicates that the price is rising, if it goes down, that the price is down. If the blue line is greater than 0 it indicates that there are more purchases than sales, if the blue line is less than 0 it indicates that there are more sales than purchases. If the white line is greater than 0 there is a high volume of purchases or low sales for the price that there is, it is likely that the price will rise. If the white line is less than 0 there is a low volume of purchases or high sales for the price that there is, it is likely that the price will go down. PD: Ignore the chart drawings, the indicator script is only represented at the bottomPenunjuk Pine Script®oleh juandemilla17Telah dikemas kini 22267
PERCENTAGE BARS SAME DIRECTIONProbability of bars in the same direction based on historical data. Penunjuk Pine Script®oleh DreadblitzTelah dikemas kini 88 1 K
No-lose trading targets (based on RSI) By Mustafa ÖZVERThis code shows expected reaction target prices after sudden moving based on RSI. Red area means the price is on overbought area, green area means the price is on oversold area. If you see red area under price, you can make short option to next to the horizontal beginning price of red area. If you see green area over price, you can make long option to next to the horizontal beginning price of green area. When this code works - The green area starts where rsi value is on oversold - The red area starts where rsi value is on overbought Of course, this code may be failed, do not forget the target may never come. But hopefully price will cross over the target. And you (as developers) can develop this code by using anything instead of rsi to get up-down target prices. But only this values can not guarantee good results for trading. BE CAREFULPenunjuk Pine Script®oleh MustafaozverTelah dikemas kini 66323
Moving Average Buy/Sell IndicatorUsing a selected Exponential Moving Average (EMA)/Simple Moving Average (SMA) range, this indicator inserts a Long/Short (buy/sell) indicator overlaid on chart depending on the following conditions: - LONG/BUY SIGNAL = if SMA value is less than EMA, and both the SMA and EMA are less than the current average price. - SHORT/SELL SIGNAL = if SMA value is greater than EMA, and both the SMA and EMA are greater than the current average price. **Intended for use with the 21 and 34 weekly moving average time range. Much more useful for long-term analysis rather than short-term analysis.**Penunjuk Pine Script®oleh EightBallDuVal22514
SuperTrend Oscillator [LuxAlgo]This oscillator is made of three components, all derived from the SuperTrend indicator. This approach allows the user to easily determine overbought/sold zones, identify whether a retracement is present or if the price is ranging or trending. It also allows for the anticipation of the potential price cross with the SuperTrend. We provide additional information including whether a signal returned by the SuperTrend was false, as well as the percentage of false signals. Settings Length: Period of the "average true range" used in the calculation of the SuperTrend Mult: Multiplicative factor for the "average true range" Smooth: Determines the degree of smoothing of the histogram Misc: Fixed Transparency: Use a fixed transparency for the main oscillator Show Lines: Show the lines displayed by the indicator Show Labels: Show the labels displayed by the indicator Usage The indicator is in a range of (-100,100) with values closer to 100/-100 indicating a stronger trend. The main oscillator value above 0 indicates that the price is above the SuperTrend. It is possible to identify when a retracement is present in a trend. This is often indicated by an oscillator value moving within 50/-50. Each overbought/oversold level can be used to determine potential exit points. The indicator also includes two additional oscillators derived from the main oscillator. A smoothed version of the main oscillator (Signal), and a smoothed version of the difference between the Main and Signal oscillators (Histogram), thus making the oscillator part of the indicator more similar to MACD. One can use the histogram to anticipate when the price might cross the SuperTrend by comparing the sign between the main and histogram. Potential false signals can also be filtered with this method. Certain crosses between the price and SuperTrend can be filtered out when the histogram and main oscillator have a different sign (here main = 1, histogram = -1). We include various indications in order to analyze the signals returned by the SuperTrend. The indicator displays symbols indicating whether a signal was false or not. A cross symbol will be displayed at the top of the displayed lines when the previous Buy signal was false, else a checkmark is displayed. Symbols displayed at the bottom of the lines are referring to sell signals. We also provide a percentage of false signals, calculated over the entire chart history. Details The scaling method used is similar to max-min normalization. We first compute the difference between the price and SuperTrend and divide the result by the difference between the upper and lower extremity used to compute the SuperTrend. Values higher than (1,-1) can occur when price crosses the SuperTrend and as such we use the max and min functions to attenuate these. The filter used to compute the signal line is based on exponential averaging and is fully adaptive. The smoothing factor used for its computation is the squared value of the main oscillator, divided by length . Since higher values of the oscillator are associated with trending markets, the filter will be closer to the main oscillator when the market is ranging.Penunjuk Pine Script®oleh LuxAlgo4848 6.5 K
Angle Attack Follow Line Indicator This indicator works with Follow Line Indicator , evaluates the angle for possible additions or reductions of the position. Many settings to play with: s3.tradingview.com - FOLLOW LINE CURRENT CHART RESOLUTION - FOLLOW LINE HIGHER TIME FRAME - FILTER HIGHER TIME FRAME - NO FILTER HIGHER TIME FRAME - ANGLE CONFIGURATION - ANGLE LEVELS - BUY / SELL - OPTIONS TO ADD - OPTIONS TO REDUCE - BAR COLOR - LABELS -ALERTS MANAGE YOUR RISK AND CAPITAL WELL IF YOU DO NOT WANT TO LOSE EVERYTHING¡¡¡ TO PLAY¡¡¡ Penunjuk Pine Script®oleh Dreadblitz6464 7.1 K
Open-source Buy and Sell VolumeVersión open source de scripts anteriores / Open source version of previous scripts Confío en que esta vez no esté violando ninguna de las reglas... A pesar de que el volumen simplemente son operaciones que se realizan en un determinado espacio de tiempo, este indicador intenta separar dentro de una vela el volumen de compra y de venta. Una vez separado el volumen de cada vela el indicador se calcula en base a la media simple (larga) menos la media exponencial (corta) Los puntos azules indican posibles zonas de soporte o resistencia. ---------------------------------------------------------- Although the volume is simply operations carried out in a certain period of time, this indicator tries to separate the long and short volume into a candle. Once the volume of each candle is separated, the indicator is calculated based on the simple average (long length) minus the exponential average (short length) The blue dots indicate possible areas of support or resistance.Penunjuk Pine Script®oleh oarnal121
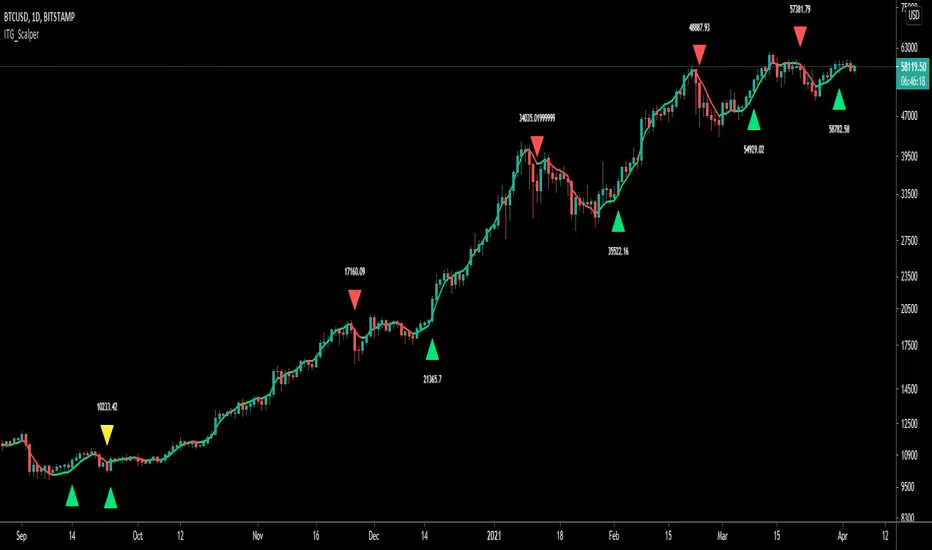
ITG ScalperITG Scalper by Complector. Inspired by Juboal-Rabaroansa Perosteck Alseyn Balveda dam T'seif Methology: - I am using a TEMA (triple EMA) to determine the local trend direction and to give buy & sell signals when the trend changes. - An optional filter, using moving average convergence divergence (MACD), can be switched on to filter out 'false' signals. - The calculation of the TEMA does not request data from a resolution higher or lower than the resolution of the main charts symbol, However, the filter function does, if another resolution is chosen for the filter. - Persistent variables are used for buy and sell prices, enabling color-coding of the sell-signal (profitable or not). Features: - Color coded TEMA - bullish=green , bearish=red - Buy/Sell indicator - Sell indicator: green=profit, yellow=loss - Optional noise filter - Optional variable time-frame for noise filter Remarks: In my experience, the default values works best on the daily time frame. I encourage everyone to experiment with the values for best results. Using the script on non-standard charts (Heikin Ashi, Renko etc.) can produce unrealistic results. Using a resolution higher or lower than the main charts symbol for the filter can possibly lead to repainting. Thanks to Iain M. Banks for making my life richer :-)Penunjuk Pine Script®oleh ComplectorTelah dikemas kini 9191 6.8 K
Rolling Cumulative VolumeThis indicator show a simple rolling cumulative volume. A field is specified. Then all last volume indicators are summed. For example it could calculate last 24h Volume if you use the 1h bars and set the length for 24. Penunjuk Pine Script®oleh i_hodlTelah dikemas kini 33124
MA200W buy sell BTC ColoredA script to help you plan your entrances and exits with beautiful colors for BTC. It just helps to better highlight the gap between the start of the week and the end. It only work on Weekly. Info : Blue ... you can wait, enjoy your life Green is when you buy Yellow when you enter bull market Orange is when you begin to take care of next week Red when you begin to sell low part White, if while a week you see white you can sell bigs bags, if it end with White you can close majors positions Warning White may not appear, if second week after first Red week is not White you can sell large position Good luck and take a breathPenunjuk Pine Script®oleh Bioubiou1818893
Precise_SignalThis signal combines a portion of Chris Moody's 2014 SlingShot and my 2017 MTF Indicators. Both of our prior scripts over indicated Buy and Sell Points. This signal indicates a buy or sell point much less than our prior scripts did but with absolute precision. I would say it is 100% accurate, but that is because I am yet to find a timeframe and symbol where the Buy signal failed to see the equity move up or the Sell signal failed to see the equity move down over the next 5 bars. I have tested 2000 charts so far. To be safe, I would rather state this indicator is accurate nearly 100% of the time. The indicator is made up of 2 main portions and both of them have to agree on a buy or sell in order to indicate such with a vertical green or maroon bar beneath the chart. If there is a failure to agree, nothing is signaled. Indicator 1 combines a stochastic of a 3 hour chart and a daily chart to determine when the stochastics are in agreement on direction. When there is agreement, both of them MUST cross from a buy state to a sell state and vice versa at exactly the same time. This is difficult to achieve and it is already rare for this occurrence to produce a signal. When a signal is produce it is combine with Chris Moody's 2014 SlingShot Indicator which conservatively determines Buy and Sell signals based on EMAs and market direction. Signals from his SlingShot are infrequent. BUY Signal When my MTF signals Buy at the same time that the SlingShot signals a Buy, a vertical green bar will appear in the window containing this script. The vertical bar is based on the close price of the equity and is only final when the close price is final. A BUY signal means the equity will move up potentially as early as the next bar and achieve a higher value from the close price on the signal bar. SELL Signal Likewise, a sell signal from the MTF at the same time as a sell signal from the SlingShot will create a maroon bar in the window containing this script. The vertical bar is based on the close price of the equity and is only final when the close price is final. A SELL signal means the equity will move down potentially as early as the next bar and achieve a lower value from the close price on the signal bar. The default values for this script are hard-coded into this script. You can edit any of the value you would like to play with other timeframes, stochastic, and moving average lengths. I have played with these values and have hard-coded the ones that are most accurate. Please let me know if you find others that work. Hopefully this becomes an extra tool in your technical trading toolkit.Penunjuk Pine Script®oleh StockSignaler1818878
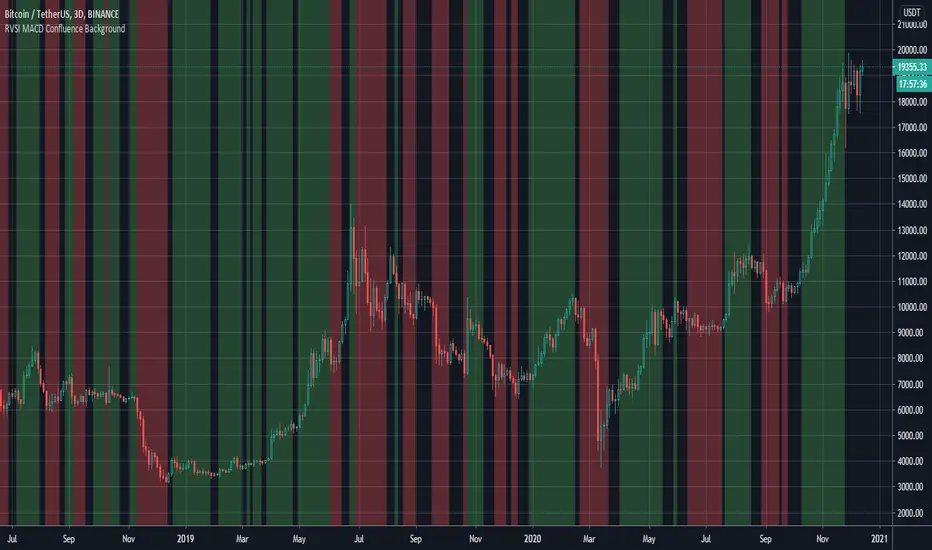
RVSI & MACD Confluence BackgroundThis indicator colors the background in vertical (green/red) stripes to indicate if the current trend is possibly bull / bear A region where the background is not colored indicates that the present trend can not be identified The algo combines the RVSI (Relative Volume Strength Index {ref fract} ) and the MACD The Relative Volume Strength Index has been adapted to include 2 moving averages, one fast and one slow This same fast slow lookback length is applied to the MACD for simplicity What's interesting is that there is a very strong confluence between the MACD and RVSI, as the MACD is obtained from 'price action only' and the RVSI from the 'volume only' So a break in confluence of these two might suggest that the current trend is weakening in confidence or can not be clearly identified Generally, a green background means consider going long ie price trend is rising A red background means consider going short ie price trend is falling An absent background color means - consider exiting current trade or wait to get into a new trade Best Regards, MoonFlag - and a special thanks/mention to 'fract' for the RVSI algo this is derived fromPenunjuk Pine Script®oleh MoonFlag11215
Trend Trader Buy/Sell SignalsTrend Trader The code is open source, what it uses to print signals is MACD cross and ADX. Bar colors change in relation to where price is according to the 50 day MA. The MA ribbon is used for visualizing trend and using it for dynamic support/resistance. The ribbon is comprised of the 50 day and 100 day MAs. Main reason to publish this script is because some like to jumble up scripts together slap some moving averages on it to "follow trend" and then label it an algorithm, market it and sell it to people online. No single system will work 100% of the time, do you due diligence in anything you are interested in buying. Plenty of free scripts in the TV library that can do you justice when trading. Penunjuk Pine Script®oleh UnknownUnicorn1946597Telah dikemas kini 2020 3.2 K
Escaping of Rate from Avarage By Mustafa OZVEREscaping of Rate from Average By Mustafa OZVER This code shows a location of a rate or price (or etc.) from the average, rated by the standard deviation. To show that, calculates the ema and standard deviation of our data then calculates the distance between ema and the current data by the standard deviation. In summary, we can say that this value is the current distance by the long term standard deviation. This value is between +1 and -1 because we expect the absolute value of the standard distance does not get far from the long term standard deviation. For scalping, we can use this value as buy signal when the value is below -1, sell signal when the value is above +1, But only this value can not guarantee good results for trading. BE CAREFUL Penunjuk Pine Script®oleh Mustafaozver66115
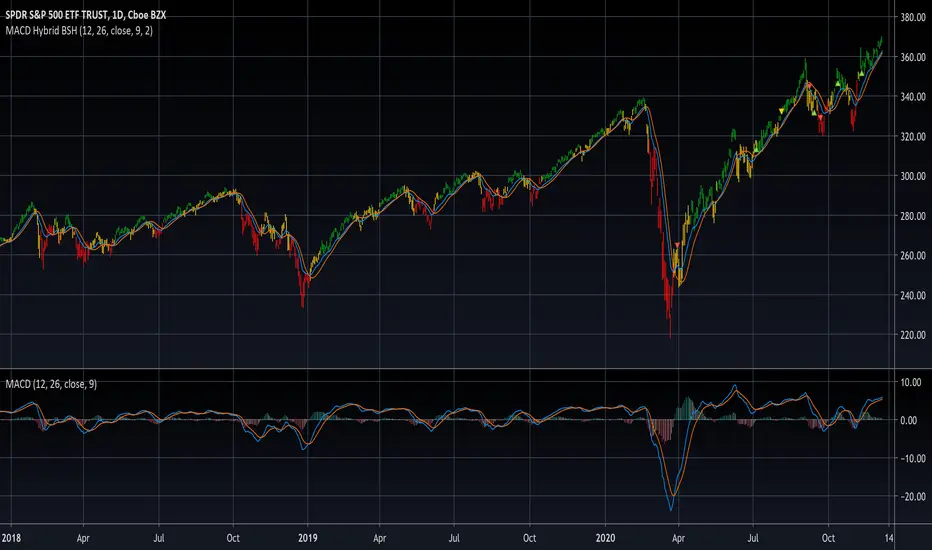
MACD Hybrid BSHMACD = Moving Average Convergence and Divergence Hybrid = Combining the two main MACD signals into one indicator BSH = Buy Sell Hold This indicator looks for a crossover of the MACD moving averages (12ema and 26ema) in order to generate a buy/sell signal and a crossover of the MACD line (12ema minus 26ema) and MACD signal line (9ema of MACD line) in order to generate a completely seperate buy/sell signal. The two buy/sell signals are combined into a hybrid buy/sell/hold indicator which looks for one, neither, or both signals to be "buys." If both signals are buys (fast crossed above slow), a "buy" signal is given (green bar color). If only one signal is a buy, a "hold" signal is given (yellow bar color). If neither signal is a buy, a "sell" signal is given (red bar color). Note: MACD moving averages crossing over is the same thing as the MACD line crossing the zero level in the MACD indicator. It makes sense to have the MACD indicator loaded as a reference when using this but it isn't required. The lines plotted on the chart are the 12ema and a signal line which is the MACD signal line shown relative to the 12ema rather than the MACD line. The 26ema is not plotted on the chart because the chart becomes cluttered, plus the moving averages crossing over is indicated with the MACD indicator. This indicator should be used with other indicators such as ATR (1), RSI (14), Bollinger bands (20, 2), etc. in order to determine the best course of action when a signal is given. One way to use this as a strict system is to take a neutral cash position when a yellow "hold" signal is given, to go long when a green "buy" signal is given, and to go short when a red "sell" signal is given. It can be observed that for many tickers and timeframes that green-yellow-green and red-yellow-red sequences are stronger signals than green-yellow-red and red-yellow-green signals. Note: Chart type must be "bars" in order for the bar colorization to work properlyPenunjuk Pine Script®oleh Skipper8655285
ATR SL Buy/Sell w/ SMAsFirstly I'd like to state that this script's ATR buy/sell source is from the public script library here: Additionally with the buy/sell signals from the original script, two more buy/sell conditions were added to give more entries/scaling in or out options. On top of that, two SMA lines were added, a 1 day moving average and a 5 day moving average. This script is more so designed for scalping/scaling in and out of positions already made. The SMAs add a level of confidence to the entry order, buy/sell triggers are not based on these SMAs. For the confirmation on the entry, ideally you want a bullish cross on the SMAs, as well as the color of the SMA to correlate to the buy/sell color. Penunjuk Pine Script®oleh UnknownUnicorn194659711969
RSI Chart Bars 8 55 45Dear Traders This RSI 8 period made for perfect entry for Long and Short for Intraday/Scalping in any time frame, when RSI 8 crossed above 55 the Candle charged to White then you can go for Long/Buy and when crossed below 45 the Candle changed to Yellow so you can go for Short/Sell, it working in any time frame. Thanks & Regards NesanPenunjuk Pine Script®oleh Nesan3633193
CCI & EMA_CROSS_PaydarCCI & EMA_CROSS_Paydar Hello everyone This indicator is actually a very efficient oscillator, This system is a unique combination of indicators CCI and EMA, which of course has special settings, these settings are adjusted as much as possible due to signaling. As you can see in the picture: CCI: the two colors line, green and red, are actually the same indicator CCI that I set to 20. *Note that in index CCI I have set the lines +100 and -100 to +75 and -75 for less error and a stronger signal to sell or buy. EMA: The white line, which is in the form of steps, is in fact the same indicator of EMA, which I have considered as a value of 9. _________________________________________________________________________________________________________ Instructions -> areas: Zone +75 to +200 = positive range or incremental price or bullish Zone +75 to -75 = Neutral range or almost constant price (no fluctuations or very wet fluctuations) Zone -75 to -200 = single range or discount price or bearish ->How to use: Buy = In the bearish range, if line CCI intersects line EMA upwards and goes to the neutral zone. None = if the index (or index lines) collide in the neutral zone Sell = In the bullish range, if line CCI intersects line EMA down and goes to the neutral zone. -> Please comment on this system or if you have a good experience in changing the values of the indicators or it seems to you, please share. With great respect to: Who had published the main idea of this system. Penunjuk Pine Script®oleh Paydar1313 1 K
Pink panther It is a simple indicator, you can use it with all time frames. So the pink line present the last high potential area that price try to breakout , and to use it you must consider three main things : 1- price on your time frame above Ichimoku cloud. 2- RSI above 50. 3- MACD crossover. how to execute your order? when price break the pink line and close 1 minute candle . Penunjuk Pine Script®oleh M3zee72
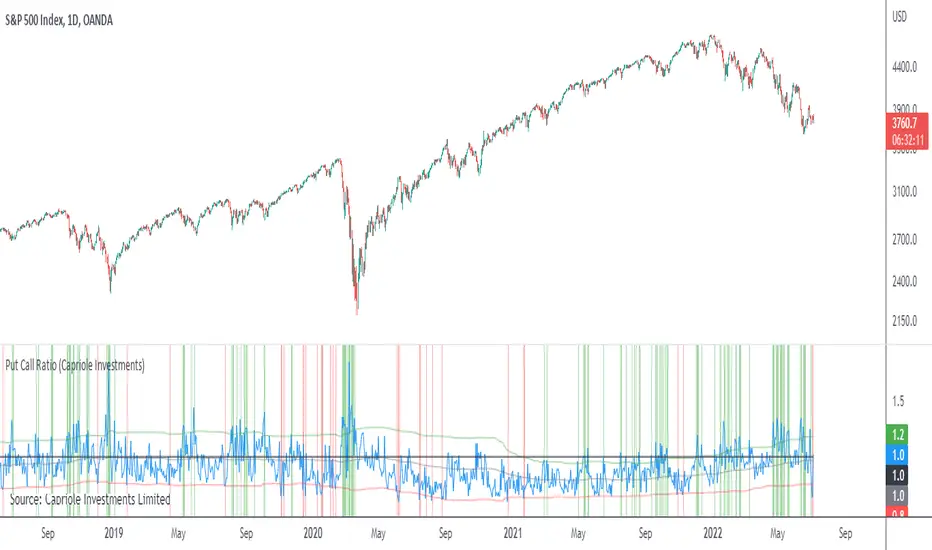
Put Call RatioPlots the CBOE Put Call Ratio and marks up locations of extremities. Useful as a factor of confluence in identifying extremities in the market.Penunjuk Pine Script®oleh capriole_charlesTelah dikemas kini 1414 2.6 K