Sellsignal
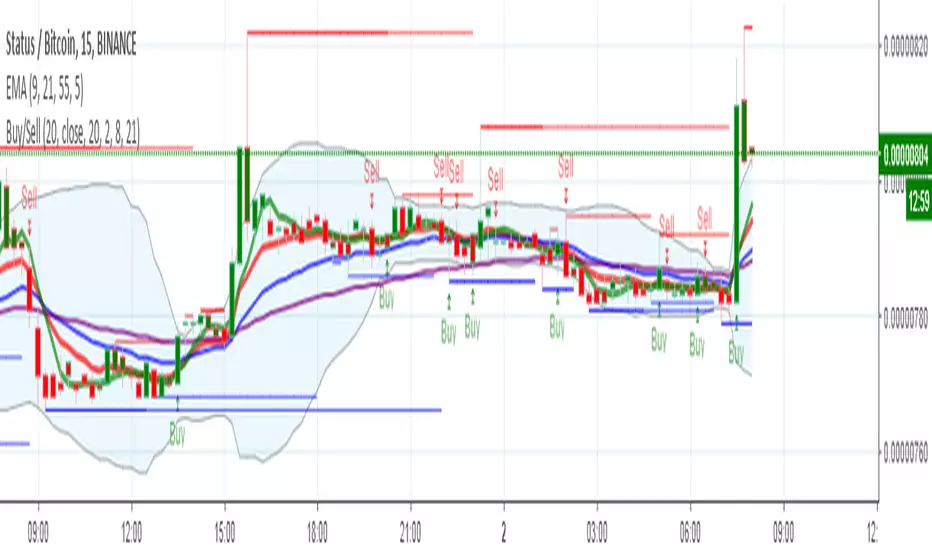
Buy&Sell Bitmex StrategyConfigured algo into TradingView through a Python upgrade 2.0.
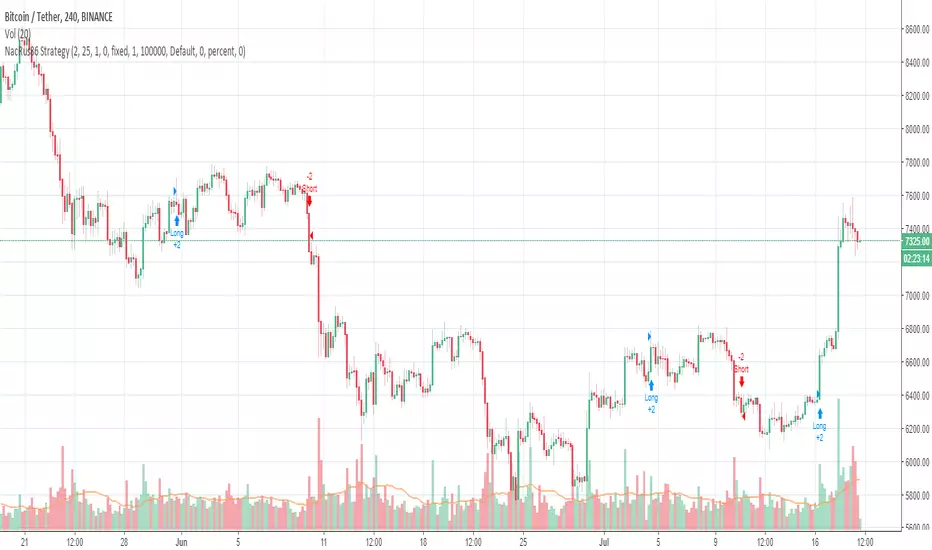
A scalper/swingtrader indicator on the following timeframes:
- 1H
- 4H
RSI/MFI - MTF - Entry signals/Trend colored bars - JD@version=2
This indicator is designed to give early entry signals as well as to follow trend moves, according to different settings.
The indicator shows a histogram of the RSI ro MFI in relation to an ema of the RSI or MFI.
The histogram is then smoothed to give early reversal/entry signals.
The actual RSI/MFI line with oversold/overbought indication can be displayed or omitted, as preferred.
in addition to the RSI/MFI line or as an alternative to it, the background colour can be set to change folowing the RSI/MFI signals.
The timeframe can be chosen. Higher timeframes (eg. 3h) tend to give less false signals.
version 5.
added support for custom Multiple Time Frame selection.
added option for choice of RSI or MFI as base indicator.
added option for price bar coloring according to the indicator. (deselecting "borders" in the "style" tab is recommended)
price bar coloring can be adjusted for different strategies:
1. following the slope of the histogram (for faster entry/exit signals)
2. according to positive or negative histogram (for longer moves)
3. according to pos. or neg. RSI/MFI (for longer term trend holds)
4. uptrend: biased towards faster buy signals and slower sell signals to stay in the uptrend
5. downtrend: biased towards faster sell signals and slower buy signals to stay in the downtrend
A longer timeframe (eg. 3x) is recommended for following trend moves.
try different strategies to see what works better for RSI or MFI.
JD.

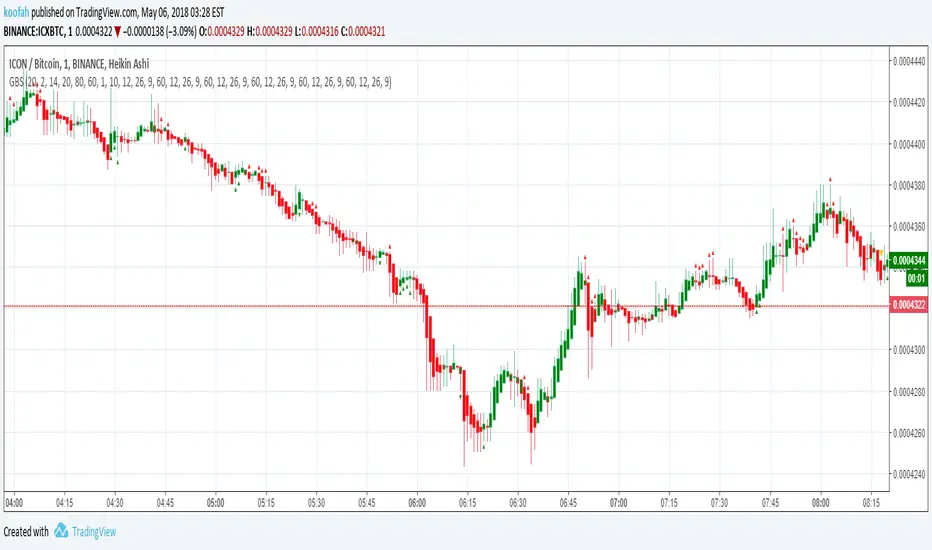
CryptogramTR with OPEN CODEIndicator is obtained by importing RSI(14) into HULL moving average source with 2 different periods, as one is long period and the other is short.
When green line (short period) cross upward the red line (long period) , this is a BUY; vice versa it is a SELL.
When HMA Short Period is set to 1 (one), yielding line is absolutely the same line of RSI (14). You can change it into 8(eight) preferably.
İndikatör, RSI(14) indikatörünün, hull hareketli ortalamasının kod kaynağı olarak atanması ile elde edilmiştir. Uzun ve kısa olmak üzere 2 ayrı periyot kullanılmıştır.
Yeşil çizgi yani kısa periyotlu çizgi, kırmızı yani uzun periyotlu olanı yukarı keserse AL, tersi durum SAT olarak düşünülmelidir.
Hull Kısa Periyodu 1 iken oluşan yeşil çizgi, RSI(14) indikatörünü vermektedir. Kısa periyot olarak tercihinize göre bu değeri 8 olarak da kullanabilirsiniz.

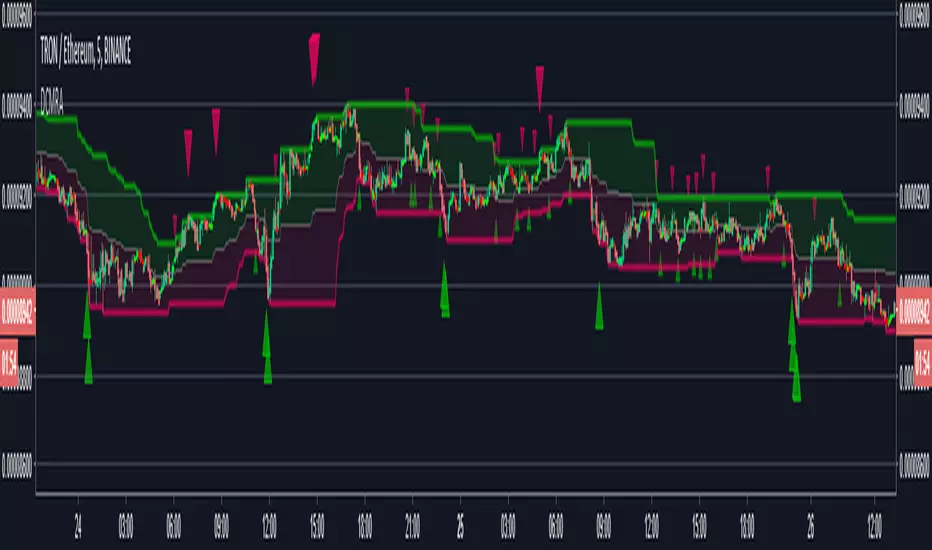
Donchian Mean Reversion AlertsDonchian Channels mean reversion signals/alerts with RSI filtering with signals applied to the mean, for strong trend situations.
Original Author: ChrisMoody
Modified Donchonian Channel with separate adjustments for upper and lower levels
Purpose is if you expect big move up, Use lower input example 3 or 4, and longer lower input, 40 - 100 and use lower input line as a stop out
Opposite if you expect big move down
Mid Line Rule in Long Example. If lower line is below entry take partial profits at Mid Line and move stop to Break even.
If Lower line moves above entry price before price retraces to midline use Lower line as Stop...Opposite if Shorting
Created by user ChrisMoody 1-30-2014
Updated 7-11-2018 by Dysrupt
Revamped for mean reversion strategy
Created midline alerts for strong trending upside buy signals/downside sell signals.
Added RSI Filtering
Added Alerts
Removed bar color change
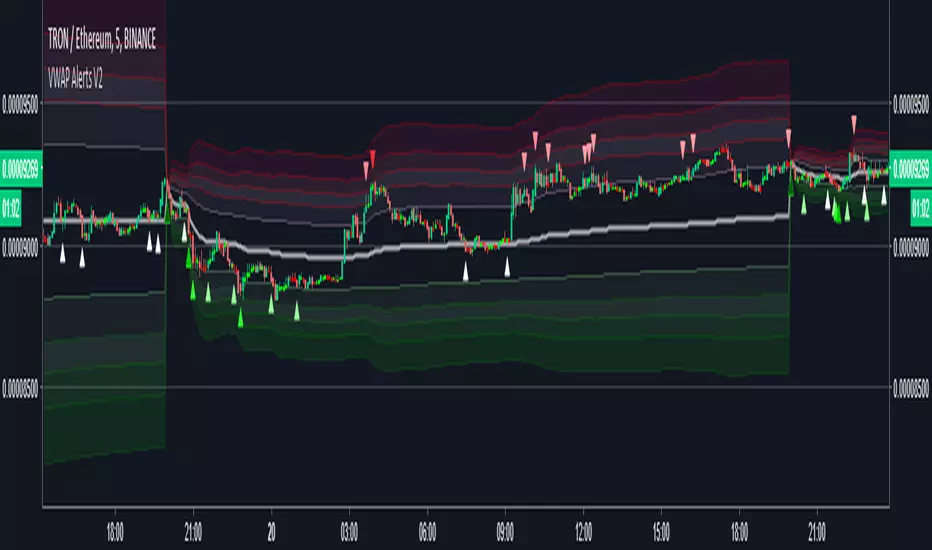
VWAP Alerts V2Alerts added to "VWAP Stdev Bands v2" by SandroTurriate
Changes
-Adjusted trigger conditions for higher signal sensitivity
-Color change on bands and signals for better readability and ease on the eyes
-Alerts added for up to 4 deviations up and down
-Re-enabled deviations 4 and 5
-Re-enabled previous close
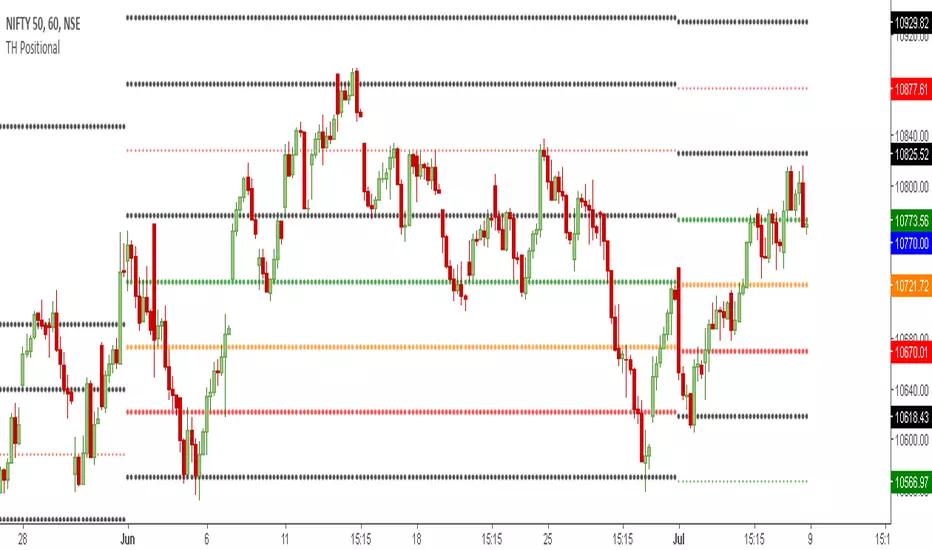
TH Positional | Buy & Sell Levels Monthly ViewTradersHunt's Positional Indicator is designed for Intraday or Monthly Positional Trading for Indian Market but it can also be used for Global Markets and Commodities . It is based on Support & Resistance Levels as per Historical Data.
The details are as follows;
Orange line is Trendsetter which means price closing above or below it will take the instrument in that direction. Green Level indicates strong buy price, and Orange level can be used as SL if trader is taking long position. Basically, a trader can use these levels as best Support and Resistance levels based on the ORB selected.
visit our website www.tradershunt.com for more information.
TH Trend | Trend Levels for the WeekTradersHunt's Trend Indicator is designed for Intraday or Weekly Positional Trading for Indian Market but it can also be used for Global Markets and Commodities . It is based on Support & Resistance Levels as per Historical Data.
The details are as follows;
Orange line is Trendsetter which means price closing above or below it will take the instrument in that direction. Green Level indicates strong buy price, and Orange level can be used as SL if trader is taking long position. Basically, a trader can use these levels as best Support and Resistance levels based on the ORB selected.
visit our website www.tradershunt.com for more information.

TH ORB | Buy & Sell Levels Based on ORBTradersHunt's ORB Indicator is designed for Intraday Trading for Indian Market but it can also be used for Global Markets and Commodities . It is based on Support & Resistance Levels based on Opening Range Technique. User can select different ORB ranges like 1min, 10min, 15/30/45min, 1/2/3 HOUR etc.
The details are as follows;
Orange line is Trendsetter which means price closing above or below it will take the instrument in that direction. Green Level indicates strong buy price, and Orange level can be used as SL if trader is taking long position. Basically, a trader can use these levels as best Support and Resistance levels based on the ORB selected.
visit our website www.tradershunt.com for more information.

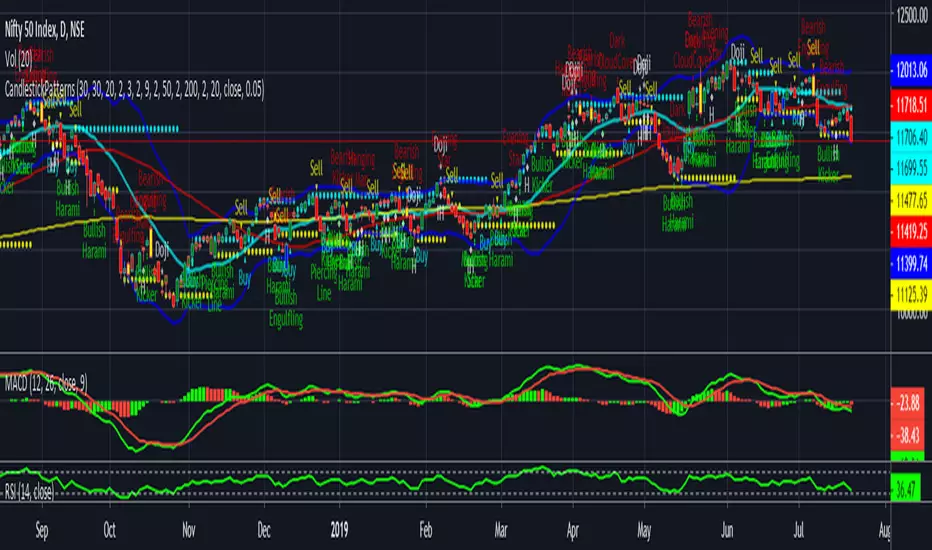
CandlestickPatternsIf moving average SMA (green line) crosses above SMA (red line) is uptrend , stock price will move up gradually. If suppose moving average SMA (green line) crosses below SMA (red line) is downtrend, stock price will move down. Also please validate with MACD & RSI for reference will get more clarification.
The default script have:
1) Bollinger Bands
2) Moving Average
3) Buy & Sell Signals
4) Engulfing patterns (like Doji , Bearish Harami, Bullish Harami, Bearish Engulfing , Bullish Engulfing , Piercing Line, Bullish Belt, Bullish Kicker, and Bearish Kicker)
The Piercing Line, Bullish Belt, and the Kickers will usually show up better in the daily charts.
Cryptosniper2ENGLISH:
Cryptosniper2
It is a creator indicator of Cryptofxsignals - Product of Paybit S.A.S
Which has an opportunity to buy or sell in multiple markets used for the market of cryptocurrencies.
This indicator has combined buy / sell signals of support and resistance
Characteristics of the indicator
Crosses of Moving Averages - Cryptofxma - Mobile media crossing 20,50,100,200
Measure price histories to automatically calculate supports and resistances, calculating the highs and porces, weeks and monthly
Calculate the RSI levels
Calculate Macd crosses
If the price candle breaks the support or resistance to the upside and all the conditions a purchase signal is marked
If the price candle breaks the resistance or support to the downside and all the conditions a sale signal is marked
Español:
Cryptosniper2
Es un indicador creador de Cryptofxsignals - Producto de Paybit S.A.S
El cual tiene una oportunidad de comprar o vender en multiples mercados usados para el mercado de las criptomonedas.
Este indicador tiene señales de compra / venta combinadas de soporte y resistencia
Caracteristicas del indicador
Cruces de Medias Móviles - Cryptofxma - Cruce de medios moviles 20,50,100,200
Mide historicos de precios para calcular automaticamente soportes y resistencias, calculando los altos y porcias, semanas y mensuales
Calcula los niveles RSI
Calcula cruces de Macd
Si la vela de precio rompe el soporte o resistencia a la alza y todas las condiciones se marca una señal de compra
Si la vela de precio rompe la resistencia o soporte a la baja y todas las condiciones se marca una señal de venta

Moving Averages DifferenceSimple indicator for crossing moving averages to identify trend and adjust bias
TPA BTC INDEX COLOR only for BTC/Legal currency, 4H(240min)TPA BTC INDEX COLOR only for BTC/Legal currency, 4H(240min)
또땃 비트 인덱스컬러 (BTCUSD나 KRW용)
Because we use Google Translator, translation may not be smooth.
------------------------------------------------
1.단기존 (Short term zone)
라임색에 줍고 주황~빨간색에 턴다.
빨강->라임 또는 라임->빨강 손에서는 주의한다.
알트존이 초록불일때는 단기존이 초록일때 줍지만 알트존이 붉은색으로 변하면 빨리 털거나 단기존이 주황~빨강쯤 왔을때 턴다
Pick it up in lime and sell it in orange to red.
Be careful in the red - > lime or lime - > red section.
When alt zone is a green light, pick it up when it is green. When Alt Zone turns red, it sells quickly or when it comes to orange or red.
------------------------------------------------
2.알트존 (Alt zone)
알트코인 투자시 급락 가능성이 적고 상방추세를 탔을때 투자를하기 위해서는 알트존이 초록불일때 투자를 하면 된다.
There is little possibility of a sharp drop in investment when investing in alt coins, and investment can be made when Alt Zone is green.
------------------------------------------------
3.계절 존(Season zone)
계절존이 초록색(여름)이면 향후 상방을 향해 갈 확률이 높은 상황이다.
적색이면 하락할 확률이 전체적으로 높다.방어적 투자할것
If the zone is green (summer), chances are high that it will move upward.
There is a high overall probability of falling in red.We need defensive investment.
------------------------------------------------
4.광기장 고점파악용(Madness zone)
광기장 판단은 장기존이 붉은색인체로 지속될때 광기장으로 명한다. 해당 구간은 급격한상승 하락이 있으므로(퍼센티지상)
4번라인의 색이 붉게 되면 매도한다. 옅은 주황이나 연두에 줍고 해당라인이 붉게된 근처에서 설거지 파동에 매도를 하면 된다.
The decision to determine whether " Madness Zone " is to be made by longtermzone as the continuation of red. Because of the sharp decline in the corresponding section, sell the fourth line when it turns red. You can pick it up in light orange or green tea and sell it on last waves near the line.
------------------------------------------------
5.장기존(long term zone)
저점매수하기 좋은 라인은 초록색으로 매도가 인접하면 붉은색으로 표기된다.
A good line to buy a low point is green, and if a sell is adjacent, it is marked red.
------------------------------------------------
Only for BTC/ Chart(4h, 240min)
알트존,계절존 모두 녹색인 구간에서 투자하는게 가장 안전하다.
계절존이 붉은데 알트존이 초록이라면 보험용 금액을 만들어라.
계절존이 초록인데 알트존이 붉은 색 이라면 단기존이 초록일때 주워라.
It is safest to invest in green zone, alt zone and season zone.
If the season zone is red and the alt zone is green, make an insurance premium.
If the season zone is green and the alt zone is red, pick it up when the original is green.
------------------------------------------------
업그레이드 예정:
색 변경시 알람 컨디션.
알트코인 차트를 켜도 TPA BTC INDEX COLOR 를 사용할수 있게 하는 기능.
Upcoming upgrade:
Alarm condition when color change.
Ability to use TPA BTC INDEX COLOR even when turning on an Altcoin chart.

RSI-MTF-Histo-EntryThis indicator gives a histogram of RSI in relation to an ema of the RSI.
The histogram is then smoothed to reduce false signals.
The actualiteit RSI line with overbought/overvols signals can be added or omitted as preferred.
The background can be color coded if the RSI is above or below 50.
Version 2. Added support for MTF. Longer timesframes (1h-3h) tend to give better entry results.
As an example the indicator was added two times, one for the current timeframe and one for a longer timeframe.


Trend Continuation FactorTrend Continuation Factor indicator script.
This indicator was originally developed by M.H. Pee (Stocks & Commodities V. 20:3 (58-64): Trend Continuation Factor).

RSI-Histo-Entry_JDThis indicator shows a histogram of the RSI in relation to an ema of the RSI.
The histogram is then smoothed to give early reversal/entry signals.
The actual RSI line with oversold/overbought indication can be displayed or omitted, as preferred.
In addiction to the RSI line or as an alternative to it, the background colour can be set to change folowing the RSI signals.
JD.

VJ_Volume_Longs_Shorts_IndicatorThe indicator is based on the real-time volume in the market, Macd and Bollinger Band.
Green Bars in the histogram indicate high buy volume and prospective long position
Gray Bars indicate low volume and no trade zone
Red Bars indicate high sell volume and prospective short position
Best used with Bitcoin.
Could use this indicator along with your favorite indicator to get to know the direction of the market with respect to volume and since this is a script, you can set alerts too.
Happy Trading

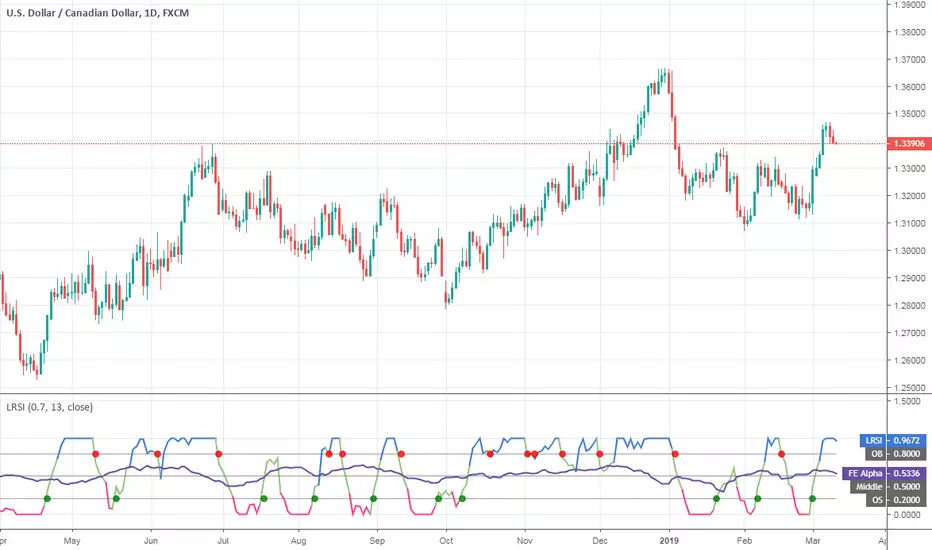
Laguerre RSI (Self Adjusting Alpha with Fractals Energy)Laguerre RSI (Self Adjusting Alpha with Fractals Energy) indicator script. I adopted idea from www.prorealcode.com and
If you disable `Apply Fractals Energy` option, you will get the original Laguerre RSI.
SMMA Analyses - Buy / Sell signals and close position signals This script combines the usage of the SMMA indicator in order to provide signals for opening and closing trades, either buy or sell signals.
It uses two SMMA , a fast and a slow one, both configurable by the users.
The trigger of Buy and Sell Signals are calculated through the SMMA crosses:
Buy Signals : The fast SMMA crosses over the slow SMMA . They are highlighting by a green area and a "B" label.
Sell Signals : The fast SMMA crosses under the slow SMMA . They are highlighting by a red area and a "S" label
The trigger of Close Buy and Close Sell Signals are calculated through the close price crosses with the fast SMMA:
Close Buy Signals : The fast SMMA crosses under the close price and at the same time the trend is bullish , so the fast SMMA is greater than the slow SMMA . They are highlighted by a lighter green area
Close Sell Signals : The fast SMMA crosses over the close price and at the same time the trend is bearish , so the fast SMMA is lower than the slow SMMA . They are highlighted by a lighter red area
Few important points about the indicator and the produced signals :
This is not intended to be a strategy, but an indicator for analyzing the SMMA conditions. It gives you the triggers depending on the real time analysis of the SMMA and prices, but not being a proper strategy, pay attention about "fake signals" and add always a visual analysis to the provided signals
Following this indicator, the trade positions should be opened only when a cross happens. Either in this case, analyse the chart in order to see if the signals are a "weak" ones, due to "waves" around the SMMA . In these cases, you might wait for the next confirmation signals after the waves, when the trend will be better defined
The close trade signals are provided in order to help to understand when you should close the buy or sell trades. Even in this case, always add a visual analysis to the signals, and pay attention to the support/resistance areas. Sometimes, you can have the close signals in correspondence to support/resistance areas: in these cases wait for the definition of the trend and eventually for the next close trade signals if they will be better defined

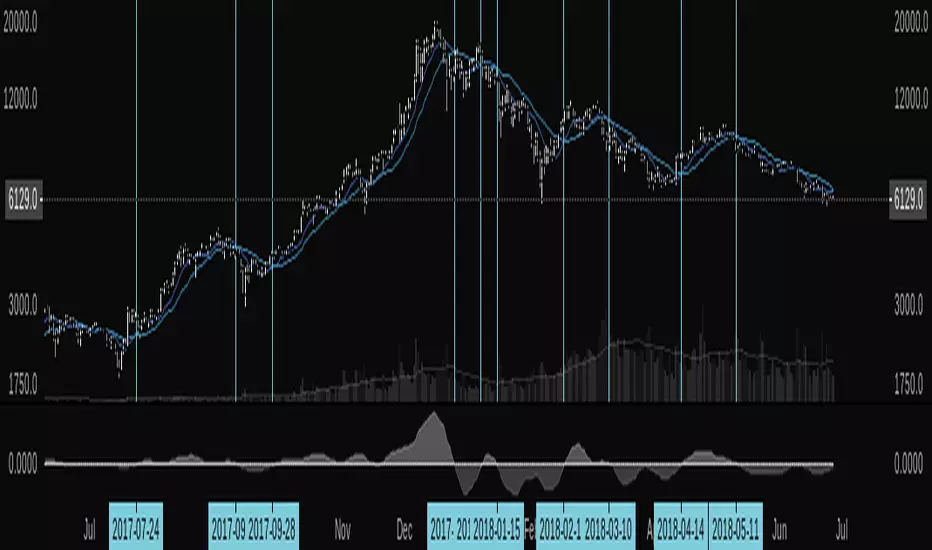
Buy and Sell signals using StochasticSimple Buy and Sell signals using Stochastic with the ability to further change backtest's start and end date.
