Gold vs. Dollar Sentiment Map [SB1]🟡 Gold vs Dollar Sentiment Map
The Gold vs Dollar Sentiment Map reveals the direct inverse relationship between Gold Futures (GC) and the U.S. Dollar Index (DXY) — one of the most reliable global risk-sentiment gauges.
It helps traders instantly identify whether capital is flowing into safety (Gold) or into the Dollar (risk assets) during any session or timeframe.
🔍 Core Logic
Risk-Off (Bearish background = Red): DXY ↓ and Gold ↑ → investors seeking safety, rising fear or falling yields.
Risk-On (Bullish background = Green): DXY ↑ and Gold ↓ → investors rotating into risk assets, stronger USD demand.
Neutral (Gray): Mixed signals – no dominant macro driver.
📊 Dashboard
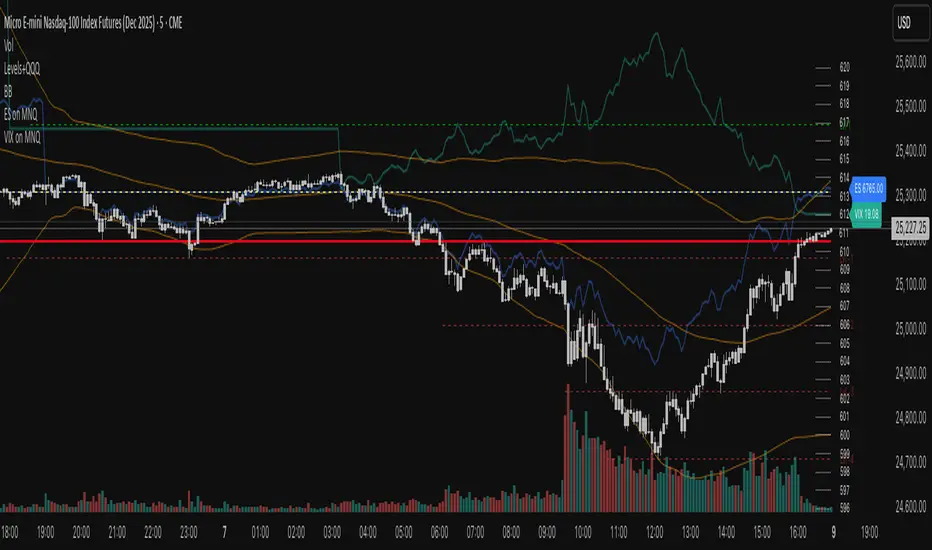
A compact on-chart table displays real-time trend bias for:
Gold (GC) – Bullish / Bearish / Neutral
U.S. Dollar Index (DXY) – Bullish / Bearish / Neutral
Color shading reflects each asset’s intrabar momentum.
⚙️ Visual Features
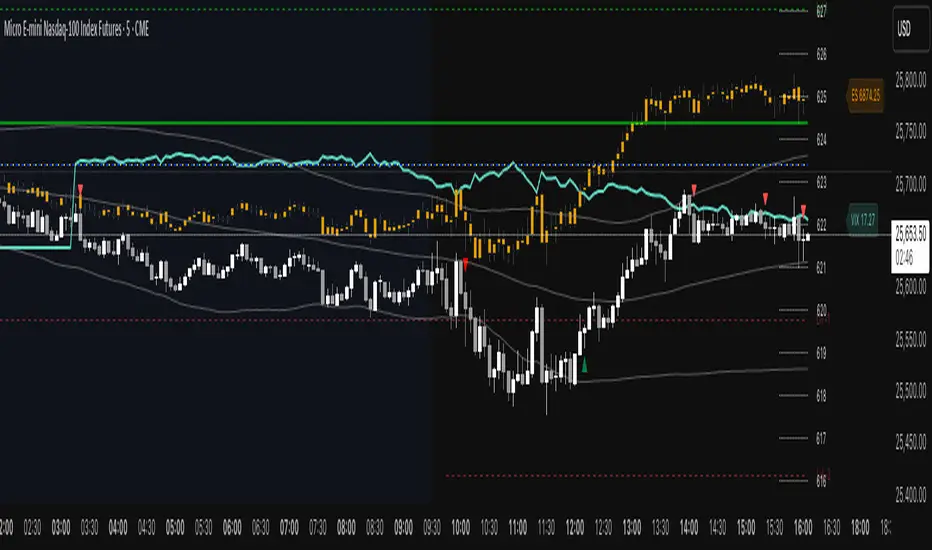
Adaptive background colors to show sentiment shifts.
Strong candle markers highlighting momentum bars near range extremes.
Alerts for clear Risk-On / Risk-Off alignment.
🧭 How to Use
Red background (Risk-Off): Gold strength + Dollar weakness → favorable environment for long gold setups.
Green background (Risk-On): Dollar strength + Gold weakness → bias toward short gold or avoid long exposure.
Gray background: Stay patient; look for confirmation or wait for alignment.
💡 Ideal For
Gold and Forex traders monitoring macro rotation.
Sentiment confirmation alongside order-flow, VWAP, or volume-delta tools.
Overlaying on intraday or higher-timeframe charts to frame trade bias.
Penunjuk Pine Script®