DeMARK 9-13For the first time ever, the power and precision of DeMARK is now available on TradingView. Combining core elements of the renowned Sequential® and Combo® studies, the DeMARK 9-13® indicator delivers the same unique insights in a streamlined interface.
The Sequential and Combo family of indicators have been trusted by the top financial firms, funds and figures for decades to enhance their trading and investment strategies. Known for their 9 Setup® and 13 Countdown® readings, these studies are designed to highlight potential market reversals as well as key areas of support, resistance and momentum. With DeMARK 9-13, users can access these groundbreaking techniques in one integrated offering.
While it's often said, "the trend is your friend," it's also crucial to recognize when it's about to end. Identifying potential market inflection points allows you to buy weakness and sell strength, improving your cost basis, reducing risk and allowing you to capitalize on a greater portion of the reversal.
At its core, 9s and 13s are constructed to measure market momentum and exhaustion. Both Sequential and Combo consist of two phases: Setup and Countdown. The Setup phase compares price activity across nine consecutive bars to define the market environment, while the Countdown phase performs a separate 13-bar comparison to indicate when a reversal may be imminent. A 9-13 reading reflects the fulfillment of both phases. When combined with TDST® lines and Risk Levels®, this approach provides a more comprehensive view of the market.
The DeMARK 9-13 indicator consists of:
Sequential
Combo
9 Setup
13 Countdown
TD Setup Trend (TDST)
Perfected® Setup
Risk Levels & Zones
Together, these elements provide an unparalleled view into the inner workings of the market, helping you anticipate shifts and act with greater precision.
🟡 DESCRIPTION
SETUP
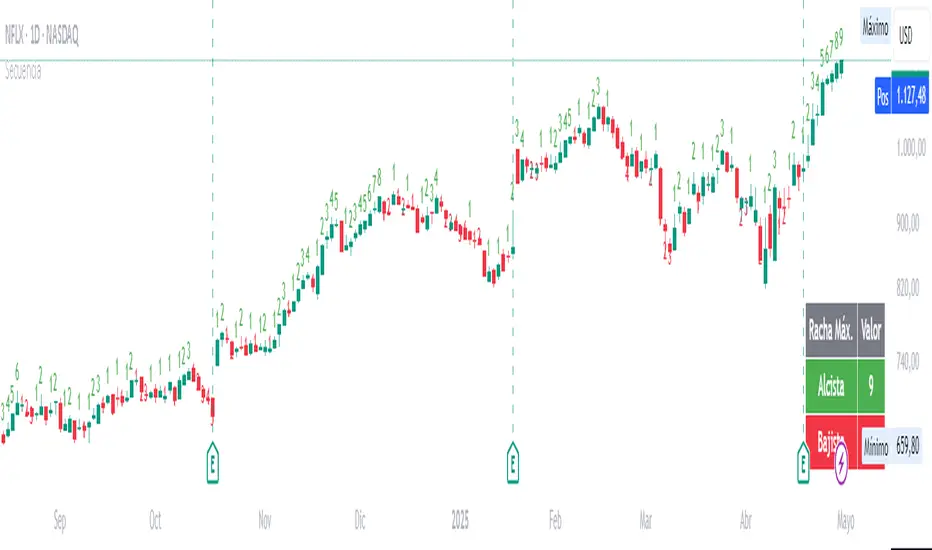
The initial stage of the DeMARK 9-13 indicator is the Setup phase. This series is the same for both Sequential and Combo and compares the close of the current bar to the close four bars earlier. Buy Setup counts are displayed in blue below the data set and fulfilled when there are nine consecutive closes less than the close four bars earlier. Sell Setup counts are displayed in blue above the data set and fulfilled when there are nine consecutive closes greater than the close four bars earlier.
During the active Setup, all number counts remain visible to show the progress of the series. Upon completing the Setup, the 9 is recorded and the 1-8 counts are removed. This reduces visual distraction and allows for more result history (due to TradingView’s 500-label limit). Setups are always counting, with Price Flips® occurring as the series alternates between Buy and Sell Setups.
PERFECTED SETUPS
Setups can be classified as either “Perfected” or “Imperfected.” The Setup is Perfected when the 9 is completed and the 6 and 7 bars have been exceeded. In the case of a Buy Setup, the low of bars 8 or 9 must be less than the low of bars 6 and 7. Conversely, in the case of a Sell Setup, the high of bars 8 or 9 must be greater than the high of bars 6 and 7. The point at which the Setup is perfected is displayed with a solid blue dot, matching the color of the Setup series.
Generally speaking, the market will reverse or stabilize within one to four bars of a completed and Perfected Setup 9. The strength and duration of this response can be assessed with the implementation of other indicators, such as TDST® lines.
TD SETUP TREND (TDST)
The TDST indicator is derived from the Setup phase and is used to confirm market trends and identify likely trend failures. A TDST resistance line is drawn from the highest true high of the completed 9 Buy Setup series, while a TDST support line is drawn from the lowest true low of the completed 9 Sell Setup series. These TDST lines provide an indication of market support, resistance and momentum to help evaluate the integrity of the move.
TDST lines are displayed in a lighter blue than the Setup phase. When Breakout Qualifiers are enabled, TDST lines can be considered qualified or disqualified. Disqualified TDSTs appear as a dashed line, indicating potential support in the case of TDST support lines or resistance in the case of TDST resistance lines. Qualified TDSTs appear as a solid line and will stop drawing when a breakout or breakdown occurs, suggesting continued momentum.
COUNTDOWN
Once the Setup phase is completed, the second stage of the DeMARK 9-13 indicator can begin — the Countdown phase. Sequential and Combo share the same Setup series, but there are subtle differences in their respective Countdown phases, each constructed to identify areas of potential trend exhaustion in different market conditions.
Sequential is designed to respond in both trending and consolidating markets, while Combo is more responsive in trending environments and inactive during periods of market consolidation. For that reason, we often say that Combo identifies the highest or lowest points of a move, with Sequential identifying secondary tests. When aligned, these results are even more powerful.
SEQUENTIAL COUNTDOWN
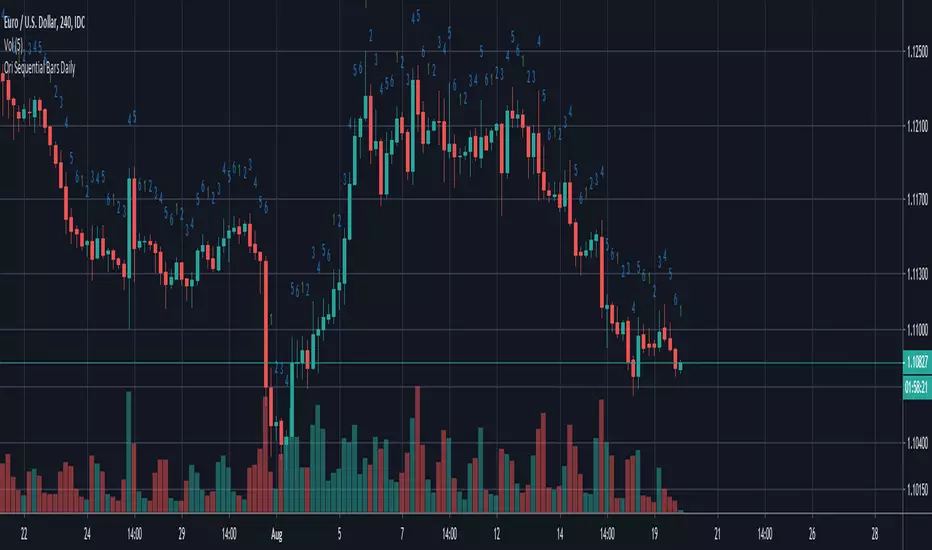
A Sequential Buy Countdown is possible upon completion of a Buy Setup and looks for 13 closes less than or equal to the low two bars earlier. Sequential Buy Countdown counts are displayed as a dark green number below the data set and can begin as early as the 9 bar of a completed Buy Setup. A Sequential Sell Countdown is possible upon completion of a Sell Setup and looks for 13 closes greater than or equal to the high two bars earlier. Sequential Sell Countdown counts are displayed as a dark red number above the data set and can begin as early as the 9 bar of a Sell Setup. Because of this overlap, Sequential Countdown requires as few as 12 bars beyond the 9 Setup to complete the cycle.
Unlike the Setup phase, Countdown counts need not be consecutive. During the active Countdown, all number counts remain visible to display the progress of the series. Upon completing the Countdown, the 13 is confirmed and the 1-12 counts are removed. This reduces visual distraction and allows for more result history (due to TradingView’s 500-label limit).
A completed Sequential 13 Countdown marks the fulfillment of the 9-13 reading and identifies potential market exhaustion. Additional elements of Sequential Countdown like Intersection, Countdown Deferral, Risk Levels and the 12-bar rule can be used to provide further detail and are outlined below.
COMBO COUNTDOWN
A Combo Buy Countdown is possible upon completion of a Buy Setup and looks for 13 closes less than or equal to the low two bars earlier, with additional rules based on the Combo version selected. Combo Buy Countdown counts are displayed as a light green number below the data set and can begin as early as the 1 bar of a completed Buy Setup. A Combo Sell Countdown is possible upon completion of a Sell Setup and looks for 13 closes greater than or equal to the high two bars earlier, with additional rules based on the Combo version selected. Combo Sell Countdown counts are displayed as a magenta number above the data set and can begin as early as the 1 bar of a Sell Setup. Because of this overlap, Combo Countdown requires as few as four bars beyond the 9 Setup to complete the cycle.
Unlike the Setup phase, Countdown counts need not be consecutive. During the active Countdown, all number counts remain visible to display the progress of the series. Upon completing the Countdown, the 13 is confirmed and the 1-12 counts are removed. This reduces visual distraction and allows for more result history (due to TradingView’s 500-label limit).A completed Combo 13 Countdown marks the fulfillment of the 9-13 reading and identifies potential market exhaustion. Additional elements of Combo Countdown like Risk Levels and the 12-bar rule can be used to provide further detail and are outlined below.
RISK LEVELS
When a 9 Setup or 13 Countdown indication is recorded, a Risk Level is generated to identify the zone within which a reversal should occur. This level accounts for any residual trend momentum without invalidating the buy or sell indication. For a completed buy indication, the Risk Level marks the price above which the 9 or 13 remains active and serves as additional support. Conversely, for a completed sell indication, it marks the price below which the 9 or 13 remains active and serves as additional resistance. This level can be viewed as the maximum threshold the indication can withstand before the prevailing momentum overwhelms and negates it and is often used to establish stop-loss areas.
Risk Level line colors correspond to the completed Setup, Sequential Countdown or Combo Countdown that generated it. Shaded risk zones can also be displayed, further highlighting the indication window. When Breakout Qualifiers are enabled, the Risk Level can be considered qualified or disqualified. Disqualified Risk Levels appear as a dashed line, indicating likely support in the case of a buy indication and likely resistance in the case of a sell indication. Qualified Risk Levels appear as a solid line and will stop drawing when a breakout or breakdown occurs, suggesting continued momentum.
4-BAR & 12-BAR METRICS
Generally speaking, the market should see some sort of response within four bars of a completed 9 Setup indication and 12 bars of a completed 13 Countdown indication. If the chart has not responded in that time the existing trend is likely to continue.
INTERSECTION
Intersection is an elective setting unique to Sequential Countdown. When enabled, it postpones the start of the Countdown phase until the price range of the later Setup counts overlap with the price activity of any Setup count occurring three or more bars earlier. This is intended as a pressure release to avoid commencing the count during an extraordinary breakaway market event or aberration. The Intersection level’s color matches its corresponding Buy and Sell Countdown reading and is displayed as a horizontal line on the confirming bar.
COUNTDOWN DEFERRAL
The Sequential Countdown phase of the DeMARK 9-13 indicator includes two optional Countdown Deferral qualifiers — the 13 vs. 8 rule and the 8 vs. 5 rule.
The 13 vs. 8 Countdown Deferral rule is designed to ensure that the tail end of the Countdown is representative of the existing trend. To fulfill this restriction, the low of the 13 bar must be less than or equal to the close of the 8 bar in the case of a Sequential Buy Countdown, while the high of the 13 bar must be greater than or equal to the close of the 8 bar in the case of a Sequential Sell Countdown. Because Countdown counts can increment in a sideways market, this rule helps to confirm that a trend has remained intact and improves accuracy as the series reaches its completion.
When enabled, this Countdown Deferral condition substitutes a “+” for what would otherwise be a “13,” thereby postponing the count. A Sequential Buy Countdown deferral is displayed in dark green below the data set, while a Sequential Sell Countdown deferral is displayed in dark red above the data set. Note that this optional setting is enabled by default and labeled “Last vs. 8 Qualifier” in the DeMARK 9-13 indicator settings.
Whereas the 13 vs. 8 rule is designed to ensure that the tail end of the Sequential series is representative of the existing trend, the 8 vs. 5 Countdown Deferral rule is designed to ensure that the body of the Countdown phase is properly configured. As with the 13 vs. 8 rule, the 8 vs. 5 rule matches the color and placement of its corresponding Buy or Sell Countdown series and substitutes a “+” for what would otherwise be a “5”, thereby postponing the count. The 13 vs. 8 comparison is critical to the Countdown phase, while the 8 vs. 5 comparison is elective and provides additional confidence that the trend has remained intact.
COUNTDOWN RECYCLE®
Markets are constantly evolving to reflect new information. Just as fundamentals experience occasional adjustments impacting the expectations of the asset, so too do technical analysis and market timing. This is most often reflected in the Sequential and Combo Countdown phase by a process known as Recycling.
Recycling occurs when a Countdown 13 is interrupted by a subsequent overlapping “22” Setup count in the same direction. Recycling suggests that the new Setup is sufficiently strong to weaken the impact of a confirmed Countdown series and resets the process. A recycling indication is represented as an “R” where the Countdown 13 was previously displayed, matching the color and placement of that Buy or Sell Countdown series.
COUNTDOWN CANCELLATION
Once completed, a 9 Setup and 13 Countdown confirmation is permanent and never altered. However, it’s important to note that Countdowns can be cancelled during their construction phase. There are two scenarios where a Countdown series would be removed from the chart.
The first Countdown cancellation scenario occurs when a subsequent 9 Setup is confirmed in the opposite direction prior to the completion of the Countdown phase. The reasoning is that market conditions have changed from what they were when the initial Setup was fulfilled, making the newer Setup more relevant. Upon confirming an opposing 9 Setup, the incomplete Countdown phase is canceled and removed from the chart.
The second Countdown cancellation scenario takes place when the TDST in the opposite direction is violated, suggesting a conclusion to the previous trend and a confirmation of a new one. In these cases, a true low that occurs above the Buy Setup’s TDST resistance line, or a true high that occurs below the Sell Setup’s TDST support line, cancels the incomplete Countdown phase and removes the counts from the chart.
🟡 SETTINGS
DISPLAY
Setup : Displays the Setup phase of the Sequential and Combo indicators. The first swatch controls the color of the Buy Setup phase displayed below the data set. The second swatch controls the color of the Sell Setup phase displayed above the data set.
TDST : Displays the TDST lines for the Sequential and Combo indicators. The first swatch controls the color of the TDST resistance lines associated with the Buy Setup phase. The second swatch controls the color of the TDST support lines associated with the Sell Setup phase.
Sequential Countdown : Displays the Countdown phase of the Sequential indicator. The first swatch controls the color of the Buy Countdown phase displayed below the data set. The second swatch controls the color of the Sell Countdown phase displayed above the data set.
Combo Countdown : Displays the Countdown phase of the Combo indicator. The first swatch controls the color of the Buy Countdown phase displayed below the data set. The second swatch controls the color of the Sell Countdown phase displayed above the data set.
Indicator font size : Adjusts the size of the Sequential and Combo indicator counts displayed above and below the data set. ( Default: 18 )
Display full series count : Displays the full Sequential and Combo numerical series for the active 9 Setup and 13 Countdown phases only, or for all completed indications (within TradingView’s 500-label limit). ( Default: Active only )
SETUP
Bars to Setup : Number of consecutive bars needed to complete the Setup phase. ( Default: 9 )
Bars to look back : Defines the bar to which the current Setup count is compared. ( Default: 4 )
Setup compare : Determines whether equal prices should increment the Setup count. ( Default: Without equal )
Count completion weight : Adjusts the font weight of the Setup completion counts displayed above and below the data set. ( Default: Bold )
Setup Perfection : Identifies when Setup Perfection occurs, with the low of the final two Buy Setup counts less than the lows three or four bars prior to completion, and the high of the final two Sell Setup counts greater than the highs three or four bars prior to completion. With the default “Bars to Setup” setting of “9,” Perfection occurs when the low of Buy Setup bar 8 or 9 is less than the lows of bars 6 and 7, and the high of Sell Setup bar 8 or 9 is greater than the highs of bars 6 and 7. ( Default: Enabled )
Enable Setup Risk Level : Displays the Risk Level tied to the Setup. ( Default: On )
Enable Setup Risk Level Zone : Shades the area between the completed Setup and its Risk Level. ( Default: On )
TD SETUP TREND (TDST)
TDST line thickness : Adjusts the thickness of TDST support and resistance lines. ( Default: Standard )
COUNTDOWN (SHARED)
Bars to Countdown : Number of bars needed to complete the Countdown phase. ( Default: 13 )
Bars to look back : Defines the bar to which the current Countdown count is compared. ( Default: 2 )
Countdown comparison value : Output used in the Countdown look back comparison. For Aggressive settings, Low/High is required. ( Default: Close )
Termination Count price value : Allows the final count of the Countdown phase to use a different comparison value for more flexibility. ( Default: Open or Close )
Countdown compare : Determines whether equal prices should increment the Countdown count. ( Default: With equal )
Count completion weight : Adjusts the font weight of the Countdown completion counts displayed above and below the data set. ( Default: Bold )
SEQUENTIAL COUNTDOWN
Enable Intersection : Toggles the Sequential Intersection phase requirement. ( Default: Off )
8 vs. 5 Qualifier : Qualifier requiring the low of the 8 Buy Countdown to be less than the close of the 5 count, and the high of the 8 Sell Countdown to be greater than the close of the 5 count. ( Default: Off )
Last vs. 8 Qualifier : Qualifier requiring the low of the final Buy Countdown count to be less than the close of the 8 count, and the high of the final Sell Countdown to be greater than the close of the 8 count. With the default “Bars to Countdown” setting of “13,” the low of the 13 Buy Countdown would need to be less than the close of the 8 count, and the high of the 13 Sell Countdown would need to be greater than the close of the 8 count. ( Default: On )
Enable Risk Level : Displays the Risk Level tied to the Countdown. ( Default: On )
Enable Risk Level Zone : Shades the area between the completed Countdown and its Risk Level. ( Default: On )
COMBO COUNTDOWN
Combo version : Determines the version of Combo used for the Countdown phase, whether it’s Standard, Conservative or Aggressive. ( Default: Standard )
Enable Risk Level : Displays the Risk Level tied to the Countdown. ( Default: On )
Enable Risk Level Zone : Shades the area between the completed Countdown and its Risk Level. ( Default: On )
RECYCLE
Enable Recycle : Toggles Recycling, replacing the final Sequential and Combo Countdown count with an “R” when its rules are met. With the default “Bars to Countdown” setting of “13,” a recycled 13 count would be replaced with the ‘R’. ( Default: On )
Setup Count : Defines the number of consecutive Setup bars required to trigger a Recycle. ( Default: 22 )
CANCEL
Reverse Setup : Incomplete Countdowns are cancelled when a Setup in the opposite direction is confirmed. ( Default: On )
TDST Rule : Incomplete Buy Countdowns are cancelled when a true low exceeds the Buy Setup’s TDST resistance line, and incomplete Sell Countdowns are cancelled when a true high breaks the Sell Setup’s TDST support line. ( Default: On )
BREAKOUT QUALIFIERS
Enable Breakout Qualifiers : Breakout Qualifier rules will dictate whether TDST and Risk Level line breakouts can be considered qualified or disqualified. Qualified lines are solid and will stop drawing when a breakout or breakdown occurs, suggesting continued momentum. Disqualified lines are dashed, serving as resistance in the case of a false breakout and support in the case of a false breakdown. When Breakout Qualifier rules are disabled, a line becomes solid on any close beyond the level. ( Default: On )
🟡 DISCLAIMER
By subscribing to and or using DeMARK 9-13 or any other DeMARK Indicators on TradingView, you acknowledge that you have read, understood and agree to the DeMARK for TradingView Terms of Service (located in the DeMARK account signature) as well as any updates to those terms which may happen from time-to-time.
The DeMARK Indicators are powerful tools designed to assist the individual process you use to understand financial markets and make investment decisions but they are not trading systems. Any information presented is not, and should not be construed as, financial or investment advice. You should not make any investment decision based solely on the information provided by these tools. The products we offer do not recommend or endorse any specific securities, financial products or investment strategies. Any information, data or analysis presented by any DeMARK products or tools is generic and does not consider your personal financial situation, investment objectives or risk tolerance. All investment decisions are yours alone and are made at your own risk. Those risks include, but are not limited to, potential system errors, data inaccuracies or outages.
From time to time unauthorized and unaffiliated third parties use the DeMARK name or the names of our copyrighted and/or trademarked products in an unapproved, inaccurate and misleading manner. While we do our best to remove these examples, some fake, flawed and fraudulent may exist. The only official and accurate sources of our products are those listed on the DeMARK company website. Unauthorized reproduction, copying, scraping, republishing, distribution, dissemination or any other use of our name, trademarks and/or copyrighted materials (including this script documentation) is prohibited.
Without in any way limiting DeMARK’s exclusive rights under copyright, trademark and all other intellectual property protections, any use of DeMARK products to “train” generative artificial intelligence (AI) technologies to generate text is expressly prohibited. DeMARK reserves all rights to license uses of this work for generative AI training and development of machine learning language or machine learning visual models.
The data and analysis in our products are based on sources believed to be reliable, but DeMARK does not control or guarantee the accuracy, completeness or timeliness of this information.
As a DeMARK subscriber or user, you are responsible for conducting your own research and due diligence before making any investment decisions.
Past performance, including any simulated or historical data, is not indicative of future results.
Skrip berbayar