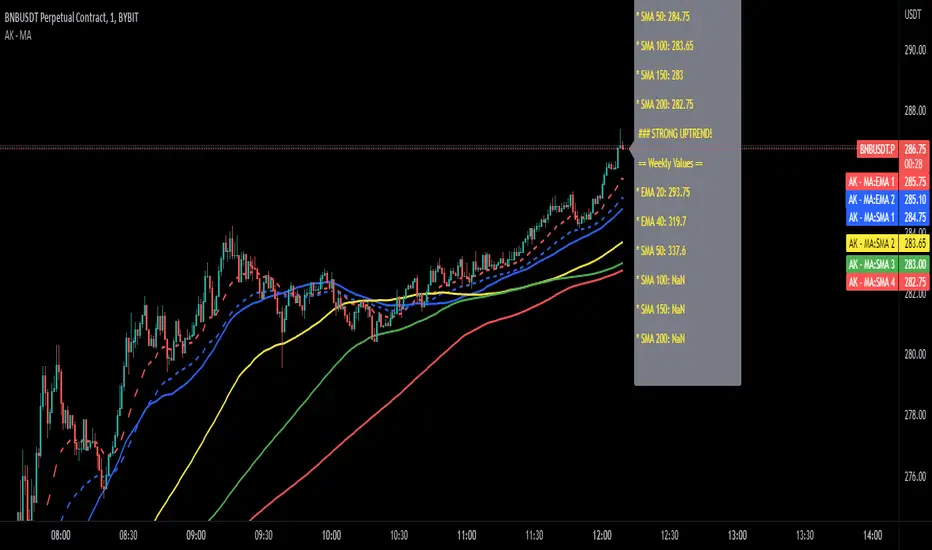
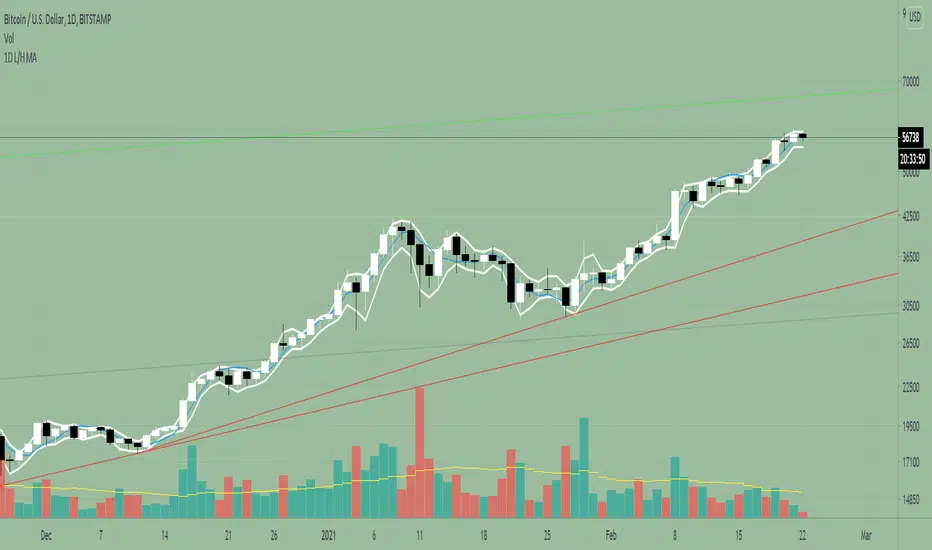
Adam Khoo Moving AveragesThis indicator will plot the simple and exponential moving averages Adam Khoo is also looking at for buying opportunities.
The best timeframe to use this indicator is the daily chart . The weekly moving averages are hard coded and don't change on any other timeframe. The other moving averages will show the values of your current timeframe.
In the settings you have the option to change the values of the moving averages and to show or not show the current timeframe moving averages or the weekly moving averages.
A label will also show the current value of all moving averages. To hide this label, go into the settings and click on 'Style' and at the bottom uncheck 'Labels'.
Happy trading ;-)
Simple Moving Average (SMA)
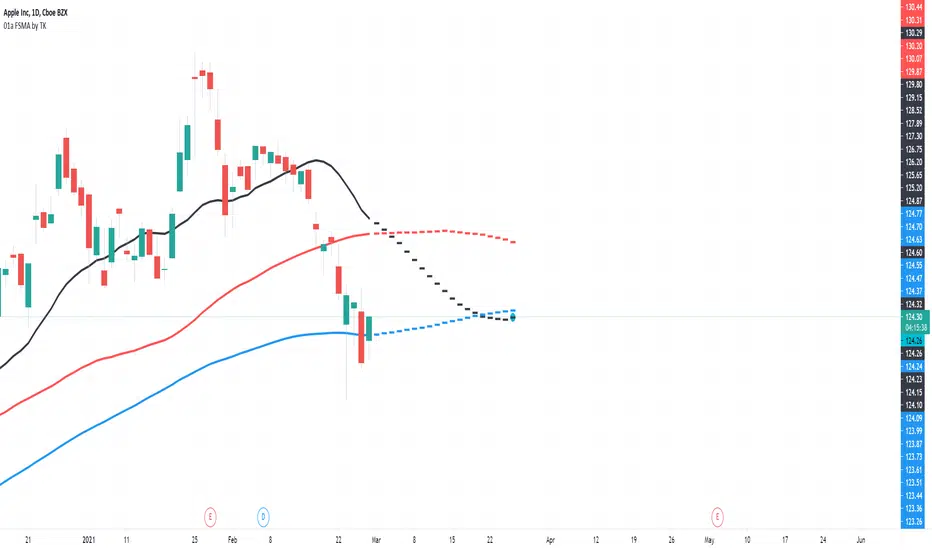
TradiKator 01a Forecast SMATradiKator 01a Forecast SMA is the a visual indicator that plots forecast SMA .
Forecast SMA
The dashed line after today, it is forecast SMA .
Green Dot: The target price according to the user input.(your assumption)
3 colors' Dashed lines: The SMA based on the target price
"Days to plot forecast SMA (Max=19, SwitchOff=0)" --> Please decide how many days' SMA you would like to forecast.
"Mod1 Assumed chg ratio ‰ in the every days (10=1%)" --> Mod1: User should give the change rate in the coming every days. For example, user's assumption is that price will increase 10% everyday.
"Mod2 Assumed chg % in the ?th day (1=1%)( Pls set Mod1 to 0)" --> Mod2: User should give the change rate in the future ?th days. For example, user's assumption is that price will increase 30% in the 3rd day.
"Mod2 Need ? day to reach the chg % (tomorrow = 1 day)" --> Mod2: User should give the future ?th days.
note: While using Mod2, user has to disable Mod1 by set Mod1 to 0 (default setting)
The reason for this single function script.
Due to Tradingview output limit, we can only plot very limited days forecast.
Therefore we made this single function script only for forecast SMA which could output more days' forecast SMA .
There is another single function script only for forecast EMA which will only output forecast EMA ,
We have a "input" option in this indicator, so if you can use both 2 indicators (forecast SMA and forecast EMA) at same time, then you can use one of the indicator's output as the input of the other indicator.
In this way when you use both 2 indicators at same time, you only need to adjust one of the indicators' target price setting, the setting will be sync to both indicators.
Relative Strength RatioAbout this indicator:
This indicator goes under many different names such as Relative Strength Ratio, Comparative Strength, Relative Strength Comparison (RSC) etc.
It compares the strength of the current asset to another asset of your choice and displays the relative strength of the current asset. (Not RSI)
There are several comparative indicators published already here on TV but I have added some unique features that I think is really useful.
When to use it:
This is useful when you want to compare for example a stock with its sector to find out if the stock is a leadership stock in that sector or main index.
You could also use it to compare the sector to its index etc.
If you want to compare for example a stock to both its index and its sector at the same time I suggest you add 2 instances of this indicator.
In many trading systems you are supposed find the strongest tickers by identifying "layers of strength" like 1. The strongest asset class that money is flowing into (like stocks, commodities, bonds, etc.) 2. Find the strongest sectors. 3. Find the stocks outperforming those sectors. 4. Find some kind of entry signal there.
How it works:
The indicator calculates an "RS line" (Relative Strength) by dividing the current ticker with a ticker of your choice. This creates a ratio or pair similar to how currencies are related to each others like USDGBP (dollar against pound). The RS line is black by default so you might want to change its color if you use a dark theme.
If the RS line is moving up it means your current asset is stronger than the asset you are comparing it with and vice versa.
Use the simple moving average to quickly see long term strength trends.
Features
RS line
Shows the relative strength of the current asset.
SMA
This Simple Moving Average has directional coloring; green when it is angled up and red when it is angled down. You can customise the period in the settings. If you don't want the color change just make both up/down color the same.
Relative market label
This displays the market you are currently comparing with as a label next to the last data point.
Because I tried stocks in 2 different countries I want to know which index I am comparing with and this label saves me from going into the settings to check. I find it to be a life saver!
Please let me know if you find any problems or if you have any ideas for improvement
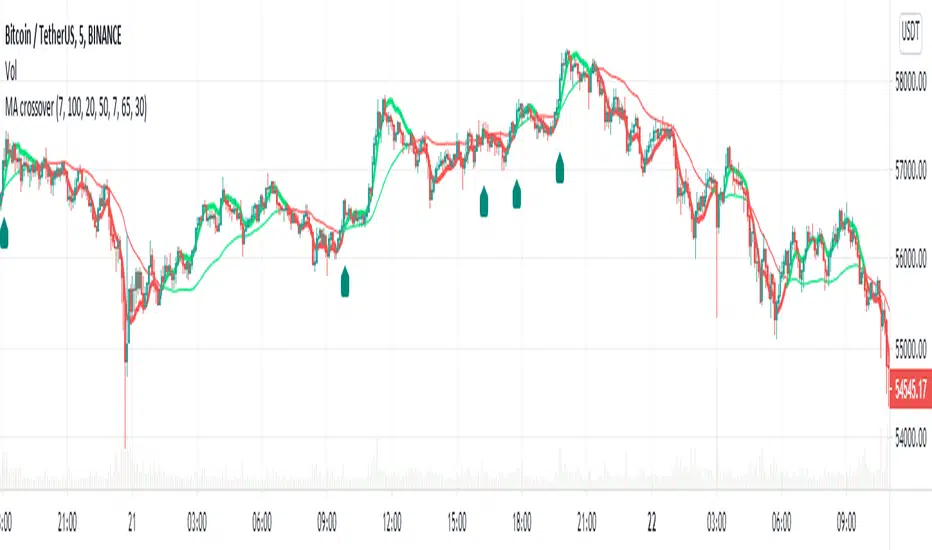
MA Crossover Alerts for Small Quick Profits on 3commas/DCA botDear fellow 3commas users,
This is a the most basic Moving Average crossover technique generating Buy Alerts.
This is especially written for those of you who want to link this basic crossover strategy with your 3commas DCA bot .
Buy Alerts
Moving averages available:
- Simple Moving Average (SMA)
- Exponential Moving Average (EMA)
- Weighted Moving Average (WMA)
- Hull Moving Average (HullMA)
- Volume Weighted Moving Average (VMWA)
- Running Moving Average (RMA)
- Triple Exponential Moving Average (TEMA)
Recommended settings for using with 3commas DCA bot:
Interval:
3m to 15m
3commas bot setup:
- TP/TTP: 0.3%/0.1%,
- Base Order: Your choice ,
- Safety Order: 1.2 * Base order
- Safety Order Volume Scale: 1.2,
- Safety Order Step Scale: 1.5,
- Max Active Deals: Your choice ,
- Price Deviation to Open Safety Order (% from initial order): 0.2%,
- Max Safety Trades Count: 7,
- Simulatenous Deals per Same Pair: 3
> Create Alert with Buy Alert and link it to your bot "Message for deal start signal"
MA Multiplier with FibonacciThis implementation of the "2-Year MA Multiplier" gives you some control over the indicator, you can change the multiplier from it's default of 5, you can change the lookback from it's default of 730 days and I've also added three fibonacci traces between the moving average and it's multiple that you can play with. Oh and you can also choose the data source ('close' or 'hl2' make most sense).
The formula for this indicator was created by Philip Swift.
Thanks to @Pladizow for pointing me to this indicator.

1D Low/High MA + Least Square Mean (3 indicators in 1)This indicator is a combination of 3 public indicators being:
* a standard Simple Moving Average with the source as the candle low & length of 2
* a standard Simple Moving Average with the source as the candle high & length of 2
* the Least Square Mean with a source of high + low /2 and length of 9
This combo was inspired by Tyler Coates who crafted EMASAR.
He regularly uses the a SMA with source of Low / High and length of 2 for defining trading daily ranges as well as the Least Square Mean for calculations in the his trading which he teaches via youtube.
I hope this indicator will reduce time spent on setting up charts.
Scalping using RSI 2 indicator with TP and TSLThis study implements a simply scalping using the RSI (calculated on two periods), the slopes of two MAs (EMA or SMA) having different lengths (by default, I use 50 and 200).
A take profit (%) and a trailing stop loss (%) are used.
Entry conditions:
.) Fast MA > Slow MA and Price > Slow MA and RSI < Oversold Threshold ------> go Long
.) Fast MA < Slow MA and Price < Slow MA and RSI > Overbought Threshold ------> go Short
Exit conditions:
.) Long entry condition is true and (close >= TP or close <= TSL) ----> close short position
.) Short entry condition is true and (close <= TP or close >= TSL) ----> close long position
The strategy performed best on Bitcoin and the most liquid and capitalized Altcoins but works excellent on volatile assets, mainly if they often go trending.
Works best on 3h - 4h time frame.
There's also an optional Volatility filter, which opens the position only if the difference between the two slopes is more than a specific value, which can be set in the study inputs. The purpose is not opening positions if the price goes sideways and the noise is way > than the signal.
Note:
.) the RSI length is 2;
.) the oversold Threshold is 90%;
.) the overbought Threshold is 10%;
.) by default, the take profit per cent is 0.5%;
.) by default, the trailing stop loss per cent is 0.5%;
.) by default, the fast MA length is 50;
.) by default, the slow MA length is 200;
.) by default, the MA used is EMA.
Cheers.

Moving Average Growth RateThis indicator measures the growth rate of any given MA from it's previous value. It defaults to the 200 period but you can plug in any value you want. I like to use this on the weekly time frame with the 200 period MA because it is such a long term moving average that it has never once gone down on the BTC chart. Even though the rate of change always looks minuscule, this indicator more precisely measures the rate of change, potentially identifying states of massive overvaluation.
I have been testing this one for a long time and ended up reconfiguring it several times. I configured it to be used on any time frame. The coloring values are hard coded as follows:
Business As Usual (Lime): Growth Rate < 2
Heating Up (Orange): Growth Rate >= 2 and Growth Rate < 3
Warning (Red): Growth Rate >= 3
If you have any comments or suggestions let me know.

Previous Period Levels - X Alerts====== ABOUT THIS INDICATOR
- A simple but highly customisable display of previous higher time-frame
OHLC values, drawn using line.new and label.new. Nothing fancy but...
- Customised resolution input which excludes time frames lower than 1 hour
while extending the common higher reference inputs to include:
• 6, and 12 Hour
• 5 Day
• 3, and 6 Month
• 1 Year
- Alert conditions using an adjustable SMA to help reduce false positive
spam.
- Full visual customisation options for (almost) every aspect, so it can be
tuned to suit most individual preferences.
- In line with the miriad visual customisation options is the ability to
change the display format of the Labels, to show more or less information,
or disable them altogether.
====== REASON FOR STUDY
- To practice advanced user input option handling to allow for a full visual
customisation experience without stepping outside of, or interfering with,
the intended function of the indicator.
- Provide reasonably clear code commenting and structure in order to be
useful as a potential learning aid for others, and future reference for
myself.
====== DISCLAIMER
Any trade decisions you make are entirely your own responsibility.
I've made an effort to squash all the bugs, but you never know!
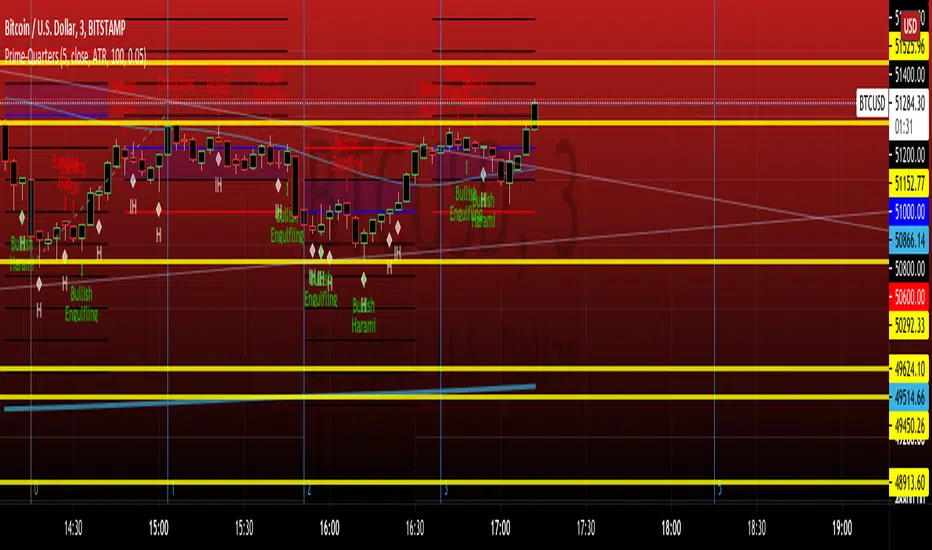
PRIME-QUARTERS W-XsThis script applies both the Quaters theory for easy analysis of market structure, as well as a 50 and 800 SMA to be used in conjunction with the 4 and 21 SMA found in Prime-Pulse, to pin point sniper entries. $auceCamp
Combined Momentum MA (Equal-Length EMA/SMA Crossover)Overview:
This momentum and trend-following strategy captures the majority of any trending move, and works well on high timeframes.
It uses an equal-period EMA and SMA crossover to detect trend acceleration/deceleration, since an EMA places a greater weight and significance on the most recent data.
To reduce noise and optimize entries, we combined this with an overall trend bias for further confluence.
How it works:
Signals are determined by the crossover of an EMA and SMA of the same length, e.g. EMA-50 and SMA-50.
The overall trend bias is determined using a slower SMA golden/death cross, e.g. SMA-50 and SMA-100.
The signal is stronger when it occurs in confluence with the overall trend bias, e.g. when EMA-50 crosses over SMA-50, while above the SMA-100. This is analogous to only opening long positions in a bull market.
Indicator description:
GREEN: Up Trend (EMA is above SMA, while EMA is above BIAS_MA. This shows a bullish confluence.)
YELLOW: No Trend (EMA/SMA crossover and BIAS_MA are not in confluence.)
RED = Down Trend (EMA is below SMA, while EMA is below BIAS_MA. This shows a bearish confluence.)

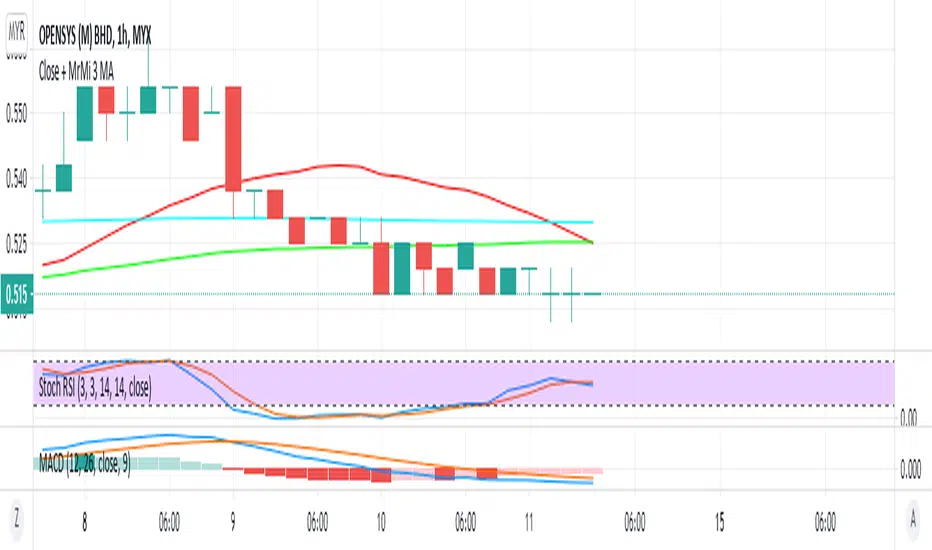
MrMi 3 in 1 MAThis 3 in 1 moving average script can help all of you to save your indicator use especially for free user. this script icluded 20 MA, 50 MA, and 200 MA which is important to all trader. I hope this script can assist all of you to maximize the important indicators in your trading plan.
Skrip purata bergerak 3 dalam 1 ini dapat membantu anda semua untuk menjimatkan penggunaan penunjuk anda terutama untuk pengguna percuma. skrip ini merangkumi 20 MA, 50 MA, dan 200 MA yang penting bagi semua peniaga. Saya harap skrip ini dapat membantu anda semua untuk memaksimumkan petunjuk penting dalam rancangan perdagangan anda.
يمكن أن يساعدك هذا البرنامج النصي 3 في 1 في المتوسط المتحرك جميعًا على حفظ استخدام المؤشر الخاص بك بشكل خاص للمستخدم المجاني. يتضمن هذا البرنامج النصي 20 MA و 50 MA و 200 MA وهو أمر مهم لجميع المتداولين. آمل أن يساعدك هذا البرنامج النصي جميعًا على تعظيم المؤشرات المهمة في خطة التداول الخاصة بك.
这种三合一移动平均值脚本可以帮助所有人节省指标使用量,尤其是对于免费用户而言。该脚本包括20 MA,50 MA和200 MA,这对所有交易者都很重要。我希望该脚本可以帮助大家最大化您的交易计划中的重要指标。
यह 3 इन 1 मूविंग एवरेज स्क्रिप्ट विशेष रूप से मुफ्त उपयोगकर्ता के लिए आपके संकेतक उपयोग को बचाने में आप सभी की मदद कर सकती है। इस स्क्रिप्ट में 20 एमए, 50 एमए और 200 एमए शामिल हैं जो सभी व्यापारी के लिए महत्वपूर्ण है। मुझे उम्मीद है कि यह स्क्रिप्ट आपकी ट्रेडिंग योजना में महत्वपूर्ण संकेतकों को अधिकतम करने के लिए आप सभी की सहायता कर सकती है।
이 3 in 1 이동 평균 스크립트는 특히 무료 사용자를 위해 지표 사용을 절약하는 데 도움이 될 수 있습니다. 이 스크립트에는 모든 상인에게 중요한 20 MA, 50 MA 및 200 MA가 포함되었습니다. 이 스크립트가 거래 계획의 중요한 지표를 극대화하는 데 도움이되기를 바랍니다.
この3in 1移動平均スクリプトは、特に無料ユーザーの場合、インジケーターの使用を節約するのに役立ちます。このスクリプトには、すべてのトレーダーにとって重要な20 MA、50 MA、および200MAが含まれていました。このスクリプトが、取引計画の重要な指標を最大化するのに役立つことを願っています。
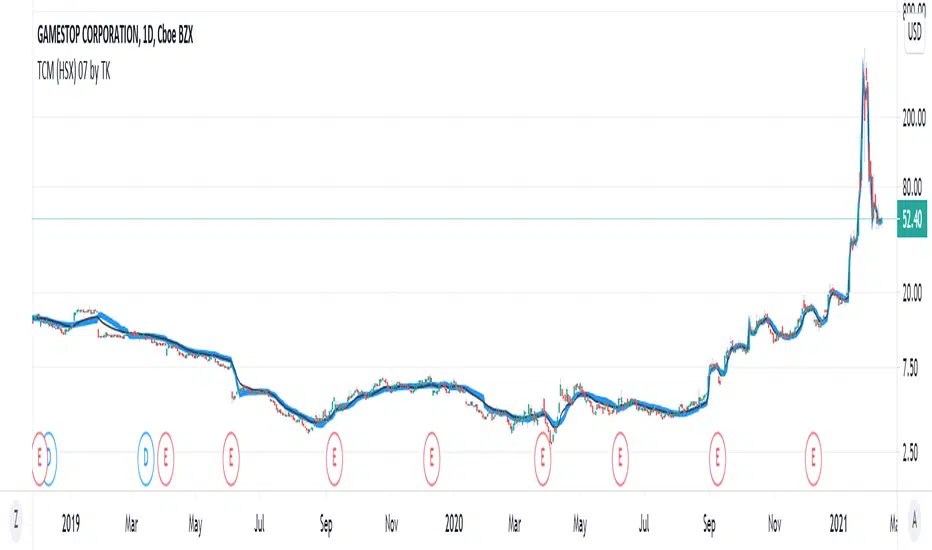
TradiKator 07 Turnover Cycle MATradiKator 07 Turnover Cycle MA (TCM (HSX) 07 by TK) is a visual indicator that underlying stock's character since its participants' collected forces cause the price movement.
Here, we use turnover rate estimation to identify a possible trading level of a given underlying stock.
I hope this indicator can help traders to estimate a true market average price in the essential trading behavior.
Here is an input option to enter shares float manually in the case that a user who has quite a limited time frame financial data.
Known issue:
The share split will cause "Total float shares" inaccurate and therefore the result will be unreliable.
We are trying to find a solution.
TradiKator is Traders' indicator.
Please visit TraiKator for more free scripts.
We also support the Chinese.
Happy new year!
Wishing you a great and successful journey in the Chinese Zodiac Bull Year.
MrBB:BullBear Support BandVery simple and effective S/R band. Created bycombining the weekly 21EMA and weekly 20SMA, it provides strong support/resistance depending on market direction, and works as a basing area for retraces during parabolic (and normal) bull markets.

Moving Average PeriodicalPMA derives the length of its rendered SMA from the number of periods (example: 5 days) and the length of the period (example: 390 minutes)
The result is an indicator that should be the same across different time-frames of the same type. Allowing for the simple calculation and generation of a Daily Moving Average like the 5 Day SMA (the default for minute based time-frames).
MA Divergences for any indicatorThis is a mod of Tistas mod of the default RSI divergences.
www.tradingview.com
This is a SMA that can be applied to any indicator for divergence seeking. This can be useful if you use a custom indicator script and want divergences added, or for any oscillator really. Set the length to 1 and it will mirror the oscillator in question.

Ark Crypto HeatlineThis is the 'on chart' indicator. See also "Ark Crypto Heatband" indicator for a side-by-side BTC view, without a re-scaled line.
The crypto landscape is largely dominated by BTC and characterised by cyclical stages with varying degrees of mean reversion.
To understand what stage of the cycle we are currently experiencing, it is useful to examine to what degree the current price has extended beyond the long term average that BTC has established. This is true even when analysing other crypto assets as BTC is the dominant force in the crypto asset class.
This indicator uses the 1400 period daily SMA , which is broadly the 200 period weekly SMA. This can be configured, but historically has represented a baseline to which BTC commonly returns.
The graph plots current price in terms of multiples of this long term average. Traditionally, at multiples beyond 10, BTC is considered overextended with a higher likelihood of trending towards the mean thereafter. Colors indicate the extent of price extension.
Where the indicator is applied to non BTCUSD pairs, a smoothed conversion is applied, seeking to superimpose the BTC long period SMA onto the current chart.
The indicator specifically references BTC by default on all charts, as it is designed to use BTC as general purpose indication of where crypto as a whole currently sits. Accordingly the indicator is only to be used on crypto charts.
For best results on BTC, using BNC:BLX will give the longest historical view.

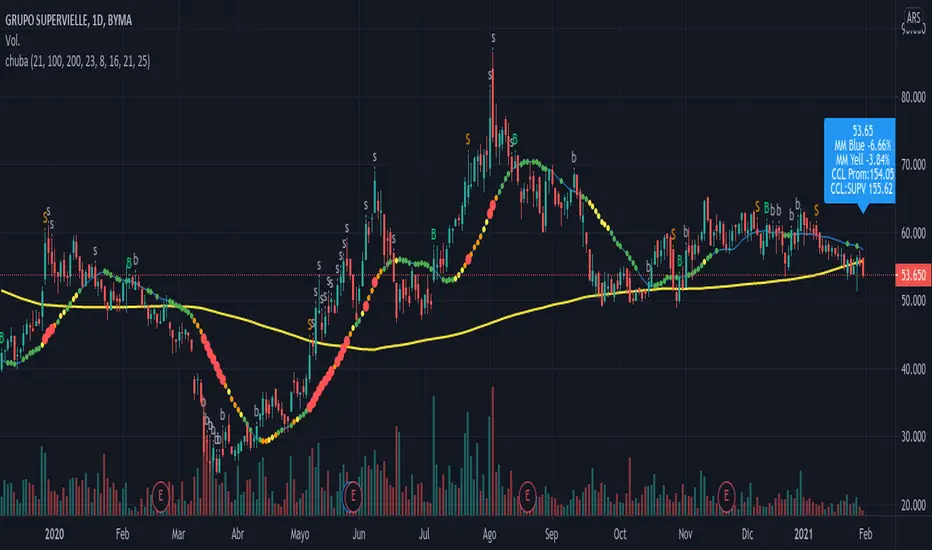
chuba indicator MM21 dispersion cclIt draws a Simple Media Mobile of 21 days (MM21days) in blue and draws a MM200days in yellow , despite the time frame is Days, Hours or Seconds.
Indicator based in Prof ALEXIS TSCHUBAROV 's strategy . It calculates the max dispersion in percent between the MM21days and the ticker price inside the time frame.
Over the last candle write a coloured globe depending on the dispersion with the latest stock price:
blue : dispersion < 8%
green : dispersion < 16%
orange: dispersion < 23%
yellow : dispersion < 25%
red : dispersion >= 25%
The globe show inside:
last stock price
Azul NN.NN% : dispersion between MM21days and the last stock price
Ama NN.NN% : dispersion between MM200days and the last stock price
CCL average ( contado con liqui dolar price in ARS )
tiker's CCL ( contado con liqui dolar price in ARS )
Colored dots over MM21days depends the value between MM21days and the max dispersion of the candle :
none dot : dispersion < 8%
green dot: dispersion < 16%
orange dot: dispersion < 23%
yellow dot: dispersion < 25%
red dot: dispersion >= 25%
Show over the candle when Buy or Sell
The criteria when buy or sell are:
When the closed stock price crosses the MM21days
When the dispersion with the MM21days exceed the 25%
Alarms:
Alarm when sell , when buy
Alarm dispersion reaches 23%
Note:
ask for more CCL tickers price.
Alexandermonday ( a brusa )
Ark Crypto HeatbandThe crypto landscape is largely dominated by BTC and characterised by cyclical stages with varying degrees of mean reversion.
To understand what stage of the cycle we are currently experiencing, it is useful to examine to what degree the current BTC price has extended beyond a long term average. This is true even when analysing other crypto assets and helpful to view side by side.
This indicator uses the 1400 period daily SMA, which is broadly the 200 period weekly SMA. This can be configured, but historically has represented a baseline to which BTC commonly returns.
The graph plots current price in terms of multiples of this long term average. Traditionally, at multiples beyond 10, BTC is considered overextended with a higher likelihood of trending towards the mean thereafter. Colors indicate the extend of price extension.
The indicator specifically references BTC by default on all charts as it is designed to use BTC as general purpose indication of where crypto as a whole currently sits. Accordingly the indicator is only to be used on crypto charts.

Cloud & Ribbon Moving AveragesGreat for reversals, entry points for long & short positions.
Clouds change colors when crossover between 2 MA's occur.
Options for:
5-12 Day EMA
34-50 day EMA
150-200 day SMA
8-9 Day EMA Ribbon
HLC MA One LineHLC MA is a simple Moving Average which compares x period close and hlc3 averages and takes the greater one. So, it's a pretty fast Moving Average. It's also color coded. Green, white, and red used for up trend, possible correction or transition area and down trend, respectively. It's smoothed by using a simple method, color of the indicator only changes when its value higher or lower than its n period earlier value. By doing this, HLC MA manages to be fast and and less prone to false trend changes.
