Reivaj MA - PreSession This script contains 9 moving averages which can be changed each between "sma", "ema", "wma", "vwma.
The values of the moving averages are:
MMA20 = SMA20
MMA50 = SMA50
MMA100 = SMA100
MMA200 = SMA200
MMA300 = SMA300.
MMAextra1 = ema 8
MMAextra2 = ema21
MMAextra3 = sma400
MMAextra4 = sma500.
It has an Asian range that goes from 21: 00-07: 00 UTC which turns the color of the candle in green.
And pre-sessions that is one hour before the opening, the time of the opening and the hour after the opening of London and New York.
Simple Moving Average (SMA)

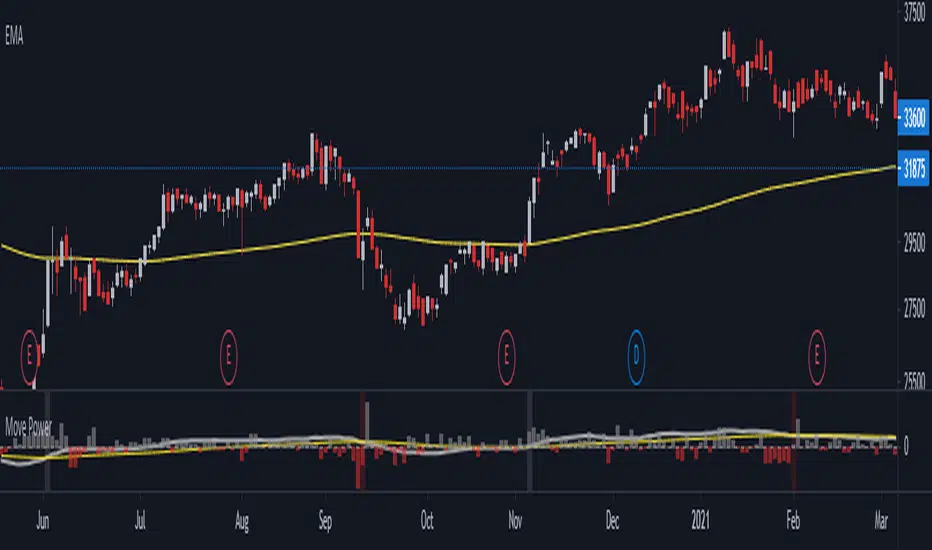
200 EMA RoC Vs IndexThis indicator calculates 200 EMA rate of Change, between today's value vs yesterday's value
I found it useful and easier to track the trend.
I added 50 SMA as additional help top calculate averages between data. if the 50 SMA crosses over it will show gray background, and red if it crosses down.
The Histogram represent Index data.
Best use for Stock Market
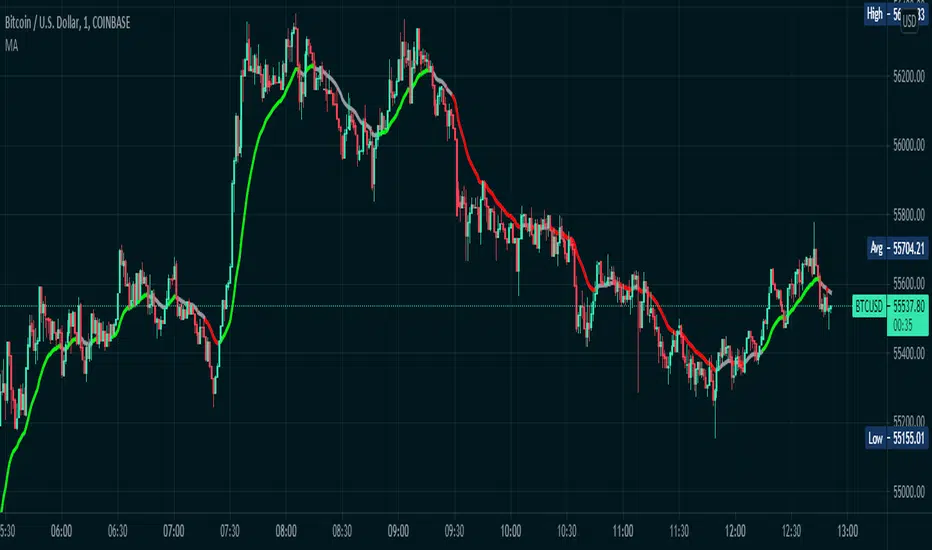
Color Changing Moving Average
Hello everybody!
I'm not much of a coder but I do make indicators for myself for fun sometimes and found this one super cool. Hope it helps!
Basically it's a moving average that changes colors based on the trend. How does it do it, you may ask? Simply put, it checks and makes sure that the open and close price is above the moving average, then it checks and sees if the 50-period RSI (length adjustable) is above 50. If both conditions are met, the moving average turns green. Simple as that.
If the price is below the moving average and the RSI is below 50, the moving average turns red.
If the price is above the moving average but the RSI is below 50, the line is grey and I advise to simply waiting for the trend direction to be decided. Likewise, if the price is below the moving average, but the RSI is above 50, the line is also grey.
This is NOT a comprehensive system, and the changing color of the moving average does not indicate a buy or sell signal. It simply indicates that the price is trending. You should use your own entry and exit strategy, such as the MACD, Wave Trend, Schaff Trend Cycle, etc.
As well, I would recommend waiting for confirmation of a trend change when the color changes, since in a range price can cross multiple times before deciding on the right direction.
The slope of the moving average can help too, since in a range the moving average is typically flat.
I would recommend using a fixed risk to reward ratio, to limit emotions. But, this would also help with a trend-following strategy due to the trend filter functionality.
The length of the moving average is adjustable, as well as the RSI period- though I wouldn't recommend selecting an RSI lower than 30 because it will whipsaw more. Disabling the EMA option will give you an SMA that does the same thing as the EMA. You can also disable the RSI filter and simply have a moving average that changes color when the price is above/below- but that's pretty boring, huh?
Anyways, hope this helps, happy trading everybody :)
Bollinger Bands + RSI Alerts for 3commas/DCA botHey Folks !
This is in indicator that generates buy alerts combining Bollinger Bands and RSI.
RSI validates the BB signal by confirming we are not in an oversold area.
Interval: 3m to 15m
Recommended settings for 3commas DCA bot
- TP/TTP: 0.3%/0.1%,
- Base Order: Your choice ,
- Safety Order: 1.2 * Your choice of base order
- Safety Order Volume Scale: 1.2,
- Safety Order Step Scale: 1.5,
- Price Deviation to Open Safety Order (% from initial order): 0.25%,
- Max Safety Trades Count: 7
- DO NOT USE STOP LOSS
> Create Alert with Buy Alert and link it to "Message for deal start signal"

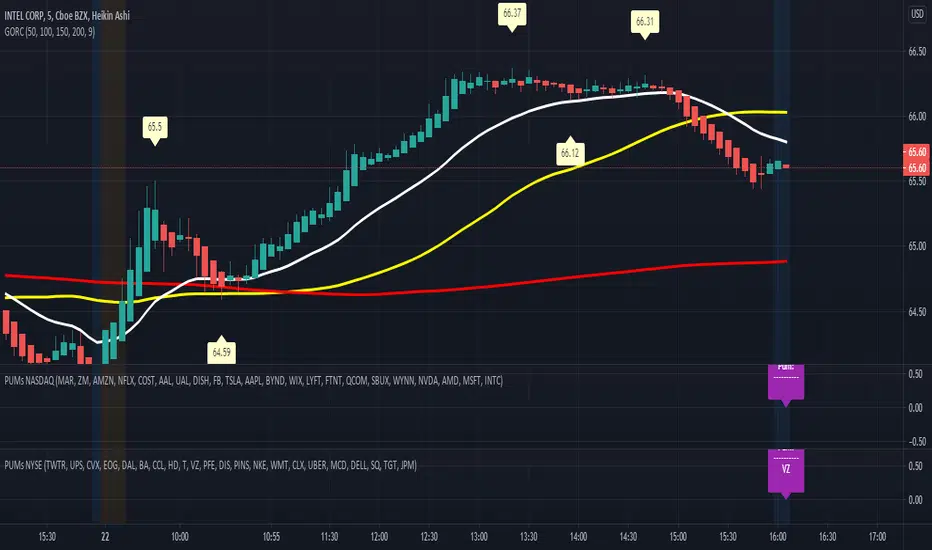
Multicheck NYSE GORCSummary:
This script is an extension of GORC Indicator, it allows to verify if any of 22 different ticker symbols belowing to Nyse Composite Exchange accomplish with a green candle is over a red candle after a rebound in the exponential average of 20 periods, or had a rebound in teh simple moving average of 50 periods
The script will check the condition described above in any timeframe you are positioned. For example: In you are checking INTC (it doesn't matters the ticker symbol you are analyzing) in 4 hours timeframe, the script will check all the 22 ticker symbols selected in order to accomplish the condition, after that if you change to other timeframe, like 5 minutes, ths script will check again but this time in 5 minutes period for the 22 ticker symbols pre-selected, and so on
Options:
You can select any of the ticker symbols that belows to the Nyse Composite Exchange. Maximun number of ticker symbols = 22

Multicheck NASDAQ GORCSummary:
This script is an extension of GORC Indicator, it allows to verify if any of 22 different ticker symbols belowing to Nasdaq Composite Exchange accomplish with a green candle is over a red candle after a rebound in the exponential average of 20 periods, or had a rebound in teh simple moving average of 50 periods
The script will check the condition described above in any timeframe you are positioned. For example: In you are checking INTC (it doesn't matters the ticker symbol you are analyzing) in 4 hours timeframe, the script will check all the 22 ticker symbols selected in order to accomplish the condition, after that if you change to other timeframe, like 5 minutes, ths script will check again but this time in 5 minutes period for the 22 ticker symbols pre-selected, and so on
Options:
You can select any of the ticker symbols that belows to the Nasdaq Composite Exchange. Maximun number of ticker symbols = 22
Exotic SMA Explorations Treasure TroveThis is my "Exotic SMA Explorations Treasure Trove" intended for educational purposes, yet these functions will also have utility in special applications with other algorithms. Firstly, the Pine built-in sma() is exceedingly more efficient computationally on TV servers than these functions will be. I just wanted to make that very crystal clear. My notes elaborate on this in the code blatantly.
Anyhow, the simple moving average(SMA) is one of the most common averaging filters used in a wide variety of algorithms. "Simply put," it's name says a lot about it. The purpose of this script, is to demonstrate variations of it's calculation in a multitude of exotic forms. In certain scenarios our algorithms may require a specific mathemagical touch that is pertinent to our intended goals. Like screwdrivers, we often need different types depending on the objective we are trying to attain. The SMA also serves as the most basic of finite impulse response(FIR) algorithms. For example, things like weighted moving averages can be constructed by using the foundational code of SMA.
One other intended demonstration of this script, is running multiple functions for comparison. I have had to use this from time to time for my own comparisons of performance. Also, imbedded into this code is a method to generically and recklessly in this case, adapt an algorithm. I will warn you, RSI was NEVER intended to adapt an algorithm. It only serves as a crude method to display the versatility of these different algorithms, whether it be a benefit or hinderance concerning dynamic adaptability.
Lastly, this script shows the versatility of TV's NEW additions input(group=) and input(inline=) upgrades in action. The "Immense Power of Pine" is always evolving and will continue to do so, I assure you of that. We can now categorize our input()s without using the input(type=input.bool) hackTrick. Although, that still will have it's enduring versatility, at least for myself.
NOTICE: You have absolute freedom to use this source code any way you see fit within your new Pine projects. You don't have to ask for my permission to reuse these functions in your published scripts, simply because I have better things to do than answer requests for the reuse of these functions. Sufficient accreditation regarding this script and compliance with "TV's House Rules" regarding code reuse, is as easy as copying the functions in their entirety as is. Fair enough? Good!
When available time provides itself, I will consider your inquiries, thoughts, and concepts presented below in the comments section, should you have any questions or comments regarding this indicator. When my indicators achieve more prevalent use by TV members, I may implement more ideas when they present themselves as worthy additions. Have a profitable future everyone!
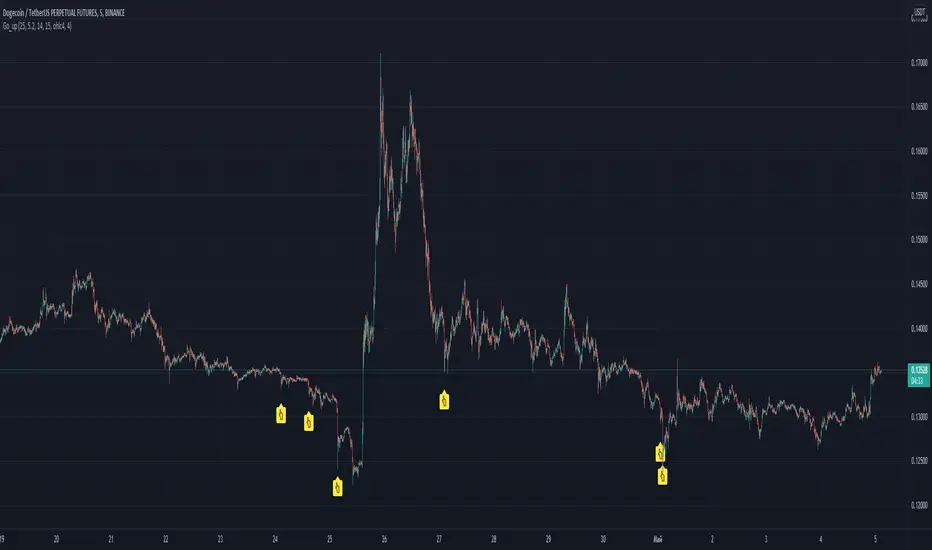
Go_up Hello. Our task is to find the local minimum. The trade is entered on the basis of RSI and SMA according to a specific formula, which is embedded in the code. When the RSI crosses the SMA upside down, a long position is entered. You can change the length of the RSI. The longer the length, the less frequent, but more accurate the entrance, and vice versa. You can use a different time frame. The default RSI length is 25 and the time frame is 15 minutes. Use hooks for auto trading, there is an alert. I recommend using a larger number of altcoins and with the default settings or TF 5 minutes. If you want to "scalp", then use the length 15-21 and take profit 0.5-2 percent. See the history of signals and you can make the optimal strategy for yourself. Due to the strong volatility, these settings are optimal. I use position averaging over history, additional purchase occurs no more than three times, before going into a plus. Entering a trade in notifications "once per bar". To exit, you can use scripts from other authors, for example, pivot / resistance points. No repainting. If anyone has any questions, write, I will answer in detail. good luck trading, dear friends!
Snake Trend PremiumThis is an improved version of my original open source snake trend script.
I made this script to reference the current market environment while working on the lower time frames. It combines 8 slow moving averages to calculate the strength of the market trend. It will color the center of the line based on those results. The purpose of it is to visualise a bunch of sma lines into 1 line, it will make it much more organised and gives visual clarity instead of chaos. Do not use this script.
How the snake calculates trend strength for color:
1. It will check for each SMA line if it increased or decreased in value compared to previous candle.
2. An increase means +1 a decrease means -1
3. It will count those numbers to get a strength value ranging from -8 to 8
4. Each specific number is color coded and it will plot that color into the center of the snake based on the color theme selected in config
Configuration:
Show MA Lines = Ability to show the hidden lines used for calculation
5 Color Themes = Includes 5 color themes for the snake of which one based on the original, this is so the user can decide which color theme is most clear.
Plot Snake on other timeframe ? = Ability to plot the visual snake on the timeframe you want instead of current, this will not change the calculation and is only visual.
Use Current Timeframe MACD ? = Chose if you want to use a custom timeframe for MACD (outer skin of the snake line), below that are the standard MACD settings
Use Current Timeframe rsiMFI ? = Chose if you want to use a custom timeframe for rsiMFI (inner skin of the snake line)
Static SMA Length ? = The amount of candles the SMA uses to calculates it's value, standard SMA settings
Timeframe in Minutes SMA 1 = The timeframe line 1 uses (these timeframes are very important as they decide the trend strength calculation which is the backbone of the script. Below that are settings for all the other SMA's
SMA length input changes all lines at once.
The script will get published in 2 ways:
A simple version that will display the trend strength indicator as bars (no overlay)
A version which displays the strength as colors and includes a skin to see if higher or lower TF MACD and rsiMFI are in the negative or positive
Disclaimer:
Never enter a trade purely based on the indicator as it is a trend visualisation but not a good entry trigger.

Linear Regression CandlesThere are many linear regression indicators out there, most of them draw lines or channels, but this one actually draws a chart.
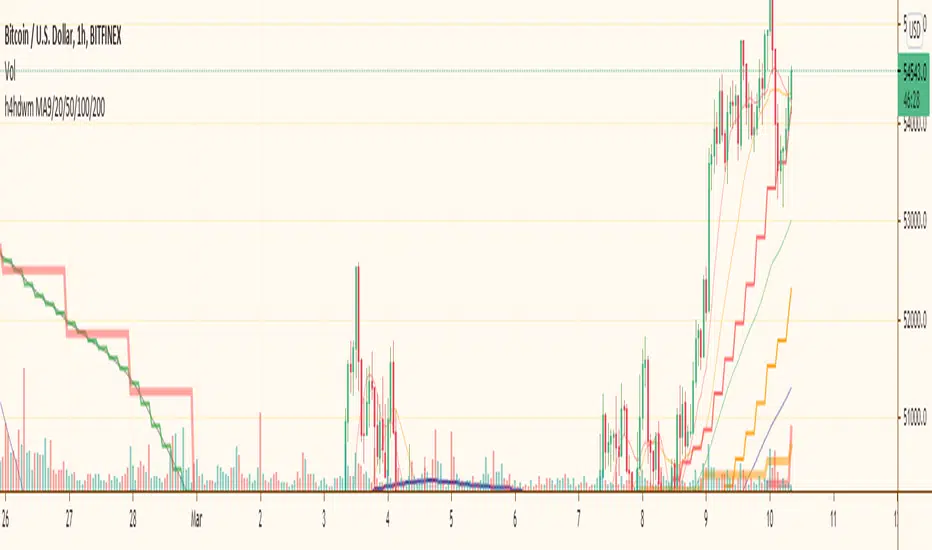
h4hdwm (updated)I put most importand moving avarages for most importand time frames together. When you whatching a graph you are sometimes missing another time frime very importand moving avarage and there is a reaction on price. with this multi time frame multi ma indicator you can see all of them at once. it makes a little mass if you let all of them together. so you might close some of them.
Bigger time frames Moving Avarages has ticker lines and bigger steps.
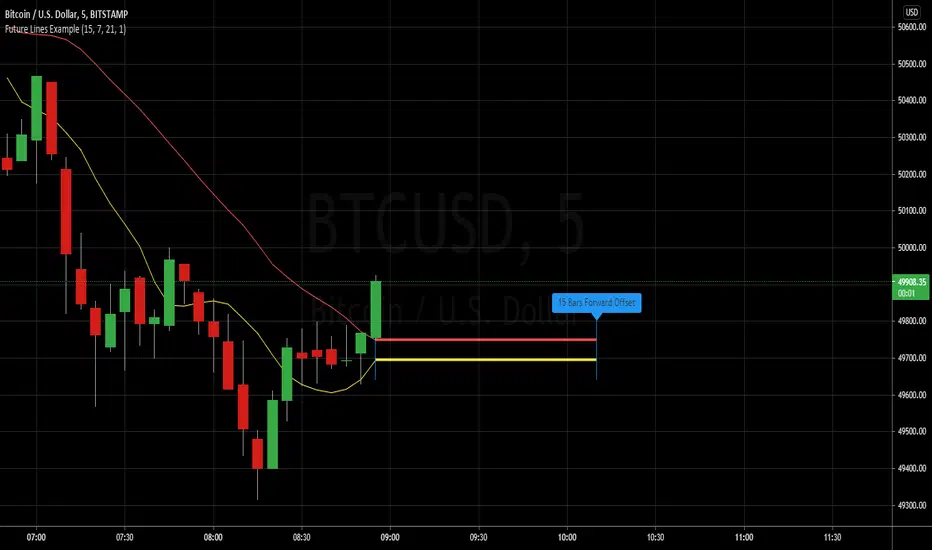
Example - Future Line DrawingExample primarily focuses on:
• creating a simple function to get a time offset value
• using the offset to set drawing locations in the future
• how to properly set up and manipulate line positions
Extras ( end of script ):
• inclusion of vertical lines for visualising start and end points using the time offsets
• inclusion of label to read out the current time offset forwards/backwards
This script publication is intended for:
• Educational Purposes
Who is it for?
• anyone who wants to learn the basics of drawing using 'time' for purposes of positioning
Monthly, Quaterly, Yearly SMA trendsIt highlights on the chart when the SMA20 crosses the SMA60 etc. for the Monthly, Quaterly, Yearly SMA trends.

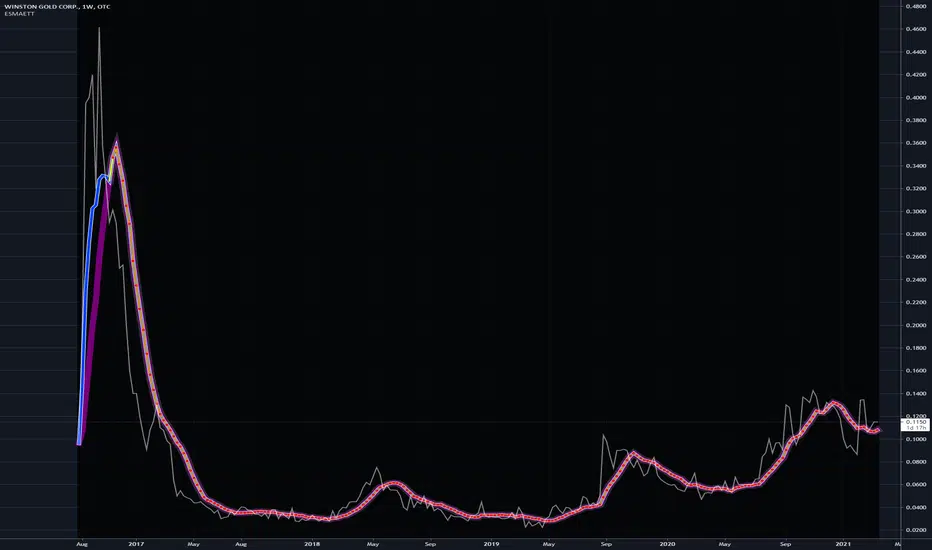
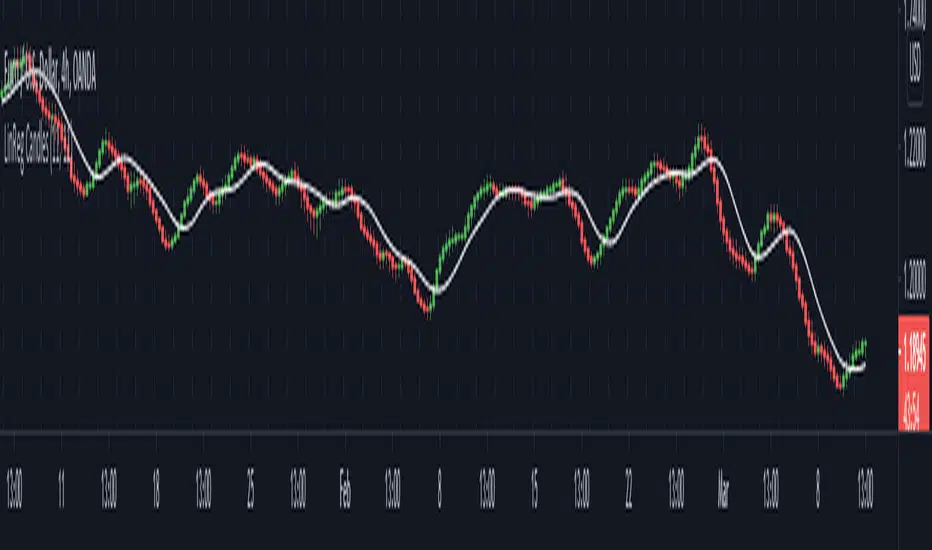
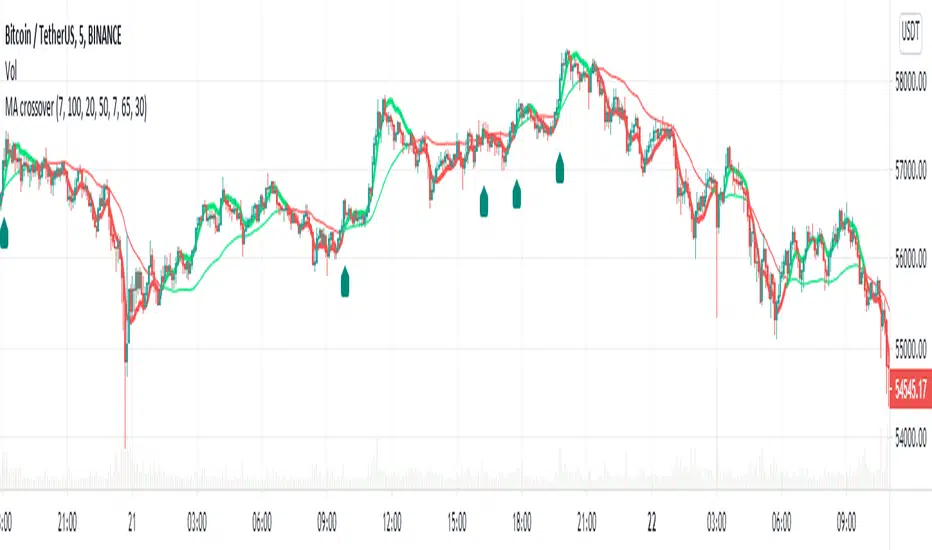
Easy TrendThis signal is completely based on analysis and transformation of a single simple moving average. As with all signals and indicators, it should be combined with others.
This is how the signal is built:
1. First it takes the SMA of the closing price.
2. It then takes the ROC of that SMA using a length of 1.
3. It takes an 8-period SMA and also a 64-period SMA of that ROC.
4. These are plotted as follows:
- the ROC is plotted in green when above 0 (trending up) and red when below 0 (trending down).
- the 8-period SMA is plotted as a thin white line within the ROC signal
- the 64-period SMA is plotted as a thick white line within the ROC signal
When the trendline is green, this is a bullish zone. When the trendline is red, this is a bearish zone.
Moving averages (all types of moving averages) are inherently lagging signals. To compensate for that, I am offsetting each SMA series by half of its period. This may be confusing to some, but the end result is a mathematically accurate SMA signal, centered on the signal that it is providing the moving average of. It doesn't stop the lag, but it directly and obviously shows how lagged each signal is, which I personally find better to trade against.
Symbols on the top and bottom of indicator:
Yellow triangle at bottom of indicator shows where a downward trend is starting to bottom out and a buy/long opening may be available soon.
Green triangle at bottom of indicator shows that a downward trend has switched to an upward trend. This indicates a good time to buy.
Yellow triangle at top of indicator shows where an upward trend is starting to plateau and a sell/short opening may be available soon.
Red triangle at top of indicator shows that an upward trend has switched to a downward trend. This indicates a good time to sell.
Note: You may see multiple yellow triangles before seeing a green or red triangle. This can happen when multiple trend accelerations or decelerations occur within an overall green or red zone.
In addition there is a dotted line connecting the end of the 64-period SMA to the end of the 8-period SMA. This indicates the direction the trend is moving towards. When the dotted line crosses the zero line, this portrays a rough estimate of where the trend may switch from a downtrend to an uptrend or vice versa. This is the "best" time to buy or sell, depending on your strategy.
I recommend placing a SMA on your candles set to the same window size as this indicator, and also to offset that SMA to the left by half its window size. For example, a 90-period SMA should be offset by -45 periods. That will cause it to be correctly aligned with this trend signal.

MA Trend MonitorMA Trend Monitor base on 3 Moving Average to define and display trend status on all time frame.
1. Calculate
* Fast Moving Average apply to High Price and Low Price
* Slow Moving Average apply to Close Price
* Trend defined by rule below:
- Up trend when Moving Average of Low Price moving above Moving Average of Close Price
- Down trend when Moving Average of High Price moving below Moving Average of Close Price
- Sideway when Moving Average of Close Price moving between 2 Moving Average of High and Low Price
2. Interface
* Color:
- Up trend: green
- Down trend: red
- Sideway: gray
* Fast Moving Average
- Default period: 20
- Moving Average Type: EMA/SMA
* Slow Moving Average
- Default period: 70
- Moving Average Type: EMA/SMA
* Line Resolution
- Number of Line: 13 (from 1 minute to 1 Month)
- Resolution of each line adjustable or disable.

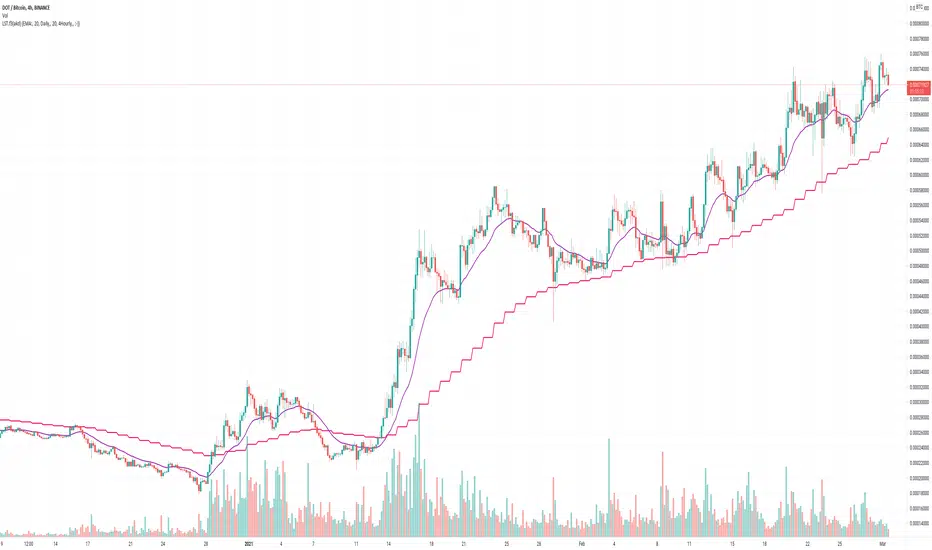
LedgerStatusToolbox fork3: EMA/SMA that stays on a specific timeMy (akd) radically cut down fork#3 of the "Ledger Status Toolbox"
which had included many more options that I don't need
but was missing the 4hourly, and hourly = which I added here
and yes, I kicked out the weekly. Hardly ever looking at that anyways. Shall I reintroduce it for fork4 ?
The huge advantage of this approach, over other SMA/EMA indicators:
It stays on the chosen (e.g. daily) data, and calculates the moving averages for that data. Even if you switch the chart to different time candles (like hours or weeks).
So whatever time resolution candles you look at, these indicator lines stay in the same place.
Thanks to krogsgard. Check out his "Ledger Status Toolbox" it also has Bollinger bands (but those are always on "current" I think?). A very powerful tool, just too powerful for most times for me newb. So I cut it down to this mini version. Enjoy!
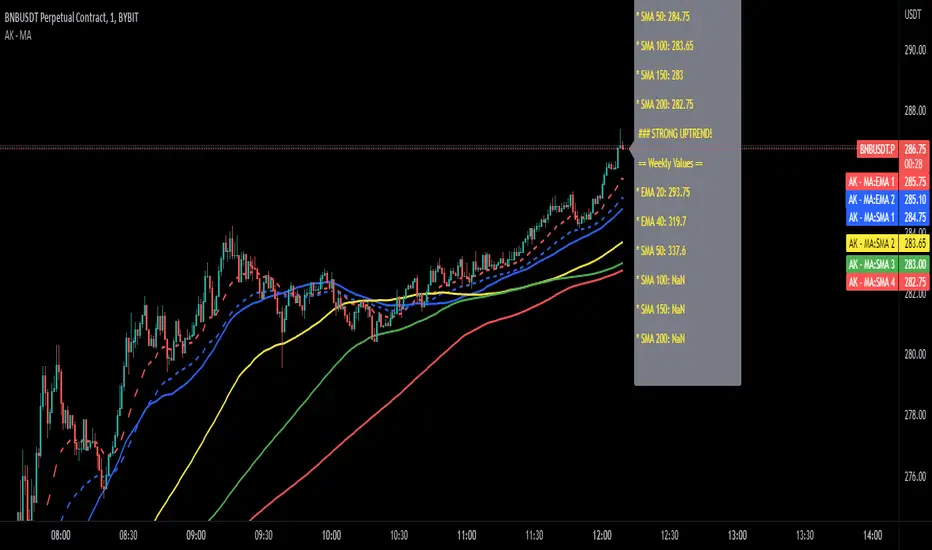
Adam Khoo Moving AveragesThis indicator will plot the simple and exponential moving averages Adam Khoo is also looking at for buying opportunities.
The best timeframe to use this indicator is the daily chart . The weekly moving averages are hard coded and don't change on any other timeframe. The other moving averages will show the values of your current timeframe.
In the settings you have the option to change the values of the moving averages and to show or not show the current timeframe moving averages or the weekly moving averages.
A label will also show the current value of all moving averages. To hide this label, go into the settings and click on 'Style' and at the bottom uncheck 'Labels'.
Happy trading ;-)
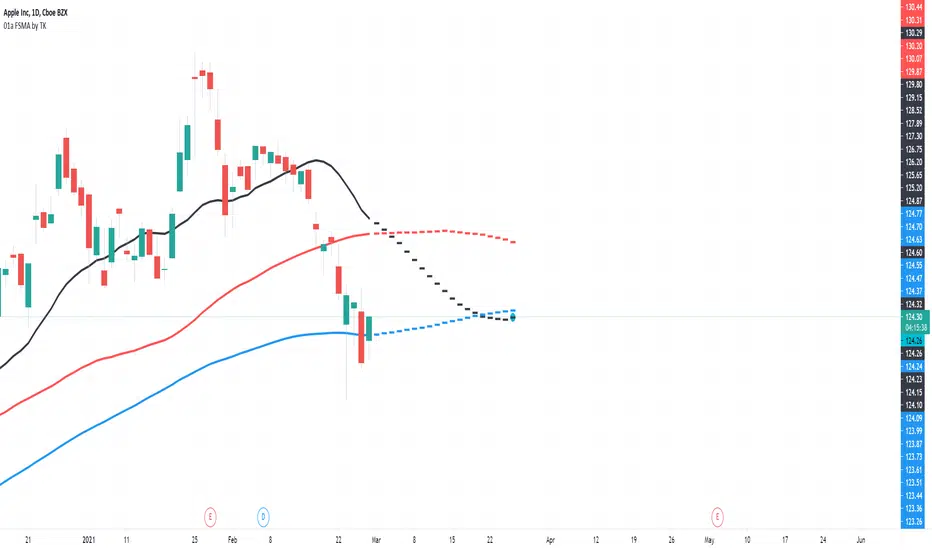
TradiKator 01a Forecast SMATradiKator 01a Forecast SMA is the a visual indicator that plots forecast SMA .
Forecast SMA
The dashed line after today, it is forecast SMA .
Green Dot: The target price according to the user input.(your assumption)
3 colors' Dashed lines: The SMA based on the target price
"Days to plot forecast SMA (Max=19, SwitchOff=0)" --> Please decide how many days' SMA you would like to forecast.
"Mod1 Assumed chg ratio ‰ in the every days (10=1%)" --> Mod1: User should give the change rate in the coming every days. For example, user's assumption is that price will increase 10% everyday.
"Mod2 Assumed chg % in the ?th day (1=1%)( Pls set Mod1 to 0)" --> Mod2: User should give the change rate in the future ?th days. For example, user's assumption is that price will increase 30% in the 3rd day.
"Mod2 Need ? day to reach the chg % (tomorrow = 1 day)" --> Mod2: User should give the future ?th days.
note: While using Mod2, user has to disable Mod1 by set Mod1 to 0 (default setting)
The reason for this single function script.
Due to Tradingview output limit, we can only plot very limited days forecast.
Therefore we made this single function script only for forecast SMA which could output more days' forecast SMA .
There is another single function script only for forecast EMA which will only output forecast EMA ,
We have a "input" option in this indicator, so if you can use both 2 indicators (forecast SMA and forecast EMA) at same time, then you can use one of the indicator's output as the input of the other indicator.
In this way when you use both 2 indicators at same time, you only need to adjust one of the indicators' target price setting, the setting will be sync to both indicators.
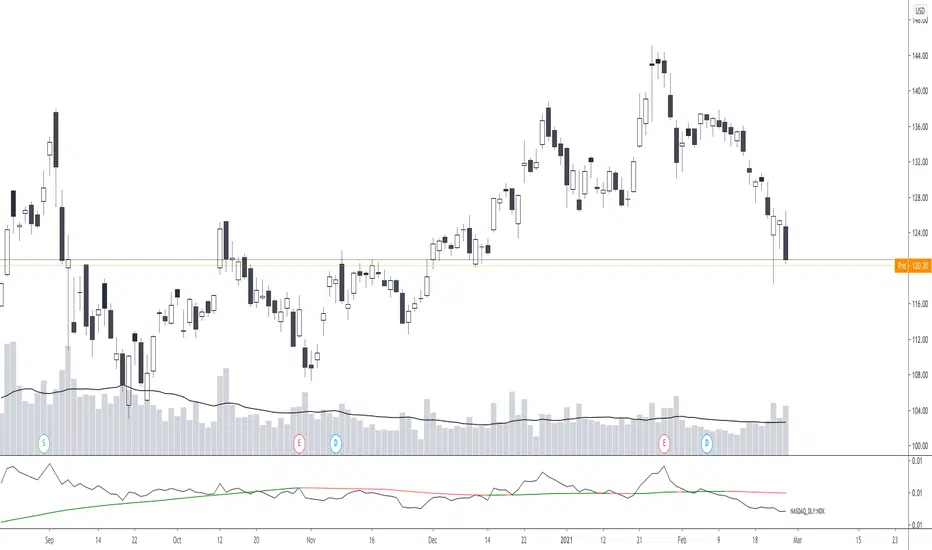
Relative Strength RatioAbout this indicator:
This indicator goes under many different names such as Relative Strength Ratio, Comparative Strength, Relative Strength Comparison (RSC) etc.
It compares the strength of the current asset to another asset of your choice and displays the relative strength of the current asset. (Not RSI)
There are several comparative indicators published already here on TV but I have added some unique features that I think is really useful.
When to use it:
This is useful when you want to compare for example a stock with its sector to find out if the stock is a leadership stock in that sector or main index.
You could also use it to compare the sector to its index etc.
If you want to compare for example a stock to both its index and its sector at the same time I suggest you add 2 instances of this indicator.
In many trading systems you are supposed find the strongest tickers by identifying "layers of strength" like 1. The strongest asset class that money is flowing into (like stocks, commodities, bonds, etc.) 2. Find the strongest sectors. 3. Find the stocks outperforming those sectors. 4. Find some kind of entry signal there.
How it works:
The indicator calculates an "RS line" (Relative Strength) by dividing the current ticker with a ticker of your choice. This creates a ratio or pair similar to how currencies are related to each others like USDGBP (dollar against pound). The RS line is black by default so you might want to change its color if you use a dark theme.
If the RS line is moving up it means your current asset is stronger than the asset you are comparing it with and vice versa.
Use the simple moving average to quickly see long term strength trends.
Features
RS line
Shows the relative strength of the current asset.
SMA
This Simple Moving Average has directional coloring; green when it is angled up and red when it is angled down. You can customise the period in the settings. If you don't want the color change just make both up/down color the same.
Relative market label
This displays the market you are currently comparing with as a label next to the last data point.
Because I tried stocks in 2 different countries I want to know which index I am comparing with and this label saves me from going into the settings to check. I find it to be a life saver!
Please let me know if you find any problems or if you have any ideas for improvement
MA Crossover Alerts for Small Quick Profits on 3commas/DCA botDear fellow 3commas users,
This is a the most basic Moving Average crossover technique generating Buy Alerts.
This is especially written for those of you who want to link this basic crossover strategy with your 3commas DCA bot .
Buy Alerts
Moving averages available:
- Simple Moving Average (SMA)
- Exponential Moving Average (EMA)
- Weighted Moving Average (WMA)
- Hull Moving Average (HullMA)
- Volume Weighted Moving Average (VMWA)
- Running Moving Average (RMA)
- Triple Exponential Moving Average (TEMA)
Recommended settings for using with 3commas DCA bot:
Interval:
3m to 15m
3commas bot setup:
- TP/TTP: 0.3%/0.1%,
- Base Order: Your choice ,
- Safety Order: 1.2 * Base order
- Safety Order Volume Scale: 1.2,
- Safety Order Step Scale: 1.5,
- Max Active Deals: Your choice ,
- Price Deviation to Open Safety Order (% from initial order): 0.2%,
- Max Safety Trades Count: 7,
- Simulatenous Deals per Same Pair: 3
> Create Alert with Buy Alert and link it to your bot "Message for deal start signal"
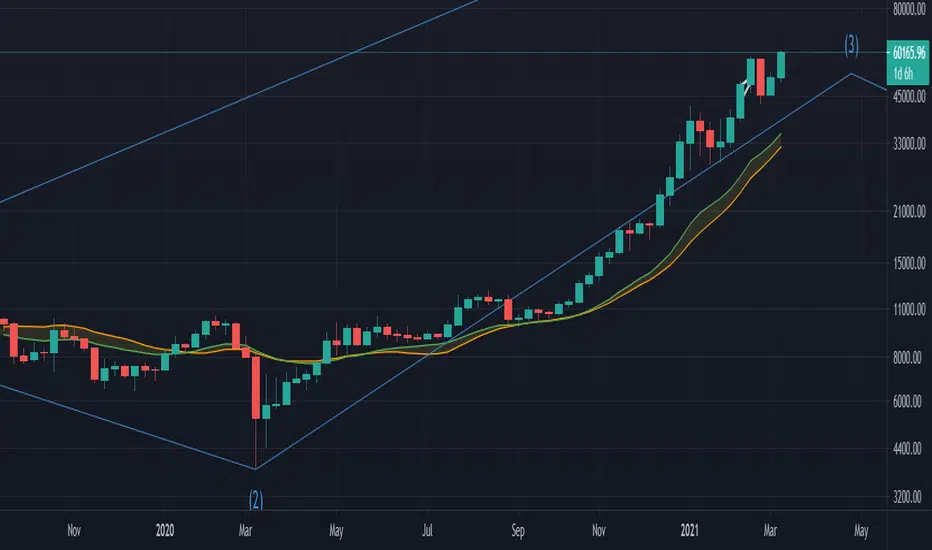
MA Multiplier with FibonacciThis implementation of the "2-Year MA Multiplier" gives you some control over the indicator, you can change the multiplier from it's default of 5, you can change the lookback from it's default of 730 days and I've also added three fibonacci traces between the moving average and it's multiple that you can play with. Oh and you can also choose the data source ('close' or 'hl2' make most sense).
The formula for this indicator was created by Philip Swift.
Thanks to @Pladizow for pointing me to this indicator.

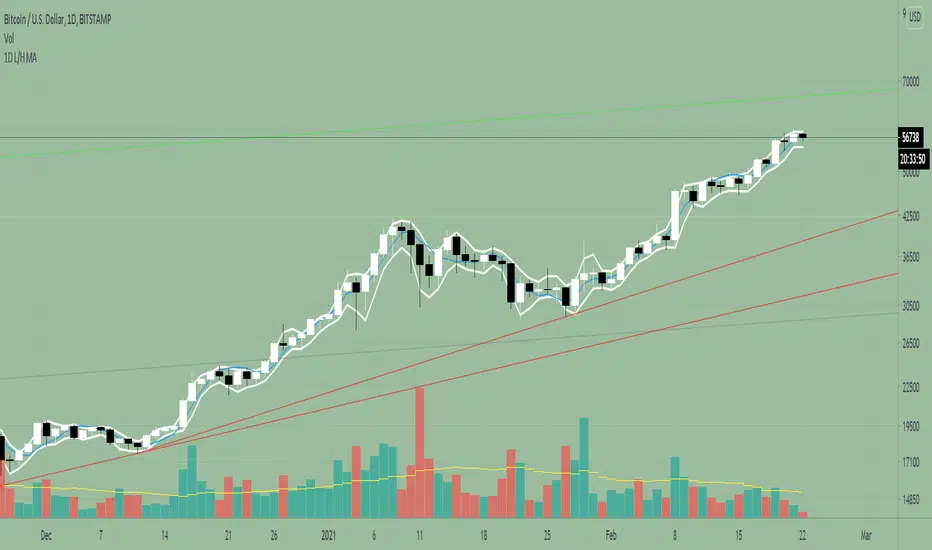
1D Low/High MA + Least Square Mean (3 indicators in 1)This indicator is a combination of 3 public indicators being:
* a standard Simple Moving Average with the source as the candle low & length of 2
* a standard Simple Moving Average with the source as the candle high & length of 2
* the Least Square Mean with a source of high + low /2 and length of 9
This combo was inspired by Tyler Coates who crafted EMASAR.
He regularly uses the a SMA with source of Low / High and length of 2 for defining trading daily ranges as well as the Least Square Mean for calculations in the his trading which he teaches via youtube.
I hope this indicator will reduce time spent on setting up charts.