Triple EMA-by pooyaPublished by POOYAMONTOYA
This is a triple moving average with optional inputs in one oscillator
For more information and use our platform please contact us
Sma
Fibonacci Based Three Simple Moving AveragesSimple Moving Averages 55
Simple Moving Averages 144
Simple Moving Averages 233

Fibonacci Based Three Simple Moving AveragesSimple Moving Averages 55
Simple Moving Averages 144
Simple Moving Averages 233

Four Simple Moving AveragesFour Simple Moving Averages combined into one indicator.
For customization DM

SS EMA / SMA RibbonColor Change if above or below EMAs / Ribbon
StokedStocks EMA / SMA Ribbon 9 20 25 30 35 40 45 50 55 60 65 70 75 80 85 90 95 100 200
EMAs Color Change if above or below EMAs / Ribbon
Lime : Uptrending; Long Bias
Green : Dip Buy / ReEntry or downtrend reversal warning
Red : Downtrend. Short Bias
Maroon : Short Reentry (sell the peak) or uptrend reversal warning
1st strategy Long when Price crosses above all EMAs
2nd strategy if late is buy first or second pullback to 9 or 20 EMA which are the 1st and 2nd ribbon lines (in an uptrend)
3rd strategy is Short once price crosses UNDER all EMAs
Use Trailing stop % once long or short
Better when shorter time frames line up with Longer time Frames for less risk EXAMPLE Above all EMAs on 5min chart and on Daily Chart

Triple SMA and EMA [MA using days, regardless of candle period]Those moving averages are calculated from the Day candlesticks, regardless of whether the chart is using 5min, 45min, 2H...
So your 200MA is always the 200-day moving average.
Script can show up to 4 SMA and 4 EMA all in one indicator in TV.
By default the SMAs and EMAs are 50d, 100d and 200d. A fourth is available in the preferences if you enable it.

Triple SMA + triple EMATriple SMA and triple EMA in one indicator.
Open preferences to enable a fourth if you need.
(Another of my script is "quadruple SMA and quadruple EMA" and enables the fourth moving averages by default)
Quadruple SMA + quadruple EMA8 moving averages in one indicator. There are 4 simple MA and 4 EMA, that you can disable individually.
It can be a bit overwhelming so I will publish a 3+3 variant shortly.
DepthHouse BTC Momentum Oscillator [BTC MO]NOTE: Only Works on BTC.
All testing was done on 1hr Timeframe
This is a experimental indicator - use at your own risk.
DepthHouse BTC Momentum Oscillator is an advanced tool to help determine Bitcoin Market Momentum.
---BTC MO SIgnals---
Signal Line: Generally, if the Signal Line is greater than 0, then there is more bullish momentum in the market
Tops & Bottoms: Signals used to help spot where BTC momentum may have topped or bottomed out
Possible Divergences: Used to help spot possible reversals on continuous trends
---oh92's Preset Setting---
Scalper: (20,11,17,6) Very reactive settings that I use while day trading. However, faster settings generally increase the chance of false signals(20,11,17,6)
Swing Trader: (5,25,55,10) Greatly reduces noise for my longer time trades. Generally makes 'tops' and 'bottoms' more accurate. Which can be a huge advantsge in spoting an earnly trend reversal
Custom: Allows user adjustments of all settings
---Built-in-Alerts---
Tops
Bottoms
Bearish Divergences
Bullish Divergences
Signal Line Crossovers
Try this indicator for FREE! Just leave a comment, or feel free to send me a PM

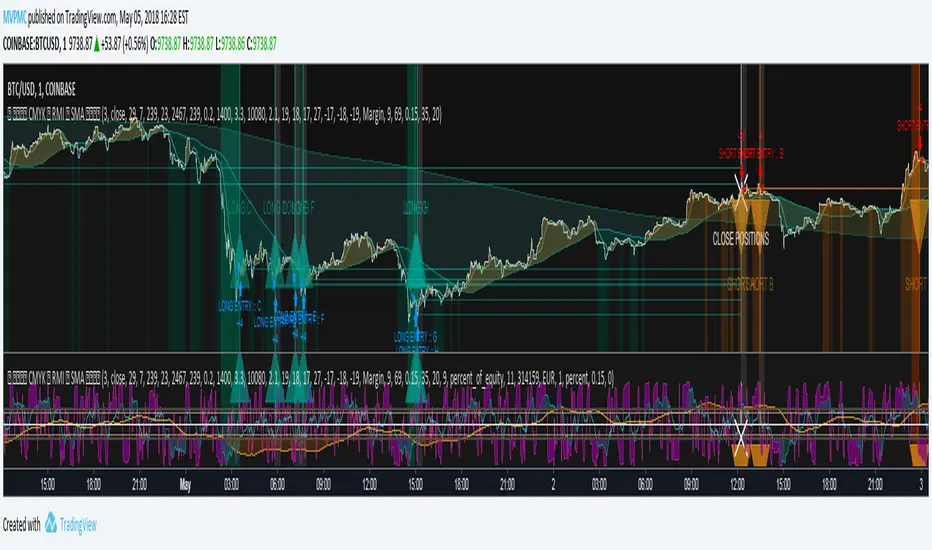
CMYK RMI SMA Study For Autoview▼ This is the study version of the script, For usage with Autoview
◊ Introduction
This script makes use of three RMI's and SMA's, that indicate Overbought/Oversold on different Periods that correspond with Frequency’s that move the market.
◊ Origin
This is an update on █▓▒░ CMYK ♦ RMI ♦ TRIPLE ░▒▓█
◊ Usage
This script is intended for Automated Trading on the 1-5 minute chart.
◊ Features Summary
Two Part Indicator
Strategy Type Selection
Three RMI's SMA's
Trend adjustment
Pump/Dump Entry Delay
Pyramiding
Ignore first entries
Take Profit
Stop Loss
Interval between Entries
Multiring Fix
Alert signal Seperation
◊ Community
Wanna try this script out ? need help resolving a problem ?
CMYK :: discord.gg
AUTOVIEW :: discordapp.com
TRADINGVIEW UNOFFICIAL :: discord.gg
◊ Setting up Autoview Alerts
Use the study version of this script, To set up The Alerts Autoview Picks up on.
Goto the CMYK Discord for support and Settings.
◊ Backtesting
Use the strategy version of this script for backtesting.
◊ Contact
Wanna try this script out ? need help resolving a problem ?
CMYK :: discord.gg
DepthHouse MTF Moving Average BundleDepthHouse MTF Moving Average Bundle combines the use of up to 5 Moving Averages into a single indicator.
Each moving average is entirely customizable.
You can select the MA type . Which the first version supports: (more will be added based on popularity)
SMA
EMA
SMMA
Hull MA
WMA
You can alter each Moving Average Length and offsets . Which the offset shifts the selected moving average x bars to the left or right
Multiple Time Frame Option
My favorite feature is the ability to lock the displayed moving averages to a specific time frame.
Say you wish to view the 30 min chart while keeping the 60 minute moving averages. Just turn this feature on!
This is a free indicator so please enjoy!
Leave questions and requests in the comments below!

SMA 50/100 / 200Couldn't find a simple moving average that combined the three i was looking for so I made it. Nothing special.

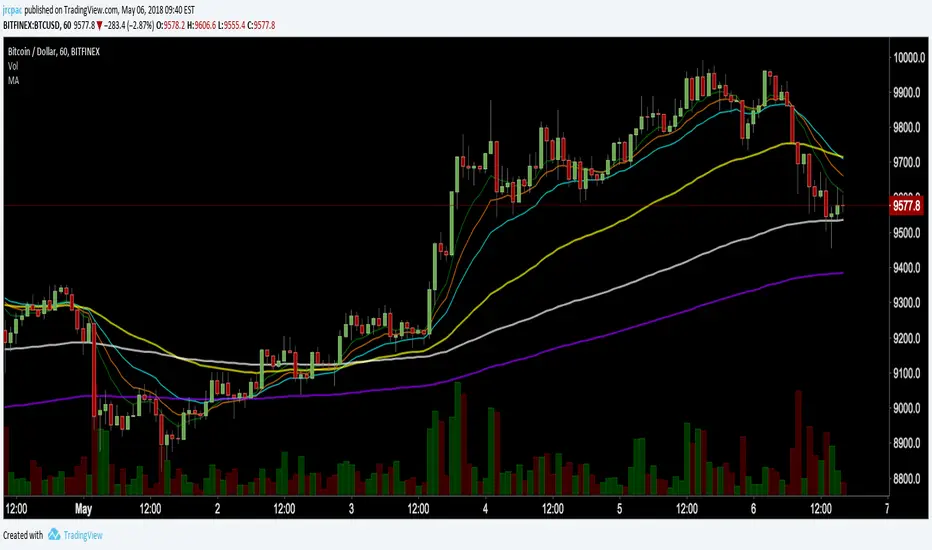
Moving Averages 20,50,128,200 (Exponential optional)4 moving averages in one indicator...
I found the 128 (over the 100) to be more in tune with the BTCUSD Bitfinex chart and more in tune with crypto in general...
With this indicator the stock setting is for Simple Moving Averages and if you want to use Exponential just check the box in the settings

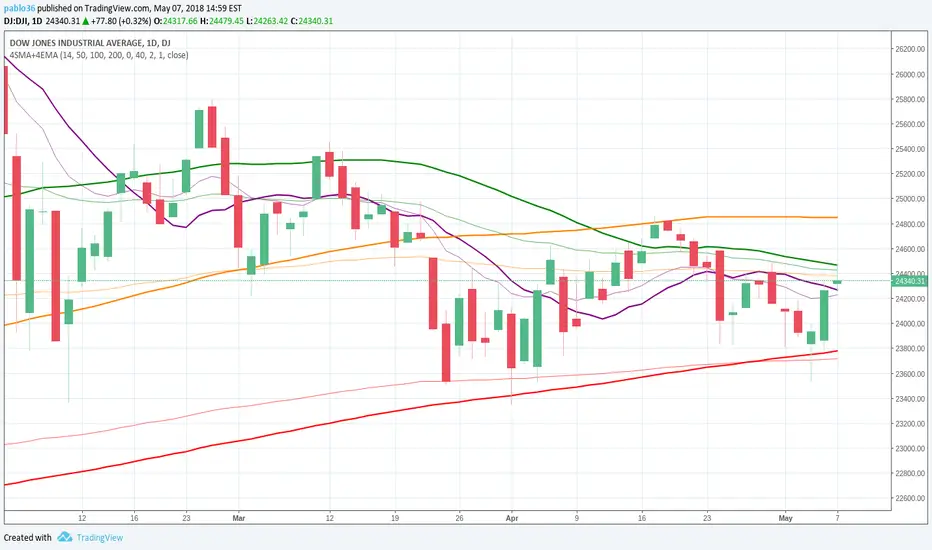
Binque's Multi-Moving Average Binque's Multi-Moving Average - One indicator with four simple moving average and four exponential moving averages, plus as a bonus a Day High moving average and a Day Low Moving Average.
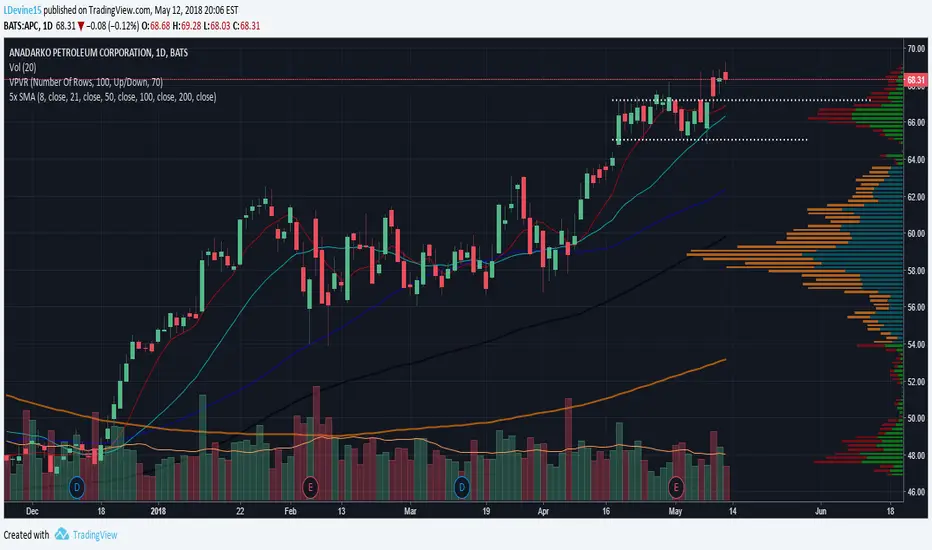
Simple Moving Average or MA(14), MA(50), MA(100) and MA(200) all in one indicator
Exponential Moving Average or EMA(8), EMA(14), EMA(20) and EMA(33) all in one indicator
Day High Moving Average - Tracks the Daily High versus most moving averages track the daily close.
Day Low Moving Average - Tracks the Daily Low versus most moving average track the daily close.
To Disable moving averages, Set the color to the chart background and then set the length to 1 and uncheck.
I Use the Daily High Moving Average to track upward resistance in a stock movement for Swing Trading.
I Use the Daily Low Moving Average to track my trailing stop in a stock movement for Swing Trading.

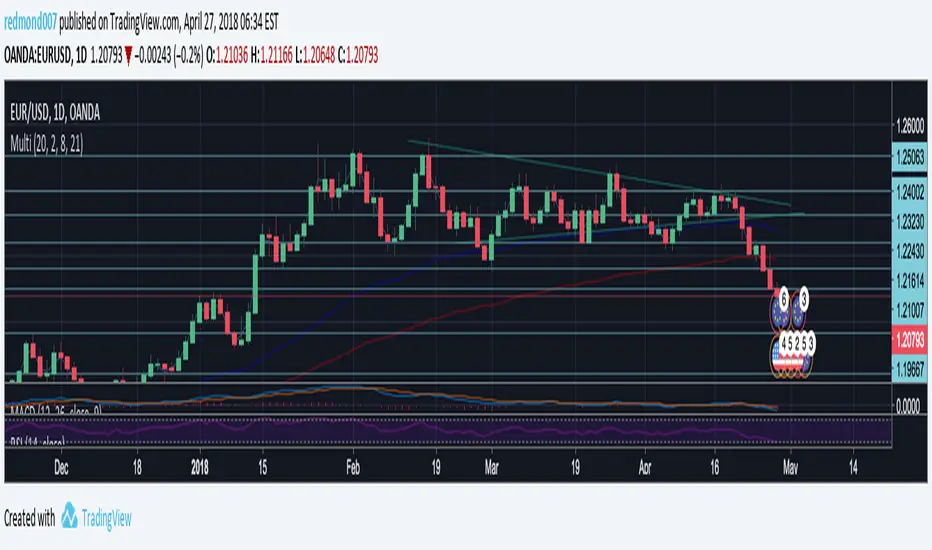
Multi Indicators v1 - 20 50 200 EMA/SMA, Bollinger Bands, VWAPMulti Indicators v1
20 50 200 EMA/SMA, Bollinger Bands, VWAP
These can be turned on and off
I'll be adding to this multi indicator in future updates
Volume HighlighterHighlight Candles or Volume Bars when volume breaks through the Moving Average, without volume obscuring your chart or candles! Also set an alert when volume breaks through its moving average! 1) Create an alert, 2) Select "Volume Highlighter" from the Alert Condition dropdown box, 3) select "Volume Bars" from the second dropdown, and 4) select "Volume MA Breakthrough" from the third dropdown.
Normal:
Choice of Highlighting Volume Bars and/or Candles on the chart:
Enjoy.
~jdhadwin

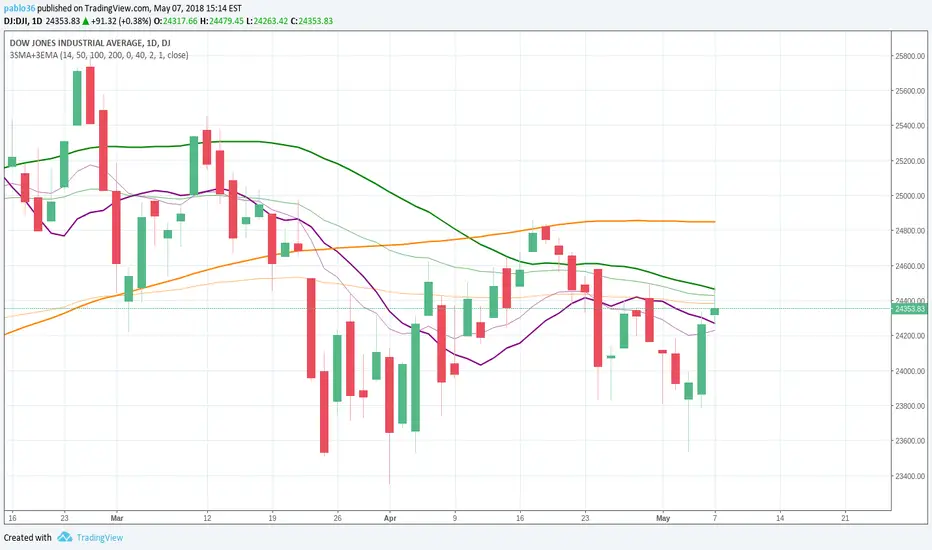
Double Bands, 3MA and 2SARMoving Averages (5,20,50), Double BollHello
Made an indicator set that includes
Moving Averages 5EMA, 20EMA, 50SMA, 200SMA
Fill between 5-20 MA and 20-50MA
Double Bollinger Bands
Parabolic SAR x2
Multiple indicators for the cost of 1
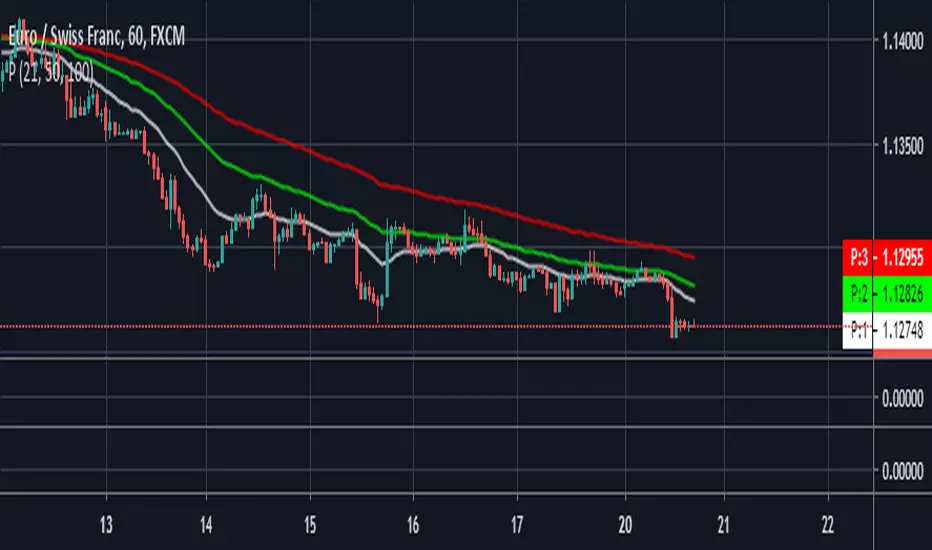
Moving Averages (10, 55, 100 EMAs, 200 SMA close)10, 55, 100 EMAs, 200 SMA close. Increasing line stroke, standard colors.

5MAShowing Multiple Moving Averages (5 MAs) in one 1 indicator. Very useful if you're still using free version of Trading View
