SmartMoneyConcept ProFlow StrategySmartMoneyConcept ProFlow is a complete SMC-based algo built for trending markets and clean volatility phases – especially on crypto pairs like BTC, ETH and perpetual futures.
It combines:
• Smart Money swing structure (BOS / CHoCH)
• Dynamic Support & Resistance levels
• Order Block–style gap detection
• Volatility normalization (ATR / Range / BBWidth)
• SuperTrend trend filter
• ATR & Volume-based exits, TP lock and session control
The goal: fewer random trades, more focused entries when structure + volatility + trend are in sync.
1. Core Idea
Smart Structure Levels (S/R)
– The strategy builds dynamic support/resistance using swing highs/lows.
– Breakouts above resistance or below support, with enough volatility (filter), become primary trade signals.
BOS / CHoCH Engine
– Tracks Break of Structure (BOS) and Change of Character (CHoCH).
– BOS up/down help define the current trend bias.
– CHoCH highlights potential reversals after a confirmed BOS in the opposite direction.
Order Block Gap Logic
– Detects displacement candles with gaps (based on ATR) to approximate OB-style “impulsive moves”.
– Bullish gaps can add confluence for long entries, bearish gaps for shorts.
Volatility-Aware Entries
– Uses normalized volatility (via ATR, Range or BBWidth).
– Filters out breakouts in dead, low-vol environments and focuses on moves with real expansion.
2. Trend & Risk Management Stack
SuperTrend Filter
– Optional “Only With SuperTrend Direction” to restrict entries to the current ST trend.
– ST flips can also force exits if you want to exit as soon as the main trend changes.
ATR-Based Stops & Trails
– ATR distance check to avoid ultra-tight stops that get chopped instantly.
– Three modes:
• StopOnly – classic fixed ATR stop.
• TrailOnly – trailing ATR-style stop.
• StopAndTrail – initial fixed stop that later trails with price.
Volume-Based Exits (Optional)
– Exit on extremely low volume (move losing participation).
– Or on opposite volume spikes (strong counter-pressure against your position).
– Or use Both for a more active volume management.
TP Lock Logic
– When unrealized profit reaches a chosen value, the position is closed and a “lock” can be applied.
– Use this lock to:
• block same-direction re-entries for that side, or
• allow them again depending on your preference.
3. Anti-Churn & Session Control
Anti-Churn Controls
– Minimum bars between entries.
– Cooldown after an ATR exit.
– Limit of max entries per bar.
Session Filter
– Restrict trading to a specific hourly window (e.g. main market session).
– Option to force close positions outside your active session.
– Handy for intraday traders who don’t want overnight or low-liquidity exposure.
4. SmartMoney Preset Modes
Preset Mode:
• EtherFlux – more flexible, for general breakout & volatility trading.
• SmartMoney – SMC-focused preset:
– Adjusted length, volatility filter and ATR settings.
– Option to disable exits from the strategy side (for manual risk control).
Switching presets automatically tunes multiple internal parameters so you don’t have to micromanage every input each time.
5. Visual Layer
This script has a complete visual suite to help you “read the tape”:
– Bar Colors by position and SuperTrend bias.
– Support / Resistance dots and lines (stepline style).
– Order Block markers (bullish / bearish gap labels).
– BOS / CHoCH labels to track structure shifts in real-time.
– Liquidation Zones (visual only)
• Approximate long and short liquidation areas based on assumed leverage.
• Shaded zones on the chart for quick liquidity map.
– Status Labels
• Session status (ACTIVE / OFF / DISABLED).
• Current position (LONG / SHORT / FLAT).
• TP Lock status (longs locked / shorts locked / no lock).
All visuals are designed for dark charts but also work on light themes with minor tweaks.
6. Quick Input Guide
• Levels Period & Volatility Filter – main structure sensitivity and breakout quality.
• Volatility Method – ATR / Range / BBWidth normalization for the vol filter.
• ATR Stop & Management – core risk rules: ATR multiplier, stop/trail mode, min ATR distance.
• SuperTrend Settings – trend bias and ST-flip exits.
• SmartMoney Preset – quick switch between EtherFlux and SmartMoney tuning.
• Volume Exits – low volume / opposite spike / both.
• Session Filter – hour-based trading window + optional forced flat outside session.
• Follow-Signal Mode – flip from long→short or short→long when signal reverses (signal-based rotation).
• TP Lock – secure profits at a fixed amount and optionally block same-direction re-entries.
• Liq Zones – visual only, for liquidity map (no direct trade logic).
How to Use (My Suggestion)
Start on 15m–4H charts for liquid pairs (BTC, ETH, majors).
Choose your preset:
– EtherFlux for more general breakout + vol trading.
– SmartMoney if you want stricter SMC behaviour.
Turn on SuperTrend + ATR stops for cleaner risk management.
Forward-test in replay / paper trading before using real capital.
Use the visual BOS/CHoCH + Liq Zones as context , not as blind signals.
Important
This is a backtest & research tool . It is not financial advice and does not guarantee profits. Always combine it with your own risk management, position sizing, and forward-testing before going live. Trading leveraged products and crypto can result in partial or full loss of capital.
Smcconcepts

RUSSFEST SMC Strategy V1.4RUSSFEST SMC Strategy V1.4 is a multi-timeframe Smart Money Concepts framework that builds a clean, rule-based view of market structure and then trades directly off that structure. It’s designed for traders who want to systematize SMC logic, keep their charts readable, and automate their trading.
Instead of relying on lagging oscillators, the strategy continuously tracks the active price leg, labels strong/weak highs and lows, and reacts to structural shifts in real time. The current timeframe leg is always drawn on your chart with a clear high, low, and midpoint, so you can instantly see whether price is trading in a discount or premium relative to the leg. Trade entries are driven by confirmed events aligned with directional bias, not by single-candle patterns.
A higher-timeframe (HTF) structure engine runs in the background and can be overlaid on your execution timeframe (e.g., 4H structure on a 15m chart). This HTF leg provides the primary bias and defines HTF discount/premium zones so that longs can be constrained to discounted areas of a bullish leg and shorts to premium areas of a bearish leg. An optional additional HTF bias can be turned on for traders who want an extra top-down filter before any position is allowed.
Risk management is fully structure-based. Stops are always placed beyond the current structure high/low with an optional buffer, so every trade is anchored to a meaningful swing point instead of arbitrary points. Take-profit logic is configurable:
Fixed RR – simple R-multiple targeting off the structure-based stop.
HTF Weak High/Low – targets the opposing side of the active HTF leg.
Opposite CHoCH – dynamically exits when structure flips against the position, effectively using the next structural shift as an exit rule.
Key Features:
Full SMC-style price leg tracking with strong/weak highs & lows and midpoint.
Multi-timeframe structure: overlay HTF leg on your LTF execution chart.
Primary and optional secondary HTF bias filters.
Discount/premium gating relative to the HTF leg (no “chasing” in the wrong zone).
Structure-anchored stop loss with three exit modes (Fixed RR, HTF target, Opposite CHoCH).
Day-of-week filters for filtering out any days that don't prove to be profitable.
This script is a structured SMC framework, not financial advice. Markets are risky; always forward-test, adjust parameters for your instrument and timeframe, and use position sizing that fits your own risk tolerance.

TitanEdge Algo Suite — 4H BTC & ETH (Delta Exchange Ready)TitanEdge Algo Suite — 4H BTC & ETH (Delta Exchange Ready)
TitanEdge Algo Suite is a next-generation trading system that fuses volatility-adaptive logic, order-block structure, SuperTrend direction filtering, and ATR-based exits into a single modular framework.
It’s engineered for 4-hour BTC and ETH swing trading, delivering institutional-grade entries, dynamic risk control, and precise exits.
⚙️ Core Features
1. Volatility Oscillator (0–100)
• Filters trades by volatility intensity.
• Uses ATR, Range, or Bollinger Band Width normalization.
• Trades trigger only when market volatility is high — filtering out sideways or weak trends.
• Ensures trades occur during real momentum expansions.
2. Breakout + Order Block Engine
• Detects pivot highs/lows to confirm authentic breakout levels.
• Identifies “smart money” gaps — institutional imbalance zones often leading to strong reversals or continuations.
• Captures both breakout continuations and order-block reversals.
• Works as a hybrid structure detector combining price action and volatility alignment.
3. SuperTrend Directional Filter
• Optional filter that only allows trades in the direction of the SuperTrend.
• Can automatically close trades when a SuperTrend flip occurs.
• Provides strong trend-following bias and helps avoid countertrend traps.
4. ATR-Based Stop & Trailing System
• Adaptive stop-loss and trailing logic that expands or tightens based on volatility.
• Supports three modes: StopOnly, TrailOnly, and StopAndTrail.
• Works in both ATR-based distance or percentage-based configuration.
• Keeps losing trades small and lets winning trades extend dynamically.
5. Volume-Based Exit Logic
• Detects low-volume exhaustion to identify momentum loss.
• Detects opposite-volume spikes as early reversal signals.
• Optional hybrid “Both” mode combines both detection methods for stronger reliability.
• Ideal for markets where volume surges indicate smart money exits or trap formations.
6. Session Filter & Anti-Churn Control
• Restrict trading hours (optional; not required for crypto).
• Prevents repeated signals and noise-based entries through minimum bars between trades.
• Cooldown logic ensures disciplined trading and avoids strategy overlap.
• Prevents multiple entries in a single bar and filters unconfirmed breakouts.
7. SmartMoney Preset Mode
• Institutional-grade configuration automatically adjusting volatility, ATR, and structural logic.
• Mimics smart money behavior by prioritizing clean structure and high liquidity volatility zones.
• Great for traders who want simplified institutional logic without manual tuning.
Optimized for 4H BTC & ETH
TitanEdge performs best on BTCUSDT and ETHUSDT pairs in the 4-hour timeframe.
The 4H chart captures high-volatility institutional swings, eliminates intraday noise, and provides clear order-block setups.
This timeframe aligns with BTC/ETH volatility cycles, providing consistent signals and cleaner trend confirmation.
Recommended settings for 4H charts:
• Levels Period: 25
• Volatility Filter: 20
• volatility oscillator Auto: disable ( it depend upon your plan test with Disable/enable)
• Volatility Method: BBWidth
• ATR Multiplier: 1.8
• ATR Stop %: 5
• SuperTrend ATR Length: 10
• SuperTrend Factor: 3
• ATR Mode: StopAndTrail
• Hold Bars: 1
• Volume Exit: Disable (Both)
• Session Filter: Off (Crypto runs 24/7)
Entry Logic
• Long Entry: Price breaks above resistance (pivot high), volatility above threshold, and optional SuperTrend confirmation.
• Short Entry: Price breaks below support (pivot low), volatility above threshold, and optional bearish SuperTrend confirmation.
• Additional Entry: Triggered by order-block gaps (smart money imbalances) in volatility expansion phases.
• Trades only when both direction and volatility align to ensure precision entries.
Exit Logic
• ATR Stop and Trail dynamically manage open trades.
• SuperTrend Flip forces exit on trend reversal.
• Volume Exit triggers when volume momentum drops or opposite spike occurs.
• Optional session close exit to flatten trades outside hours.
• Logic prevents premature exits with “Hold Bars” delay after entry.
Why You Need TitanEdge Algo Suite
• Trades only during high-volatility, strong-momentum phases — no false breakouts or choppy trades.
• ATR risk control automatically adjusts to each market’s volatility conditions.
• Identifies institutional order-blocks and clean breakouts for precise entries.
• SuperTrend filter adds directional bias, boosting win-rate consistency.
• Volume exit logic ensures profits are protected when market momentum fades.
• Works 24/7 across all major crypto pairs — fully automated and customizable.
• Built for 4H swing trades — fewer but higher-quality setups.
• Fully compatible with TradingView alerts and bot integration for hands-free execution.
How TitanEdge Makes Profit
• TitanEdge only trades during volatility expansion, when breakout continuation probability is statistically high.
• ATR dynamic stops prevent large losses by scaling protection according to real volatility.
• Trend filtering keeps positions aligned with major market flows.
• Order-block detection ensures entries are based on price structure rather than random signals.
• Volume-based exits secure profits early when momentum weakens.
• SmartMoney Preset provides optimal balance between trade frequency, accuracy, and drawdown control.
• The system compounds edge by maintaining trade discipline — fewer but stronger trades over time.
Delta Exchange Integration (TradingView Bot Ready)
TitanEdge is fully compatible with TradingView alert webhooks and can connect to Delta Exchange or any bot-supported broker.
Alert JSON message format:
{"symbol":"{{ticker}}","side":"{{strategy.order.action}}","qty":1,"trigger_time":"{{timenow}}","strategy_id":"code"}
qty 1 represent 1 lot so if you want to take trade with 5 lots or 0.05eth and write
{"symbol":"{{ticker}}","side":"{{strategy.order.action}}","qty":5,"trigger_time":"{{timenow}}","strategy_id":"code"}
Steps to automate:
Create an alert on TradingView using “Once Per Bar Close”.
Paste your bot or automation webhook URL.
Paste the JSON above as the message.
Configure your bot or API bridge (like PineConnector, AutoView, or WunderTrading) to route signals to Delta Exchange.
On Delta, use BTCUSD or ETHUSD Perpetual pairs with moderate leverage (3x–5x).
Enable Cross Margin for smooth drawdown handling.
Test first on Delta Testnet for safety.
Why 4H BTC & ETH Works Best
• 4H candles capture true volatility swings and filter lower-timeframe noise.
• Aligns with institutional liquidity cycles in BTC and ETH.
• ATR and volume-based stops perform optimally on larger bars.
• Smoother equity curve and less drawdown compared to intraday trading.
• Ideal for traders seeking structured, medium-term trades with high reward-to-risk.
Unique Edge
• Combines breakout, order-block, and volatility principles into one adaptive model.
• Incorporates volatility normalization (ATR/BBWidth) for multi-market adaptability.
• Dynamic ATR stops and trailing protect capital during unstable phases.
• Volume and trend exits create layered protection systems.
• 4H optimization eliminates noise and provides clear institutional alignment.
• SmartMoney preset auto-configures settings to mimic large-player behavior.
• Fully automated via webhooks — no manual execution required.
• Modular design lets you customize each component for different trading styles.
TradingView Bot Integration
TitanEdge is fully plug-and-play with all TradingView-compatible bots.
Each alert sends structured JSON data containing direction, symbol, and quantity, ready for execution on your connected broker.
You can route the data to:
• PineConnector (MT4/MT5 bridge)
• WunderTrading
• AutoView
• Custom Node/REST API handler
This makes TitanEdge a professional-grade strategy suitable for semi-automatic or fully automated crypto trading setups.
Professional Recommendations
• Timeframe: 4H
• Instruments: BTCUSDT, ETHUSDT
• Exchange: Delta Exchange (Perpetual Futures)
• Leverage: 3x–5x
• Session Filter: Off (crypto 24/7)
• Risk per trade: 0.5%–1% of total equity
• Alert Type: Once Per Bar Close
• Volatility Filter: 25–35 depending on market activity
• Always use realistic slippage and fees for backtests.
Summary
TitanEdge Algo Suite is a complete trading framework built to deliver institutional-quality precision with full automation support.
It captures powerful volatility expansions on 4H BTC and ETH charts using clean structure, adaptive stops, and directional trend filters.
Every feature — from entry logic to exits — is designed to protect capital and amplify performance through disciplined, volatility-aware execution.
TitanEdge is not just another script — it’s a professional-grade algorithm that combines volatility intelligence, structural precision, and adaptive risk control.
TitanEdge Algo Suite = Smart Logic × Trend Discipline × Adaptive Risk Control
Optimized for BTC & ETH on 4H charts. Built for traders who demand precision, control, and consistency.

Smart Risk - Three Institutional Models📘 Smart Risk – Three Institutional Entry Models
A precision-engineered institutional framework that blends liquidity, structure, and multi-time-frame confirmation.
🧠 Concept Overview
The Smart Risk indicator models how institutional traders and algorithms engineer entries around liquidity, imbalance, and structural shifts .
It unifies t hree distinct institutional entry models —each built around core Smart Money Concepts (SMC)—and enhances them with a Multi-Time-Frame Confluence (MTF) engine for directional alignment.
This tool doesn’t simply merge indicators.
It connects l iquidity sweeps, order-block reactions, breaker validation, and fair-value-gap mitigation into one cohesive trading logic—filtering every setup through trend, structure, and volume confirmation.
⚙️ How It Works
Setup #1 – Liquidity Sweep + Order Block Revisit + FVG Mitigation
Identifies engineered stop-hunts where price sweeps external liquidity and returns to a prior Order Block or Fair Value Gap (FVG).
Signals reversal-style entries with high probability of mean-reversion or mitigation.
Setup #2 – Supply/Demand + Mitigation / Breaker / FVG Continuation
Captures continuation trades inside trending structure.
When trend bias (via moving-average context) aligns with breaker or mitigation blocks, signals confirm institutional continuation sequences.
Setup #3 – Sweep + Classic FVG Reaction
Tracks clean displacement gaps following a liquidity sweep—ideal for scalpers and intraday reversals where imbalances act as magnets for price.
Each setup can be independently enabled or disabled from the panel.
A built-in signal-cooldown prevents repetitive triggers on the same leg.
🕒 Multi-Time-Frame Confluence
The new MTF module aligns lower-time-frame precision entries with higher-time-frame market structure.
When enabled, each setup only validates if the HTF trend confirms the same directional bias as the LTF pattern—e.g. a 5-minute bullish FVG signal requires a bullish 1-hour structure.
This ensures institutional logic respects global liquidity flow and avoids counter-trend traps.
MTF Controls:
• ✅ Enable MTF Confluence toggle
• ⏱️ Lower Time-Frame (LTF) selector (default 5 min)
• ⏱️ Higher Time-Frame (HTF) selector (default 1 hour)
• 🔄 Automatic SMA-based HTF trend detection
🎨 Visualization & Dashboard
• Order Block / Supply–Demand Zones — highlight institutional footprints
• Fair Value Gaps (FVGs) — reveal displacement inefficiencies
• Liquidity Sweeps (X / $) — mark engineered stops
• BOS & CHoCH — confirm structure continuation or reversal
• Compact Dashboard — live “Armed” state for each setup and MTF bias
Color-coded background cues emphasize active trade phases without clutter.
🧩 Core Algorithm Highlights
• Dynamic swing and pivot structure detection
• Breaker / Mitigation / Volume confirmation filters
• Fair-Value-Gap logic with directional alignment
• Cooldown control for signal throttling
• Multi-Time-Frame bias filter for contextual precision
⸻
📈 How to Use
1. Apply indicator to any asset or timeframe.
2. Select which institutional setups you want active.
3. Optionally enable MTF Confluence (5 min → 1 hr recommended).
4. Wait for BOS/CHoCH confirmation + zone alignment before entry.
5. Use OB and FVG zones for entry/exit planning with risk management.
⸻
💡 Originality Statement
This script introduces a multi-layered institutional logic engine that merges liquidity, mitigation, and imbalance behavior into a unified framework—augmented with time-frame synchronization and signal-cooldown management.
All logic, calculations, and visualization structure were built from scratch for this model.
It is not a mash-up of existing public indicators and offers measurable analytical value through MTF-aware trade validation.
⸻
⚠️ Disclaimer
This tool is intended for educational and analytical purposes only.
It does not provide financial advice or guaranteed trading outcomes.
Always back-test, validate setups, and apply proper risk management.

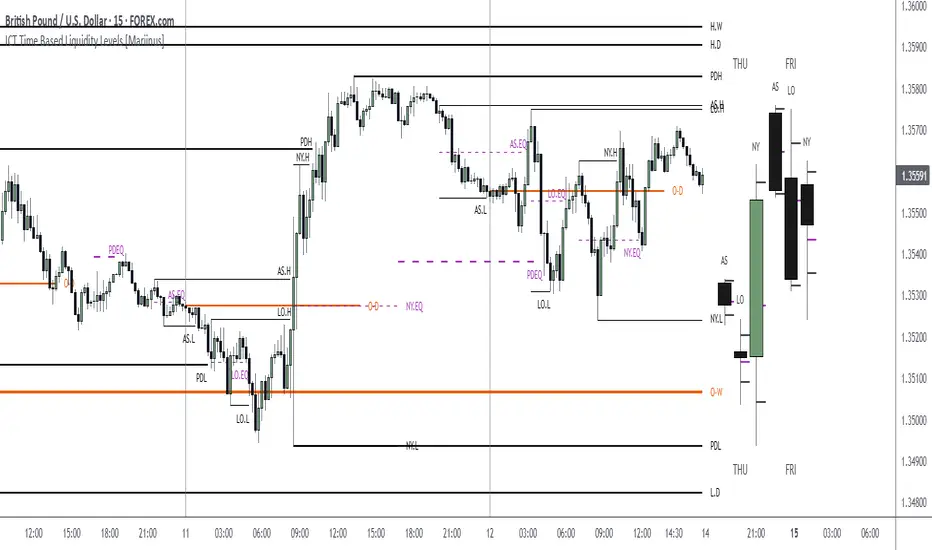
ICT Time Based Liquidity Levels [Mariinus]Indicator Overview – Inspired by ICT Concepts
This indicator helps you spot where liquidity rests and where major price moves are likely to begin or end — giving you clarity for both entries and exits.
Inspired by the teachings of the Inner Circle Trader (ICT), this tool builds on his philosophies and principles that have reshaped how traders view price action. One of the most powerful lessons that stuck with me personally is his quote:
"Time & Price, where it is Time first and then Price”
Another fundamental concept that underpins this tool is the idea that:
"Price is constantly moving in cycles from Premium to Equilibrium, from Equilibrium to Discount from Discount back to Premium."
With these core ideas in mind, this indicator was developed to help traders who are already using an ICT-based framework and focus on Kill Zones and by this on Time Based Liquidity.
In addition to plotting Session Highs and Lows on your chart, the ICT Time Based Liquidity Levels indicator also includes derived levels that provide deeper market insight. These include the Equilibrium of the full Session Range (High to Low) as well as the Equilibrium of the Wicks – offering a more nuanced view of price balance and potential turning points, in line with ICT’s core concepts.
To make sure your chart is not cluttered with lines, you can select which levels to show – and more importantly – you can plot Session Candles next to your Chart. Unlike standard time-based candles (e.g. 4H candles), these are “true” Session Candles that reflect the actual OHLC of trading Sessions, making it easier and clearer to see how Sessions interact with each other.
Next to Intraday Highs and Lows, the indicator will also plot Daily and Weekly Liquidity Pools above and below the Market, giving you insights to where Price is most likely heading towards.
You can set Alerts that trigger whenever one of these key levels is tagged, so you stay focused without staring at the screen all day.
⚠️ Important Disclaimer:
This is not a standalone trading plan.
This is not a buy or sell signal generator.
Instead, this tool is designed to support traders who follow ICT principles by helping them identify higher-probability PD Arrays – the key levels where setups are more likely to occur. If your trading plan includes looking for specific PD Arrays and structural frameworks taught by ICT, then this indicator is a visual aid to refine and focus your attention on the areas where your framework has a higher probability of playing out.
⚙️ Explanation of the Settings
You can combine up to 6 Sessions to monitor their respective levels while operating on a lower timeframe. You can define the timings and a long and short naming of those Sessions.
In the Days Section you can Set a lookback period to control how far back you want to calculate levels. Next to that you can select which Daily and or Weekly Levels you want to have shown on your Charts together with choosing their coloring, style and width.
In the Candles Section you can define how the Session Candles will look like which are plotted next to your Chart. When you have multiple Days of Session Candles it can come in handy to mirror image the Candles which will plot the Candles from right to left instead of the default left to right. In addition you can control how far the distance is between the Candles and your chart, the distance between Candles and Days and the thickness of those Candles. Next you can show or hide the Equilibrium of the total Session Range and the Equilibrium of the Wicks.
In the Lines Section you can specify which Session Levels you want to see on your Chart together with choosing their coloring, style and width.
In the Labels Section you can specify which Labels you want to show and how you want to show them.
In the Openings Section you can specify to show the Midnight Open and or Weekly Open. In addition you can add a divider to be able to distinguish between multiple Days or Weeks.
In the Alert Section you can specify for which Sessions you want to get notified when Key Levels are tagged. After setting this up, you need to set an alert via the Tradingview Alert function to really activate the Alert Function. Be aware that when you change your Alert setup, you need to setup the Tradingview Alert function again.
💡 Example Use Cases
These examples are for educational purposes only. This tool is not financial advice and should always be used in conjunction with your own trading plan—whether it involves Fair Value Gaps, Order Blocks, or a custom combination of ICT-based elements.
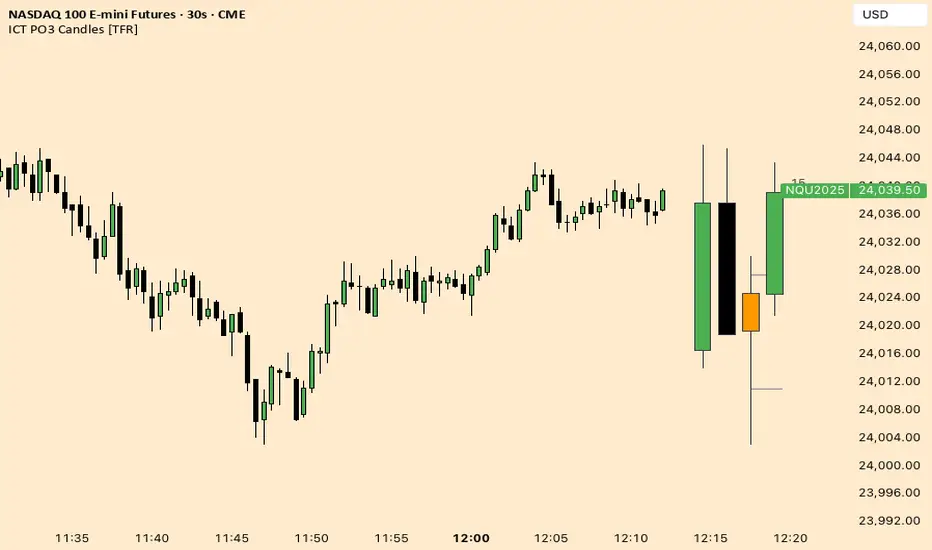
ICT Fractal HTF Candles [TFR]ICT HTF Fractal Candles
This indicator overlays higher timeframe (HTF) candles directly on your current chart for better multi-timeframe analysis. It plots up to the last 4 candles from a user-selected timeframe (5m, 15m, 1h, 4h, or 1D) with customizable body and border colors.
Features:
Displays the last 4 higher timeframe candles (open, high, low, close) on your current chart.
Customizable bullish, bearish, and inside close candle colors.
Optional midpoint wick lines (top and bottom) for precision reference, with extendable length for clarity.
Optional candle midpoint line for additional confluence.
Overlay mode allows you to see HTF structure without switching chart timeframes.
Timeframe label display so you always know which HTF is being plotted.
Offset control for shifting candle position.
Use Case:
This tool helps traders apply ICT concepts like PO3, midpoint reference levels, and multi-timeframe confirmation without constantly switching between charts. It’s particularly useful for identifying liquidity zones, midpoint reactions, and higher timeframe market structure while executing on a lower timeframe.
SMC Suite - OB . Breaker . Liquidity Sweep . FVGSMC Suite — Order Blocks • Breaker • Liquidity Sweep • FVG
What it does:
Maps institutional SMC structure (OB → Breaker flips, Liquidity Sweeps, and 3-bar FVGs) and alerts when price retests those zones with optional r ejection-wick confirmation .
Why this isn’t “just a mashup”?
This tool implements a specific interaction between four classic SMC concepts instead of only plotting them side-by-side:
1. OB → Breaker Flip (automated): When price invalidates an Order Block (OB), the script converts that zone into a Breaker of opposite bias (bullish ⇄ bearish), extends it, and uses it for retest signals.
2. Liquidity-Gated FVGs : Fair Value Gaps (3-bar imbalances) are optionally gated—they’re only drawn/used if a recent liquidity sweep occurred within a user-defined lookback.
3. Retest Engine with Rejection Filter : Entries are not whenever a zone prints. Signals fire only if price retests the zone, and (optionally) the candle shows a rejection wick ≥ X% of its range.
4. Signal Cooldown : Prevents spam by enforcing a minimum bar gap between consecutive signals.
These behaviors work together to catch the sequence many traders look for: sweep → impulse → OB/FVG → retest + rejection.
Concepts & exact rules
1) Impulsive move and swing structure
• A bar is “ impulsive ” when its range ≥ ATR × Impulsive Mult and it closes in the direction of the move.
• Swings use Pivot Length (lenSwing) on both sides (HH/LL detection). These HH/LLs are also used for sweep checks.
2) Order Blocks (OB)
• Bullish OB : last bearish candle body before an i mpulsive up-move that breaks the prior swing high . Zone = min(open, close) to low of that candle.
• Bearish OB : last bullish candle body before an impulsive down-move that breaks the prior swing low . Zone = high to max(open, close).
• Zones extend right for OB Forward Extend bars.
3) Breaker Blocks (automatic flip)
If price invalidates an OB (closes below a bullish OB’s low or above a bearish OB’s high), that OB flips into a Breaker of opposite bias:
• Invalidated bullish OB → Bearish Breaker (resistance).
• Invalidated bearish OB → Bullish Breaker (support).
Breakers get their own style/opacity and are used for separate Breaker Retest signals.
4) Liquidity Sweeps (decluttered)
• Bullish sweep : price takes prior high but closes back below it.
• Bearish sweep : price takes prior low but closes back above it.
Display can be tiny arrows (default), short non-extending lines, or hidden. Old marks auto-expire to keep the chart clean.
5) Fair Value Gaps (FVG, 3-bar)
• Bearish FVG : high < low and current high < low .
• Bullish FVG : low > high and current low > high .
• Optional gating: only create/use FVGs if a sweep occurred within ‘Recent sweep’ lookback.
6) Retest signals (what actually alerts)
A signal is true when price re-enters a zone and (optionally) the candle shows a rejection wick:
• OB Retest LONG/SHORT — same-direction retest of OB.
• Breaker LONG/SHORT — opposite-direction retest of flipped breaker.
• FVG LONG/SHORT — touch/fill of FVG with rejection.
You can require a wick ratio (e.g., bottom wick ≥ 60% of range for longs; top wick for shorts). A cooldown prevents back-to-back alerts.
How to use
1. Pick timeframe/market : Works on any symbol/TF. Many use 15m–4h intraday and 1D swing.
2. *Tune Pivot Length & Impulsive Mult:
• Smaller = more zones and quicker flips; larger = fewer but stronger.
3. Decide whether to gate FVGs with sweeps : Turn on “Require prior Liquidity Sweep” to focus on post-liquidity setups.
4. Set wick filter : Start with 0.6 (60%) for cleaner signals; lower it if too strict.
5. Style : Use the Style / Zones & Style / Breakers groups to set colors & opacity for OB, Breakers, FVGs.
6. Alerts : Add alerts on any of:
• OB Retest LONG/SHORT
• Breaker LONG/SHORT
• FVG LONG/SHORT
Choose “Once per bar close” to avoid intrabar noise.
Inputs (key)
• Swing Pivot Length — swing sensitivity for HH/LL and sweeps.
• Impulsive Move (ATR ×) — defines the impulse that validates OBs.
• OB/FVG Forward Extend — how long zones project.
• Require prior Liquidity Sweep — gate FVG creation/usage.
• Rejection Wick ≥ % — confirmation filter for retests.
• Signal Cooldown (bars) — throttles repeated alerts.
• Display options for sweep marks — arrows vs short lines vs hidden.
• Full color/opacity controls — independent palettes for OB, Breakers, and FVGs (fills & borders).
What’s original here
• Automatic OB → Breaker conversion with separate retest logic.
• Liquidity-conditioned FVGs (FVGs can be required to follow a recent sweep).
• Unified retest engine with wick-ratio confirmation + cooldown.
• Decluttered liquidity visualization (caps, expiry, and non-extending lines).
• Complete styling controls for zone types (fills & borders), plus matching signal label colors.
🔹 Notes
• This script is invite-only.
• It is designed for educational and discretionary trading use, not as an autotrader.
• No performance guarantees are implied — always test on multiple markets and timeframes.

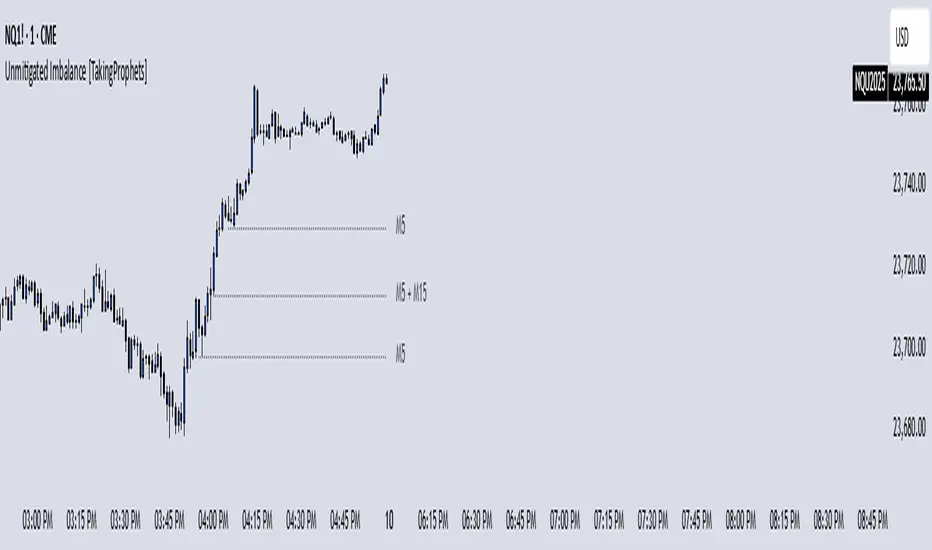
Unmitigated Imbalances [TakingProphets] (High Timeframe)Unmitigated Imbalances
Unmitigated Imbalance is designed to automatically detect and display active Fair Value Gaps (FVGs) across multiple higher timeframes and your current chart. It only keeps the ones that remain unmitigated, helping you clearly see where price has “unfinished business” and potential liquidity draw areas. The tool extends these levels forward until they are tagged according to your chosen mitigation criteria, then removes them automatically.
The indicator uses the classic 3-bar FVG structure:
– Bearish FVG forms when the low of the third candle back is above the high of the first candle.
– Bullish FVG forms when the high of the third candle back is below the low of the first candle.
– Each detected gap must meet a minimum size threshold, which is determined automatically from the Sensitivity setting and adjusted for the symbol type.
Higher timeframes (up to 4) can be plotted simultaneously with your current chart’s gaps. The script merges overlapping levels from different timeframes into one clean label, showing all the contributing timeframes together (for example: M15 + H1 + H4). This makes it easy to spot high-confluence levels without cluttering your chart.
Key features
– Multi-timeframe detection: up to 4 custom HTFs plus your current chart.
– Automatic gap size filtering based on chosen Sensitivity (High, Medium, Low).
– Choice of Wick or Close-based mitigation logic.
– Lookback control: 1 Day, 1 Week, 1 Month, or Max.
– Combined labels for overlapping gaps with clear timeframe tags.
– Separate color and style settings for each timeframe’s bullish and bearish gaps.
– Labels can be positioned Left, Right, or Center Above for maximum clarity.
– Automatic line extension until mitigation or until they exceed the lookback period.
How to use
Select your desired higher timeframes in the HTF1–HTF4 settings.
Choose the Sensitivity level to control the minimum gap size detected.
Decide on Wick or Close mitigation according to your trading rules.
Use the Lookback setting to limit how far back the script checks for gaps.
Watch for levels where multiple timeframe labels are stacked — these can carry greater significance.
Incorporate the levels into your existing strategy, using them as context rather than entry signals.
Practical notes
– Current timeframe gaps reset each trading day to keep the chart relevant to intraday bias.
– Higher timeframe gaps remain until mitigated or until the lookback period expires.
– Large lookback periods with multiple HTFs can increase chart load — adjust settings as needed.
– This indicator is a mapping and context tool, not a signal generator. Always apply it alongside your own analysis.
SMC Pro - Smart Money Concepts🎯 SMC Pro - Complete Smart Money Concepts Trading System with Trade Alerts
The Most Comprehensive SMC/ICT Indicator Built for Real Traders
After extensive research into what retail and prop firm traders actually need, I've created SMC Pro - a complete Smart Money Concepts indicator that solves the biggest problems with existing SMC tools.
🚀 What Makes This Different:
✅ COMPLETE TRADE SETUP ALERTS - Not just structure breaks! Get full trade setups with:
* Entry, Stop Loss & Target Prices
* Risk/Reward Calculations
* 5-Point Confluence Scoring
* Visual Trade Labels on Chart
✅ INTELLIGENT FILTERING - No more chart spam:
* Minimum structure size filter (ATR-based)
* Minimum bars between signals
* Volume confirmation for order blocks
* Clean, actionable signals only
📊 Core Features:
1. Market Structure Analysis
* Break of Structure (BOS) with smart filtering
* Change of Character (CHoCH) detection
* Clear directional bias identification
* Prevents excessive signal clustering
2. Order Blocks
* Volume-confirmed institutional zones
* Automatic mitigation tracking
* Entry points for trade setups
3. Fair Value Gaps
* ATR-based size filtering
* Automatic fill detection
* Confluence factor for trades
4. Liquidity Zones
* Buy-side & Sell-side liquidity mapping
* Sweep detection with alerts
* Target zones for trades
5. Risk Management Integration
* Automatic R:R calculation
* Position sizing guidance
* Minimum R:R filtering (default 2:1)
🎯 5-Point Trade Confluence System:
1. Market structure alignment
2. Recent structure break (BOS/CHoCH)
3. Order block at current price
4. Fair value gap support
5. Liquidity target available
Minimum score of 3/5 required for trade alerts (adjustable)
⚙️ Smart Settings:
* Swing Length: 10 (default) - adjust for sensitivity
* Min Bars Between Signals: 20 - prevents clustering
* Min Structure Size: 1.0 ATR - filters noise
* Min Confluence Score: 3/5 - quality control
* Target R:R: 2:1 minimum - proper risk management
📱 Alert Types:
* 🎯 Trade Setup Alerts - Complete entry/exit plans
* ✅ Structure Breaks - BOS & CHoCH notifications
* 📊 Order Block Touch - Price at key zones
* 💧 Liquidity Sweeps - Stop hunts detected
💡 Pro Tips:
* Start with default settings
* Use on 15m+ timeframes for cleaner signals
* Increase confluence requirement for prop firm trading
* Enable volume confirmation for higher quality OBs
* Dashboard shows real-time setup status
🔧 If You Get Too Many Signals:
* Increase Swing Length to 15-20
* Increase Min Bars Between to 30-50
* Increase Min Structure Size to 1.5 ATR
* Raise Min Confluence Score to 4 or 5
This indicator is the result of solving real problems traders face with SMC/ICT concepts. It's designed to give you clean, actionable trade setups - not just mark up your chart with zones.
Built with Pine Script v6 for maximum performance and reliability.
Trade with confluence. Trade with confidence. Trade smart. 🎯

FVG 9:31–10:00 AM ETFVG 9:31–10:00 AM ET - Script Description
What This Script Does
This indicator finds **Fair Value Gaps (FVGs)** that form during the first 29 minutes of the U.S. stock market (9:31 AM to 10:00 AM Eastern Time). A Fair Value Gap is a price imbalance where there's a gap between candles that often becomes an important support or resistance level.
Key Features:
- **Time Window**: Only looks for FVGs between 9:31-10:00 AM ET (most important opening period)
- **One Per Day**: Finds only the first FVG that forms in this time window each day
- **Visual Display**: Draws a purple box around the gap with a clear "FVG" label
- **Price Tracking**: Monitors when price comes back to test the gap level
- **Alert System**: Sends notifications when price returns to the FVG zone
How FVGs Are Detected:
- **Bullish FVG**: When there's a gap up (low of middle candle is above high of 3rd candle back)
- **Bearish FVG**: When there's a gap down (high of middle candle is below low of 3rd candle back)
The 9:31-10:00 AM window is chosen because this is when institutions and algorithms create their biggest price moves right after market open, making these gaps very reliable.
Customization Options
User Settings
Extend FVG Box (Bars)
- **What it does**: Makes the purple box longer to the right
- **Default**: 0 (box ends right after the gap forms)
- **Options**: Any number from 0 to 100+
- **When to use**:
- Keep at 0 for clean historical view
- Set to 10-20 to track the gap during the current session
- Set higher for longer reference
Code Settings (Can Be Changed)
Time Window
- **Start**: 9:31 AM Eastern Time
- **End**: 10:00 AM Eastern Time
- **Can modify**: Change the hour/minute numbers in the code
Visual Style
- **Color**: Purple with see-through background
- **Label**: Shows "FVG" text in white
- **Can modify**: Change colors and transparency in the code
How to Use:
Setup
Chart Settings
1. Use 1-minute, 5-minute, or 15-minute charts (works best on these timeframes)
2. Apply to liquid markets like ES, NQ, major stocks, or forex pairs
3. Set the "Extend FVG Box" to your preference (start with 0 or 10)
What You'll See
- A purple box appears when an FVG forms during 9:31-10:00 AM
- Box shows the exact price levels of the gap
- "FVG" label appears on the box
- Only one FVG per day will be marked
Trading Strategies
Basic FVG Trading
1. **Wait for Formation**: Let the purple box appear during 9:31-10:00 AM
2. **Watch Price Movement**: See if price moves away from the gap
3. **Enter on Retest**: When price comes back to the purple box area, consider entering
4. **Trade Direction**:
- Bullish FVG = look for long opportunities when price retests
- Bearish FVG = look for short opportunities when price retests
Entry Methods
- **Bounce Play**: Enter when price touches the FVG box and bounces away
- **Break Play**: Enter if price strongly breaks through the FVG box
- **Rejection Play**: Enter opposite direction if price gets rejected at the FVG
Risk Management
Stop Losses
- Place stops just outside the FVG box (a few ticks beyond the gap)
- If trading a bounce, stop goes on opposite side of the gap
- If trading a break, stop goes back inside the gap
Position Sizing
- Start small until you understand how FVGs work in your market
- Bigger gaps = smaller position size (more risk)
- Smaller gaps = can use larger position size
Profit Targets
- Take profits at obvious levels like round numbers, previous highs/lows
- Consider taking half profits at 1:1 risk/reward ratio
- Let some position run if the move is strong
Best Practices
When It Works Best
- High-volume stocks and futures (ES, NQ work great)
- Normal market days without major news during the 9:31-10:00 window
- When there's clear institutional activity in the opening period
When to Be Careful
- Low-volume stocks or markets
- Major economic news releases during the time window
- Market holidays when volume is low
- Very choppy or sideways days
Alert Usage
- The script will alert you when price comes back to test the FVG
- Don't trade the alert blindly - always check the current market situation
- Use the alert as a heads-up to start watching the setup more closely
Tips for Success
- The earlier the FVG forms in the 9:31-10:00 window, often the more significant it is
- FVGs that form with high volume are usually more reliable
- Always consider the overall market direction - don't fight the main trend
- Practice on paper first to understand how FVGs behave in your chosen market
🔗 Works Best With:
✅ Liquidity Levels — Smart Swing Lows: Spot key structural lows that can fuel stop hunts and reversals.
✅ ICT Turtle Soup — Liquidity Reversal: Add a classic reversal pattern to your toolkit to catch fakeouts cleanly.
✅ ICT SMC Liquidity Grabs and OBs- Liquidity Grabs, Order Block Zones, and Fibonacci OTE Levels, allowing traders to identify institutional entry models with clean, rule-based visual signals.
This script is most valuable for day traders who want to catch institutional moves right after market open, but it can also help swing traders identify important intraday levels.
✅ ICT Macro Zones (Grey Box Version)- It tracks real-time highs and lows for each Silver Bullet session.
✅ Weekly Opening Gap (cryptonnnite)

Midnight 30min High/LowMidnight 30min High/Low — Overnight Liquidity Range Tracker
Capture the Overnight Session: A Strategic Level Identification Tool from Professional Trading Methodology
This indicator captures the high and low prices during the critical 30-minute midnight session (12:00-12:30 AM EST) and projects these levels forward as key support and resistance zones. These overnight ranges often contain significant liquidity and serve as crucial reference points for intraday price action, representing areas where institutional activity may have established important levels.
🔍 What This Script Does:
Identifies Critical Overnight Session Levels
- Automatically detects the 12:00-12:30 AM EST session window
- Captures the highest and lowest prices during this 30-minute period
- Projects these levels forward for multiple trading days
Creates Dynamic Support/Resistance Zones
- Extends midnight high/low levels as horizontal lines with customizable projection periods
- Fills the area between high and low to create a visual trading range
- Updates automatically each trading day with new overnight levels
Provides Clear Visual Reference Points
- Optional session start markers (●) highlight when the midnight session begins
- Color-coded lines distinguish between high and low levels
- Transparent fill area creates an easy-to-identify trading zone
Real-Time Level Tracking
- Updates levels in real-time during the active midnight session
- Maintains historical levels for reference and backtesting
- Compatible with data window for precise level values
⚙️ Customization Options:
Extend Days (1-30):** Control how many days forward the levels are projected (default: 5 days)
High Line Color:** Customize the midnight high line color (default: blue)
Low Line Color:** Customize the midnight low line color (default: orange)
Fill Color:** Adjust the transparency and color of the range area (default: light aqua, 80% transparency)
Show Session Markers:** Toggle yellow session start indicators on/off (default: enabled)
💡 How to Use:
Deploy on lower timeframes (1m-15m) for precise level identification and reaction monitoring**
Watch for key price interactions:
- Rejection at midnight high levels (potential resistance)
- Bounce from midnight low levels (potential support)
- Range-bound trading between the high and low levels
Combine with liquidity concepts:
- Monitor for stop hunts above/below these levels
- Look for false breakouts that snap back into the range
- Use as confluence with other ICT concepts like FVGs and Order Blocks
Strategic Applications:
- Range trading between midnight levels
- Breakout confirmation when price closes decisively outside the range
- Support/resistance validation for entry and exit planning
🔗 Combine With These Tools for Complete Market Structure Analysis:
✅ First FVG — Opening Range Fair Value Gap Detector.
✅ ICT Turtle Soup (Liquidity Reversal)— Spot stop hunts and false breakout scenarios
✅ ICT Macro Zones (Grey Box Version)- It tracks real-time highs and lows for each Silver Bullet session
✅ ICT SMC Liquidity Grabs and OBs- Liquidity Grabs, Order Block Zones, and Fibonacci OTE Levels, allowing traders to identify institutional entry models with clean, rule-based visual signals.
Together, these tools create a comprehensive Smart Money Concepts (SMC) framework — helping traders identify, anticipate, and capitalize on institutional-level price movements with precision and confidence during critical overnight sessions.

TradeJorno - Time + Price Levels
Tired of manually drawing and updating important ICT or SMC time and price levels on your charts every day?
Here’s an indicator to draw important TIME and PRICE levels automatically.
Here’s what you can highlight in realtime on your charts:
1. Previous major highs and lows
⁃ Previous daily and weekly highs and low
- Weekly dividing lines
2. Session highs/lows
⁃ Plot the high and low of Asia and London sessions.
⁃ Customise the timeframe and appearance on the chart.
- Previous session settlement price.
3. Various price levels
⁃ Pre-market opening prices : midnight, 7:30 and 8:30
⁃ Regular market opening prices: 9:30, 10:00, 14:00
- end of session settlement prices
4. Market opening range high and low
⁃ Lines extending throughout the current session
⁃ Customise the timeframe and appearance on the chart.
5. ICT Macro times
- Draw customisable vertical lines and labels to indicate the start of each ICT macro
period.
Let us know in the comments below if there’s anything else we need to add!

Plyo Tap'n'Slap (TnS) by OutOfOptionsThe Model
This Strategy/Model takes advantage of the strongest trend signature in the market, which is also the most basic move in the market. This basic move is what most traders consider to be a staircase, or trendline. ICT traders call this setup a “unicorn” which is just another word for when an Order block overlaps with an FVG. The beauty of this model is that you don't need to know what ANY of these things are.
The entry comes when a candles High or Low overlaps with a FVG that is at least 3 points away from both edges of the FVG. If the candle is too close to the edge then the setups is invalid (see rules for more). TO find a candle that overlaps with the FVG it also can not cut through any other price action, for example, A potential entry cant cut through another wick to make it overlap with the FVG. (see rules for more)
TnS gets its TP by analyzing what is called the "OG TP" The OG TP is determined by looking for the first tapped into the FVG, then looking for an immediate High or Low to the left of the candle that first tapped the FVG. IF there is no immediate High or low next to the candle that first tapped the FVG, then target the candle itself (see rules for more). IF the "OG TP" has already been hit before TnS gets its entry, then look to the left of the TnS entry candle for the immediate High or Low next to it. If there is no immediate High or Low next to the TnS Entry candle, then target the Entry candles, High or Low (see rules for more)
Model Rules
Overlapping H/L MUST be at least 3 points away from both edges of the FVG,
Overlapping H/L cannot cut through PA to make it overlap with the FVG,
Entries can only be the highest overlapping high or the lowest overlapping low,
If TnS Has already played out within the FVG then it should no longer be used,
If the FVGs OG TP has already been hit then use the TnS entry to re-align for your target,
No using NWOGs/NDOGs for setups. A NWOG is NOT the same thing as an FVG so this example
V2 Rules
If its a Bullish FVG then you need a bearish candle H/L that overlaps for your entry
If its a Bearish FVG then you need a bullish candle H/L that overlaps for your entry
Indicator Functionality
The indicator uses specific logic to identify FVGs that match the requirements of the TnS model, ensuring at least one valid entry exists per the default V1 rules of the model, or the stricter V2 rules if configured via settings. If entries (up to 2 per model rules) are identified, the FVG is highlighted, and each entry and its stop loss is marked with a line. The line styles, colors, and FVG color, which can vary depending on whether the entry is bullish or bearish, are configurable via settings.
Once the FVG is tapped into, the indicator will highlight the take profit spot and list all applicable entries, stop losses, and take profits in a table, the position and presence of which can be controlled within the indicator settings. When price action hits either stop loss or take profit, all elements are removed from the chart to avoid clutter.
Additionally, the indicator allows filtering of entries based on Risk/Reward (R:R), filtering out entries where take profit is less than the model stop loss and entries for which the stop loss resides inside the FVG itself. To help visualize setups where the FVG is outside the current visual range, the indicator has options to extend the FVG box and lines by a configurable number of bars. Once the FVG is tapped, the indicator will automatically extend lines/FVG box to the bar that tapped the FVG plus the configured number of bars.

ICT SMC Liquidity Grabs and OBsICT SMC Liquidity Grabs + Order Blocks + Fibonacci OTE Levels
A High-Probability Entry Engine for Smart Money Concept Traders
This script combines three powerful Smart Money Concepts (SMC) into a single tool: Liquidity Grabs, Order Block Zones, and Fibonacci OTE Levels, allowing traders to identify institutional entry models with clean, rule-based visual signals.
It’s designed to simplify SMC trading by highlighting confluence zones where price is likely to reverse or continue — with clear visual zones, entry arrows, and take profit projections.
🔍 What This Script Does:
Detects Liquidity Grabs
Identifies when price sweeps above/below the highest high or lowest low within a user-defined lookback period and closes back inside.
Plots orange labels on the chart to signal potential liquidity events (LG-H / LG-L).
Plots Order Blocks After Liquidity Grabs
After a liquidity grab, the script looks for displacement candles (strong bullish or bearish moves) and draws highlighted OB zones extending several bars to the right.
These zones represent potential institutional footprints for price reversals.
Draws Fibonacci OTE Levels (Optimal Trade Entry)
Uses recent swing high and low pivots to automatically calculate OTE zones (default: 62% and 75% retracement levels).
Draws these retracement zones for both bullish and bearish setups.
Marks Valid OTE Entry Zones
Buy/Sell zones only trigger when:
A liquidity grab occurs,
Price enters the OTE zone,
And a strong confirming candle is present.
Plots green/red arrows for valid buy/sell OTE entries.
Auto-Draws Take Profit Zones
TP1 = Previous swing high/low
TP2 = Risk-based R-multiplied extension (e.g., 1.5R — customizable)
Alerts
Triggers alerts when valid buy or sell OTE setups are detected.
⚙️ Customization Features:
Toggle each feature: Liquidity Grabs, Order Blocks, Fibonacci OTE levels
Set Fibonacci retracement percentages (e.g., 0.62 / 0.75)
Adjust lookback window for liquidity detection
Customize the take-profit multiplier (R-based)
Full control over visuals: colors, labels, and lines
💡 How to Use:
Use this script to scan for high-confluence trade setups based on Smart Money principles.
Combine with session timing (e.g., New York open), major swing structure, or Kill Zone windows for maximum edge.
Look for arrows inside OB zones or OTE levels following liquidity sweeps for cleaner entries.
🔗 Works Best With:
✅ First FVG — Opening Range Fair Value Gap Detector: Identify early inefficiencies to set the narrative for the day.
✅ Liquidity Levels — Smart Swing Lows: Spot key structural lows that can fuel stop hunts and reversals.
✅ ICT Turtle Soup — Liquidity Reversal: Add a classic reversal pattern to your toolkit to catch fakeouts cleanly.
Together, these tools build a complete Smart Money ecosystem for entry precision, risk management, and price behavior forecasting.

ICT Turtle Soup Ultimate V2📜 ICT Turtle Soup Ultimate V2 — Advanced Liquidity Reversal System
Overview:
The ICT Turtle Soup Ultimate V2 is a next-generation liquidity reversal indicator built on the principles of smart money concepts (SMC) and the classic ICT Turtle Soup setup. It is designed to detect false breakouts (liquidity grabs) at key swing points, enhanced by proprietary logic that filters out low-quality signals using a combination of trend context, kill zone timing, candle wick behavior, and multi-timeframe imbalance zones.
This tool is ideal for intraday traders seeking high-probability entry signals near liquidity pools and imbalance zones — where smart money makes its move.
🔍 What This Script Does
🧠 Liquidity Grab Detection (Turtle Soup Core Logic)
The script scans for recent swing highs/lows using a user-defined lookback.
A signal is generated when price breaks above/below a previous swing level but closes back inside — indicating a liquidity run and likely reversal.
A special Wick Trap Mode enhances this logic by detecting long-wick fakeouts — where the wick grabs stops but the candle body closes opposite the breakout direction.
📉 Trend Filter with ATR Buffer
Optional trend filter uses a simple moving average (SMA) to gauge market direction.
Instead of hard filtering, it applies an ATR-based buffer to allow for entries near the trend line, reducing signal suppression from micro-fluctuations.
🕰️ Kill Zone Session Filtering
Only show signals during institutional trading hours:
London Session
New York AM
Or any custom user-defined session
Helps traders avoid low-volume hours and focus on where stop hunts and price expansions typically occur.
🧱 Multi-Timeframe FVG Confluence (Optional)
Signal validation is strengthened by checking if price is within a higher timeframe Fair Value Gap — commonly used to identify imbalances or inefficiencies.
Filters out setups that lack underlying displacement or order flow justification.
🎨 Visual Feedback
Plots 🔺 bullish and 🔻 bearish markers at signal candles.
Optionally displays:
Swing High/Low Labels (SH / SL)
Reversal distance labels
Background color shading on valid signals
Includes built-in alerts for automated trade notification.
🔑 Unique Benefits
Wick Trap Detection: A proprietary approach to detecting stop hunts via wick behavior, not just candle closes.
ATR-based trend filtering: Avoids unnecessary filtering while still maintaining directional bias.
All-in-one system: No need to stack multiple indicators — swing detection, reversal logic, session filtering, and imbalance confirmation are all integrated.
💡 How to Use
Enable Wick Trap Mode to detect stealthy liquidity grabs with strong wicks.
Use Kill Zone filters to trade only when institutions are active.
Optionally enable FVG confluence to improve confidence in reversal zones.
Watch for Bullish signals near SL levels and Bearish signals near SH levels.
Combine with your own execution strategy or other SMC tools for optimal results.
🔗 Best Used With:
Maximize your edge by combining this script with complementary SMC-based tools:
✅ First FVG — Opening Range Fair Value Gap Detector
✅ ICT SMC Liquidity Grabs + OB + Fibonacci OTE Levels
✅ Liquidity Levels — Smart Swing Highs and Lows with horizontal line projections

ICT Turtle Soup (Liquidity Reversal)ICT Turtle Soup — Liquidity Reversal Detection
Classic Liquidity Trap Reversal Strategy for Smart Money Traders
This indicator implements the ICT Turtle Soup concept — a classic liquidity-based reversal pattern — which occurs when price runs above or below a recent swing level to grab liquidity, then sharply reverses. This pattern is commonly used in Smart Money Concepts (SMC) and Inner Circle Trader (ICT) strategies to anticipate false breakouts and high-probability reversals.
🔍 What This Script Does:
Identifies Swing Highs & Lows
Detects recent swing highs and lows using a customizable lookback period.
Tracks Liquidity Grabs
A bearish Turtle Soup setup is triggered when price breaks above a recent swing high but closes back below it.
A bullish Turtle Soup setup is triggered when price breaks below a recent swing low but closes back above it.
These conditions often signal liquidity traps, where price sweeps resting orders before reversing.
Plots Signals Directly on the Chart
Turtle Soup setups are marked with 🐢🔻 (bearish) and 🐢🔺 (bullish) labels.
Optional full-text labels can also be displayed for clarity and journaling.
Includes Alert Conditions
Alerts can be enabled to notify you of bullish or bearish Turtle Soup reversals in real-time.
⚙️ Customization Features:
Adjustable swing lookback period
Enable/disable Turtle Soup labels
Set label font size
Choose your preferred bullish/bearish signal colors
💡 How to Use:
Add this script to your chart (ideally on intraday timeframes such as 5m–15m).
Wait for a Turtle Soup signal near a key swing high/low or liquidity zone.
Combine with other confirmation tools (e.g., FVGs, Order Blocks, OTE) for stronger setups.
Use alerts to stay ahead of fast-moving reversals.
🧠 Why It Works:
Turtle Soup setups are rooted in liquidity theory — they exploit the market’s tendency to sweep obvious swing levels before reversing. These moves often trap retail traders and mark the beginning of Smart Money entries.
🔗 Best Used With:
Maximize the edge by combining this with other SMC tools:
✅ First FVG — Opening Range Fair Value Gap Detector
✅ ICT SMC Liquidity Grabs + OB + Fibonacci OTE Levels
✅ Liquidity Levels — Smart Swing Lows
Together, they create a complete ecosystem for identifying, confirming, and executing liquidity-driven trade setups with precision.

Liquidity Levels (Smart Swing Lows)Liquidity Levels — Smart Swing Low Detection
Efficient Liquidity Sweep Visualization for Smart Money Traders
This script automatically identifies and plots liquidity-rich swing lows based on pivot logic, filters them to remove redundant levels, and overlays daily highs/lows for added context — giving Smart Money Concept (SMC) traders a clean, actionable map of liquidity.
It’s designed to be minimal yet powerful: perfect for spotting potential liquidity grabs, mitigation zones, and sweep targets with zero chart clutter.
🔍 What This Script Does:
Detects Smart Swing Lows
Uses fixed pivot detection (left = 3, right = customizable) to identify structurally significant swing lows.
Filters out swing lows that are too close together using a percentage-based spacing threshold to reduce noise.
Mitigation Cleanup Logic
Tracks whether recent price action breaches past swing lows.
If breached, the swing level is automatically removed, keeping only relevant, unmitigated liquidity levels on your chart.
Plots Daily Highs and Lows
Each new trading day, horizontal rays mark the prior day’s high and low — useful for identifying resting liquidity and possible sweep zones.
Labeling and Style Customization
Optional labels for swing lows.
Full control over label size, color, and visibility to match any chart aesthetic.
Timeframe Filtering
Runs exclusively on 5m, 10m, and 15m charts to ensure optimal reliability and signal clarity.
⚙️ Customization Features:
Pivot sensitivity (Right side control)
Minimum distance between swing lows (in %)
Label visibility, size, and color
Line width and colors for both swing levels and daily highs/lows
Mitigation cleanup lookback length
💡 How to Use:
Add the script to a qualifying intraday chart (5–15m).
Use the swing low levels to monitor liquidity-rich zones.
Combine with your personal strategy to identify liquidity grabs, potential reversal zones, or entry points following a sweep.
Let the built-in cleanup logic remove any already-mitigated levels so you can focus on active targets.
🚀 What Makes It Unique:
This isn’t just another pivot plotter — it’s a smart, self-cleaning SMC tool designed for modern liquidity-based trading strategies.
A must-have for traders using concepts like liquidity grabs, mitigation blocks, or sweep-to-reverse trade models.
🔗 Best used in combination with:
✅ First FVG — Opening Range Fair Value Gap Detector: Pinpoint the day’s first imbalance zone for intraday setups.
✅ ICT SMC Liquidity Grabs + OB + Fibonacci OTE Levels: Confluence-based entries powered by liquidity logic, order blocks, and premium/discount zones.
Used together, these scripts form a complete Smart Money toolkit — helping you build high-probability setups with confidence, clarity, and clean charts.

First FVG Custom Time RangeFirst FVG — Opening Range Fair Value Gap Detector
Smart Money Opening Imbalance Strategy Tool
This script automatically detects and highlights the first Fair Value Gap (FVG) that forms between 9:30 and 10:00 AM Eastern Time (New York session open) — a critical period often referred to as the Opening Range. It’s designed for Smart Money traders looking to isolate early-morning inefficiencies that may influence market behavior throughout the trading day.
🔍 What This Script Does:
Automatically Detects the First FVG in the Opening Range
Scans price action between 9:30 and 10:00 AM ET and identifies the first valid bullish or bearish FVG that forms.
Only one FVG is shown per day — ensuring a clean, focused view.
Draws a Visual Zone
Once detected, the FVG zone is extended forward on the chart (customizable duration).
A labeled zone helps users track how price reacts to it throughout the session.
Optional Retest Alerts
Alerts you when price re-enters the zone — a potential reaction point used by SMC traders.
Customization Options
Set your preferred session time window
Adjust zone duration (in bars)
Customize label font size, colors, and visibility
Enable/disable alert on retest
📈 Why the First FVG Matters:
Time-Sensitive Setup: The first FVG typically forms no earlier than 9:31 AM ET and represents a potential “time distortion” or imbalance zone created by aggressive market participants during the open.
Behavioral Study: Many traders journal how price behaves around this zone each day — whether it acts as support, resistance, or gets traded through later in the session.
Predictive Value: Observing how this zone is respected or broken can provide anticipatory insight into intraday price action, rather than reactive analysis.
Great for New Traders: This opening FVG is often recommended as a starting reference point for building trade models and understanding how institutional imbalances unfold.
🚀 What Makes It Unique:
This tool doesn’t spam your chart with every FVG. It laser-focuses on a single, time-bound zone backed by institutional logic — the first presented imbalance of the day during the opening range.
Use it to:
Monitor price behavior around early inefficiencies
Plan journal entries and pattern recognition
Align intraday setups with a high-probability SMC model
Whether you’re scalping, journaling market structure, or refining entries based on liquidity behavior — this script helps you make the first 30 minutes count.

ICT SMC Liquidity Grabs and OBsICT SMC Liquidity Grabs + OB + Fibonacci OTE Levels
Smart Money Concepts Trading Assistant
This script is built for traders who follow ICT (Inner Circle Trader) and Smart Money Concepts. It intelligently combines three critical components of SMC trading: Liquidity Grabs, Order Blocks, and Fibonacci-based Optimal Trade Entry (OTE) zones — giving traders visual cues for potential high-probability reversals and entry points.
🔍 What This Script Does:
Detects Liquidity Grabs
Identifies swing highs/lows where price sweeps liquidity, then immediately reverses.
Labels them with orange markers when price takes out previous highs/lows but closes back inside.
Draws Order Blocks
After a liquidity grab, the script looks for strong bullish or bearish candles and automatically highlights the OB zone.
These OB zones are visualized with transparent colored boxes extending several bars forward.
Plots Fibonacci OTE Levels
Uses recent swing high/low pivots to dynamically draw customizable OTE retracement levels (e.g., 62% and 75%) for both long and short setups.
Highlights Optimal Entry Zones
Marks valid OTE-based buy/sell opportunities only when:
Liquidity has been taken,
Price enters the OTE zone,
And a strong confirming candle appears.
Adds visual zones, trade labels, and optional alerts for each qualified entry.
Includes Take Profit Targets
Automatically calculates take-profit levels based on previous structure and risk-reward ratios.
TP1 is the previous swing, and TP2 is an extended R-multiple (customizable by user).
⚙️ Customization Options:
Toggle each feature (Liquidity Grabs, OBs, Fibonacci Levels)
Adjust Fibonacci levels (default: 62% and 75%)
Set lookback period for liquidity checks
Customize the R-multiple for TP2 levels
💡 How to Use:
Enable desired features from the input panel.
Watch for Buy/Sell OTE zones highlighted in green/red.
Confirm with liquidity sweep and OB support for stronger signals.
Use the automatically generated TP levels to manage risk.
🚀 What Makes It Unique:
Unlike other open-source mashups, this script synchronizes multiple SMC concepts into a single tool that:
Waits for high-confidence conditions (not just blind fib or OB detection)
Validates entries using multiple confluences
Visually marks actionable setups
Automates trade management zones
Whether you're trend-trading, scalping, or swing trading ICT-style, this tool offers a streamlined, smart-money-aligned workflow directly on your chart.

02 SMC + BB Breakout (Improved)This strategy combines Smart Money Concepts (SMC) with Bollinger Band breakouts to identify potential trading opportunities. SMC focuses on identifying key price levels and market structure shifts, while Bollinger Bands help pinpoint overbought/oversold conditions and potential breakout points. The strategy also incorporates higher timeframe trend confirmation to filter out trades that go against the prevailing trend.
Key Components:
Bollinger Bands:
Calculated using a Simple Moving Average (SMA) of the closing price and a standard deviation multiplier.
The strategy uses the upper and lower bands to identify potential breakout points.
The SMA (basis) acts as a centerline and potential support/resistance level.
The fill between the upper and lower bands can be toggled by the user.
Higher Timeframe Trend Confirmation:
The strategy allows for optional confirmation of the current trend using a higher timeframe (e.g., daily).
It calculates the SMA of the higher timeframe's closing prices.
A bullish trend is confirmed if the higher timeframe's closing price is above its SMA.
This helps filter out trades that go against the prevailing long-term trend.
Smart Money Concepts (SMC):
Order Blocks:
Simplified as recent price clusters, identified by the highest high and lowest low over a specified lookback period.
These levels are considered potential areas of support or resistance.
Liquidity Zones (Swing Highs/Lows):
Identified by recent swing highs and lows, indicating areas where liquidity may be present.
The Swing highs and lows are calculated based on user defined lookback periods.
Market Structure Shift (MSS):
Identifies potential changes in market structure.
A bullish MSS occurs when the closing price breaks above a previous swing high.
A bearish MSS occurs when the closing price breaks below a previous swing low.
The swing high and low values used for the MSS are calculated based on the user defined swing length.
Entry Conditions:
Long Entry:
The closing price crosses above the upper Bollinger Band.
If higher timeframe confirmation is enabled, the higher timeframe trend must be bullish.
A bullish MSS must have occurred.
Short Entry:
The closing price crosses below the lower Bollinger Band.
If higher timeframe confirmation is enabled, the higher timeframe trend must be bearish.
A bearish MSS must have occurred.
Exit Conditions:
Long Exit:
The closing price crosses below the Bollinger Band basis.
Or the Closing price falls below 99% of the order block low.
Short Exit:
The closing price crosses above the Bollinger Band basis.
Or the closing price rises above 101% of the order block high.
Position Sizing:
The strategy calculates the position size based on a fixed percentage (5%) of the strategy's equity.
This helps manage risk by limiting the potential loss per trade.
Visualizations:
Bollinger Bands (upper, lower, and basis) are plotted on the chart.
SMC elements (order blocks, swing highs/lows) are plotted as lines, with user-adjustable visibility.
Entry and exit signals are plotted as shapes on the chart.
The Bollinger band fill opacity is adjustable by the user.
Trading Logic:
The strategy aims to capitalize on Bollinger Band breakouts that are confirmed by SMC signals and higher timeframe trend. It looks for breakouts that align with potential market structure shifts and key price levels (order blocks, swing highs/lows). The higher timeframe filter helps avoid trades that go against the overall trend.
In essence, the strategy attempts to identify high-probability breakout trades by combining momentum (Bollinger Bands) with structural analysis (SMC) and trend confirmation.
Key User-Adjustable Parameters:
Bollinger Bands Length
Standard Deviation Multiplier
Higher Timeframe
Higher Timeframe Confirmation (on/off)
SMC Elements Visibility (on/off)
Order block lookback length.
Swing lookback length.
Bollinger band fill opacity.
This detailed description should provide a comprehensive understanding of the strategy's logic and components.
***DISCLAIMER: This strategy is for educational purposes only. It is not financial advice. Past performance is not indicative of future results. Use at your own risk. Always perform thorough backtesting and forward testing before using any strategy in live trading.***

ICT SMT (fadi)The ICT SMT (fadi) Indicator is a powerful indicator inspired by the Inner Circle Trader (ICT) methodology, designed to identify Smart Money Technique (SMT) divergences between correlated assets. This indicator helps traders spot potential reversal points or trend shifts by comparing price action of a user-defined symbol (e.g., “ES1!” for E-mini S&P 500 futures) against the current chart’s price structure. Ideal for forex, indices, futures, and crypto markets, it highlights discrepancies in correlated asset behavior to enhance trading decisions.
These discrepancies occur when one asset shows signs of strength—such as holding support or rallying—while the other weakens or drops, signaling potential manipulation or a shift in smart money activity. This is relevant because it reveals where institutional traders may be accumulating or distributing positions, giving insight into impending trend changes. This indicator offers higher accuracy and detects nearly every SMT present on the chart by calculating multiple possibilities.
Features
• Smart Algorithmic detection of high probability SMTs
• Detect SMT with two other symbols
• Detect 2-Candle SMT as an additional configurable option
• Confirmation and Invalidation levels
• Expand or narrow the detection range by changing the number of pivots to use
• Raise alerts when SMT has been detected
Usage
1. Apply the indicator to your chart.
2. In the settings, input a correlated symbol (e.g., “NQ1!” for Nasdaq futures if charting “ES1!”, or “EURUSD” if analyzing “GBPUSD”).
3. Monitor the plotted markers and labels:
• Green markers for bullish divergences.
• Red markers for bearish divergences.
4. Combine with other ICT concepts (e.g., order blocks, liquidity zones) for higher-probability setups.
Best Practices
• Pair with strongly correlated assets (e.g., ES vs. NQ, EURUSD vs. GBPUSD) for reliable signals.
• Backtest on your chosen market to confirm effectiveness.

Trading ChecklistTrading Checklist Indicator - Your Trading Plan Companion
A clean and efficient visual checklist to maintain trading discipline and consistency. This indicator helps traders follow their trading plan systematically by providing an easy-to-use checklist of key confirmation points.
Features:
- Visual checklist with clear green/red status indicators
- Clean, non-intrusive interface
- Real-time status updates
- Easy toggle controls for each item
Key Checkpoints:
1. HTF Structure Analysis
2. Order Flow Confirmation
3. SD/OB/FVG (HTF POI) Identification
4. Liquidity Grab Verification
5. Reversal Alignment Check
Final Confirmations:
- Trade Validity Check
- POI & Stop Loss Safety
- Set and Forget Status
How to Use:
1. Add the indicator to your chart
2. Use the Settings panel to toggle each condition
3. Green dots indicate confirmed conditions
4. Red dots show pending confirmations
5. Verify all conditions before executing trades
Note: This indicator helps maintain trading discipline but should be used alongside proper technical and fundamental analysis.
Tags: #TradingChecklist #RiskManagement #TradingPlan #Trading #Technical #Strategy #Discipline
