Tunable SWMADissected the standard SWMA function and added options for user to change just about every part of it. Weights ,Lookback ,Source can all be changed in the settings.
Green is the standard SWMA, Using the Input value selected.(MAs/LRC/VWAP)
Red is the tuned SWMA, with the option of applying a final Output filter (MAs/LRC/VWAP). Uses 8 datapoints instead of 4 for the default.
Customization can really help expand upon the standard SWMA I find. Enjoy tuning to your hearts content
Smoothed Moving Average (SMMA)

Tracert Trend[s3]Variable Moving Average(VMA) with a view of the trend based on the VMA on multiple timeframes. The Variable Moving Average (VMA) is a study that uses an Exponential Moving Average being able to automatically adjust its smoothing factor according to the market volatility . The timeframes of the indicator must be set to a higher timeframe than whatever timeframe your chart is set to to work properly. Example(default): Trading on the 15m timeframe so have the timeframes set to: 1) Chart 2) 30m 3) 45m 4) 60m
Green line of VMA = uptrend in price action
Red line of VMA = downtrend in price action
White line of VMA = indecision in price action
Green candles = uptrend and above VMA
Red candles = downtrend and below VMA
White candles = indecision or chop in price action
Green symbol below candle = all six timeframes are above the VMA
Red symbol above candle = all six timeframes are above the VMA
No symbol above or below candle = indecision amongst the six timeframes

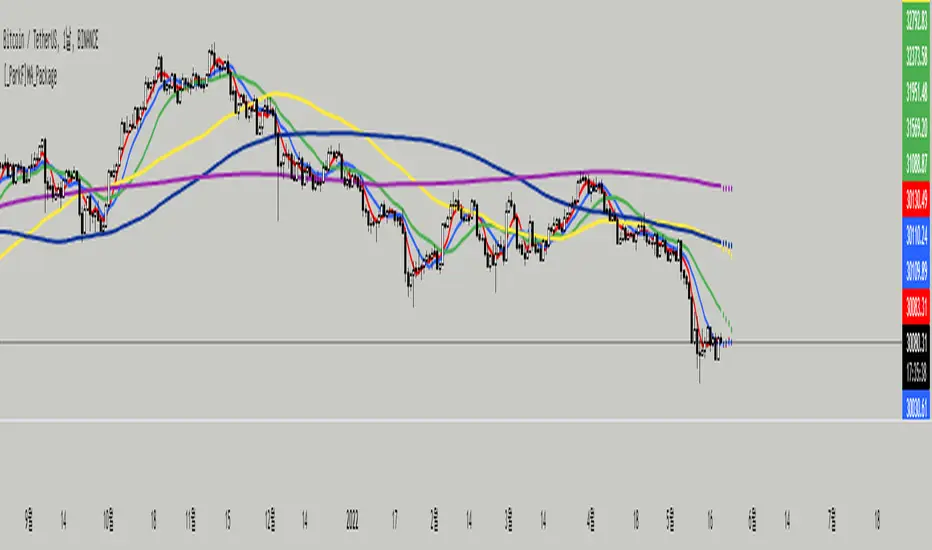
[_ParkF]MA_PackageThis indicator is a comprehensive set of moving averages.
All settings are handled in the input menu.
1. 6 moving averages are included.
2. You can edit the source of 6 moving averages.
3. You can change the type of each moving average line.
4. You can change the period value of each moving average line.
5. You can change the color of each moving average line.
6. You can change the thickness of each moving average line.
7. The predictive value of each moving average line will be displayed as a dot, and this value will be changed according to the type of the moving average line.
--------------------------------------------------------------------------------------------------------------------------------------------------------------------------------------------------------
이 지표는 이동평균선의 종합선물세트 입니다.
모든 설정은 input 메뉴에서 다뤄집니다.
1. 6개의 이동평균선이 포함 되어 있습니다.
2. 6개의 이동평균선의 소스를 수정할 수 있습니다.
3. 각각의 이동평균선의 타입을 변경할 수 있습니다.
4. 각각의 이동평균선의 기간값을 변경할 수 있습니다.
5. 각각의 이동평균선의 색상을 변경할 수 있습니다.
6. 각각의 이동평균선의 두께를 변경할 수 있습니다.
7. 각각의 이동평균선의 예측값이 점으로 표시될 것이고 이 값은 해당 이동평균선의 타입에 맞춰 변경됩니다.
Market Bias (CEREBR)Hello Everyone. I hope you are all doing great. It's been a long time since I posted my first script here, and I got a lot of response from that.
So, I thought I should share this script also to everyone, and anyone that may find it useful. Personally, I use it to tell the general market conditions.
Here's how I works : The script tries to determine the overall direction of the market, using smoothed Heiken Ashi candles. The coloring system (using bright and dark colors) is an attempt to detect strong market and weak market conditions. There's also an oscillator within the script, but for now it isn't plotted. Credits to @jackvmk, I used part of his open-script code in this indicator.\
I have considered using the slope of the indicator plot as a filter for ranging market conditions. The plot goes relatively flat in 'flat' markets. However, I have not done anything about that yet. Maybe some other time.
I hope you find this useful. If you find a way to use this, please share it with the community in the comment section.
NOTE: THIS IS BY NO MEANS FINANCIAL ADVICE. You'll have to make your studies and come up with a way to apply this indicator to your trading style and strategy.
By the way, I would be going with the name 'CEREBR' for any subsequent scripts I release from now on.
Happy Trading, guys.

Moving Average Suite + VWAP + TICKThis indicator combines some of the commonly used moving averages, VWAP, and TICK sentiment, all of which are useful for all types of trading
By default, this indicator includes:
- 21/50/100/200 period smoothed simple moving average
- great for determining trends
- also act as support / resistance line for price
- 9 period exponential moving average
- fast trend / direction indicator
- Volume Weighted Average Price
- no explanation required
- $TICK sentiment as background fill
- overall market sentiment and direction
- +/- 500 levels are colored green/red and are usually indication of institutional order flow --> critical for trading indexes such as SPY or QQQ
- deep green/red background indicates +/-1000 on the $TICK, which are usually associated with overbought or oversold

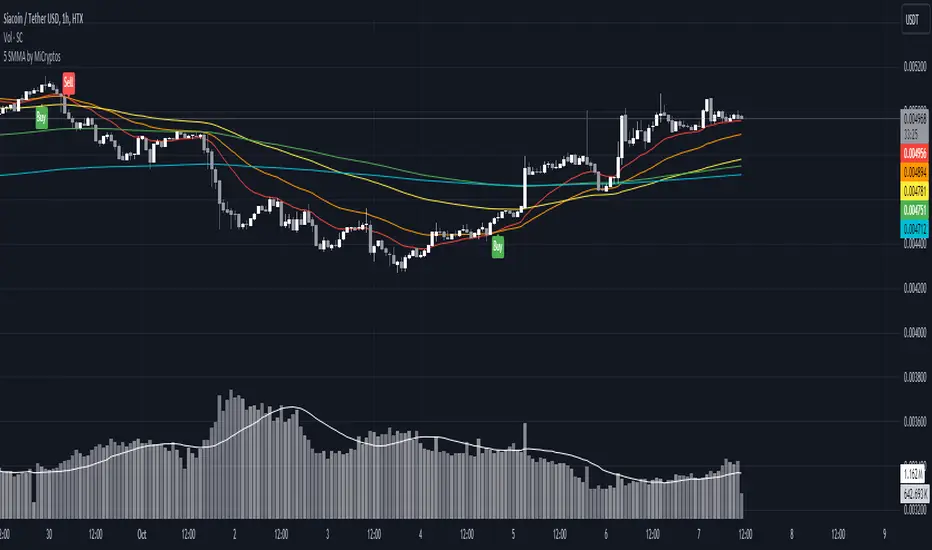
5 SMMA - by MiCryptoGives you the 5 most common SMMA for crypto in day trading:
- 10
- 21
- 50
- 100
- 200
This can be configured as you want.
Hope this can help you to get more indicators in a free plan.
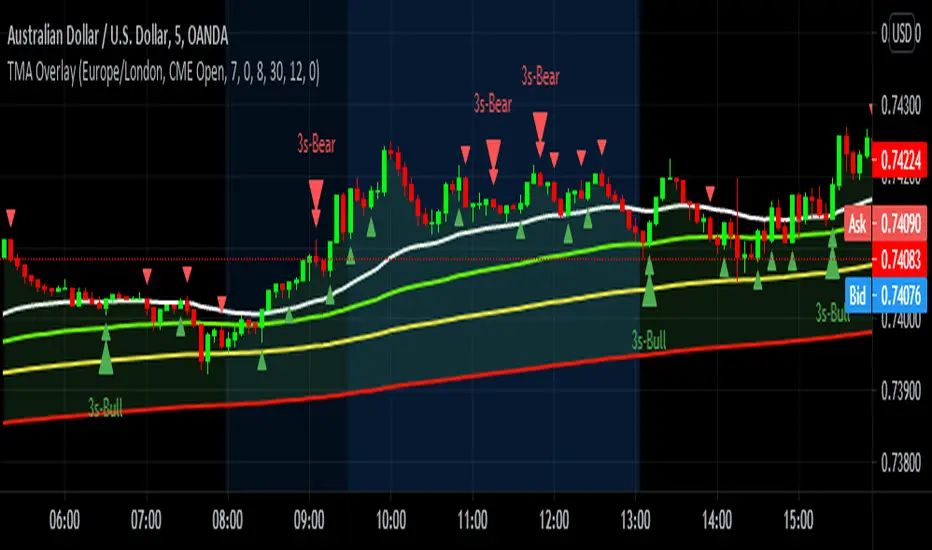
TMA OverlayThis indicator help identify momentum by offering a visual representation of engulfing candlestick patters overlayed with smoothed moving averages
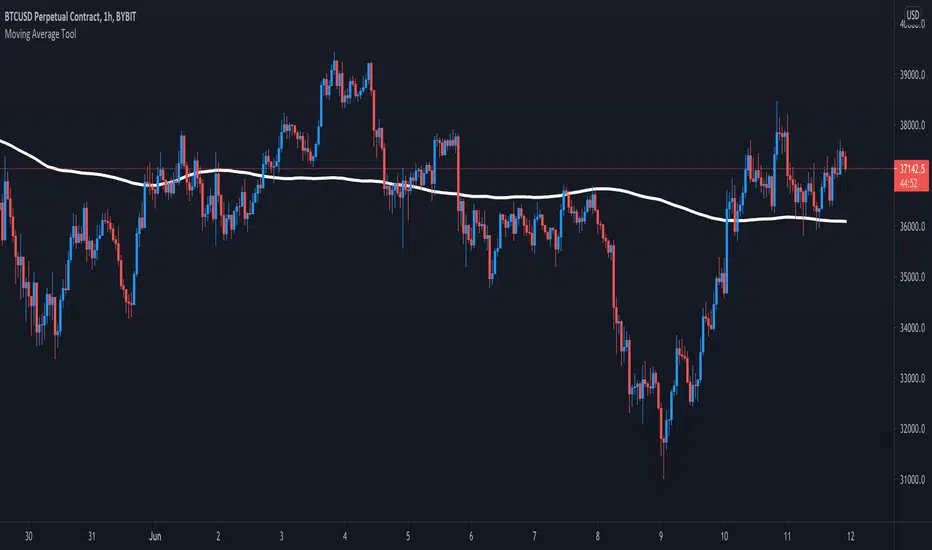
Moving Average ToolThe Moving Average Tool is the only indicator you will ever need to plot MA lines. It comes loaded with 9 different types of moving averages so traders can lay down any line at any length. There is also an option to plot a trigger line. Features: SMA , SMMA, EMA, LSMA, ZLSMA, HULL, LWMA, VWMA and ALMA. Simply pick an average type and enter the desired length.
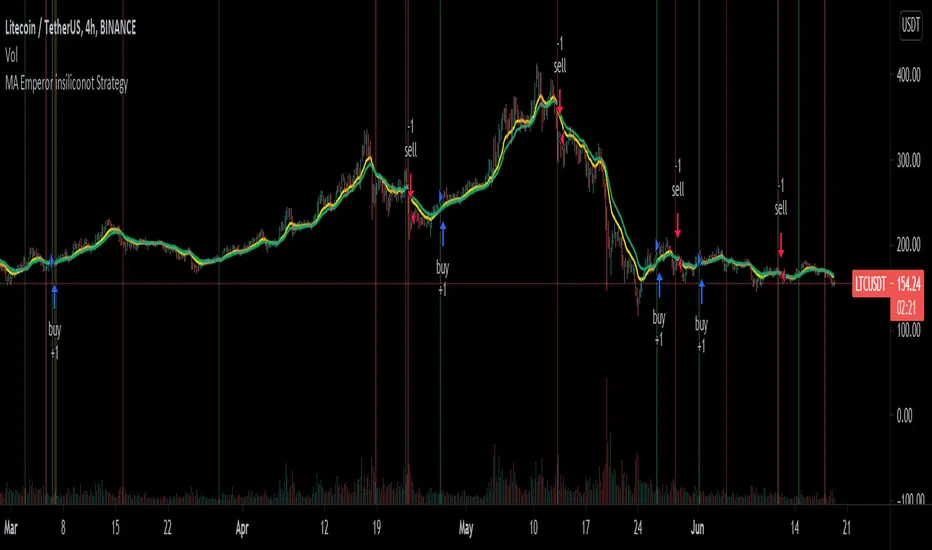
MA Emperor insiliconot StrategyConverted EmperorBTC's EMA crossover indicator for easy backtesting and added ability to:
Specify time period for backtesting
Specify order quantity
Toggle original indicators (default off)
Quoting EmperorBTC:
Entry is to be made when the
1. Cross over gives a P(Positive Sign) and the candle completely closes above the cross-over
2. When the Heikin Ashi turns green and the next green HA candle goes above the previous green HA candle.
3. The price should be at-least above the 0.236 Level from the Swing high.
Kindly note that the strategy only attempts to do check number 1, where it ensures the entry opens above the cross-over.
MA Strategy Emperor insiliconotThe Script offers 9 different EMAs with 14 different MA types.
The make use of the script is to find the entry on the 1-4 hour altcoins while using the in-built 13/21 crossover strategy to be used in sync with Heikin Ashi cross-over with Fib levels of 0.236 Fib level.
How to use it.
Entry is to be made when the
1. Cross over gives a P(Positive Sign) and the candle completely closes above the cross-over
2. When the Heikin Ashi turns green and the next green HA candle goes above the previous green HA candle.
3. The price should be at-least above the 0.236 Level from the Swing high.
All the Best.
EmperorBTC

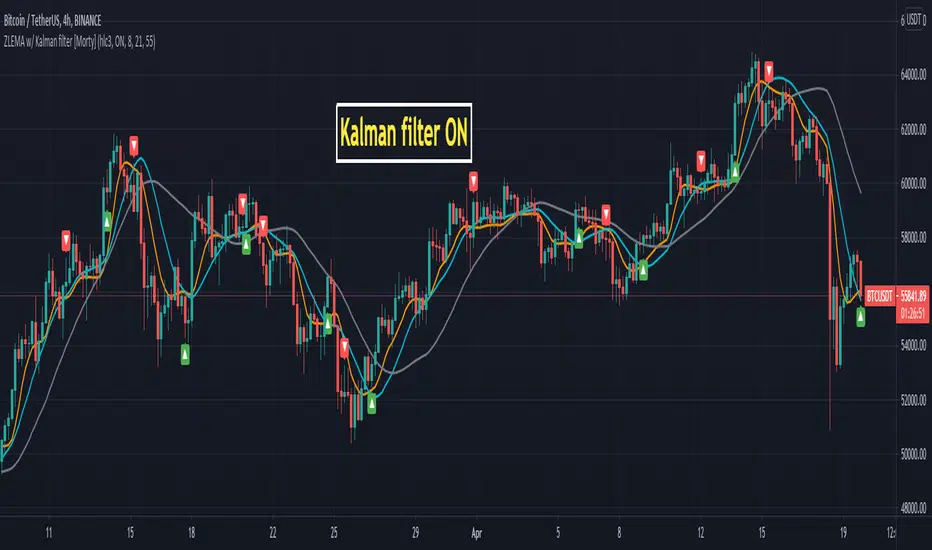
ZLEMA Zero lag EMA with Kalman filter [Morty]This indicator plot 3 Kalman filter zero lag EMA lines. It has less lag and is also smoother than the original EMA.
It also has an option to show the crossover of two EMAs.
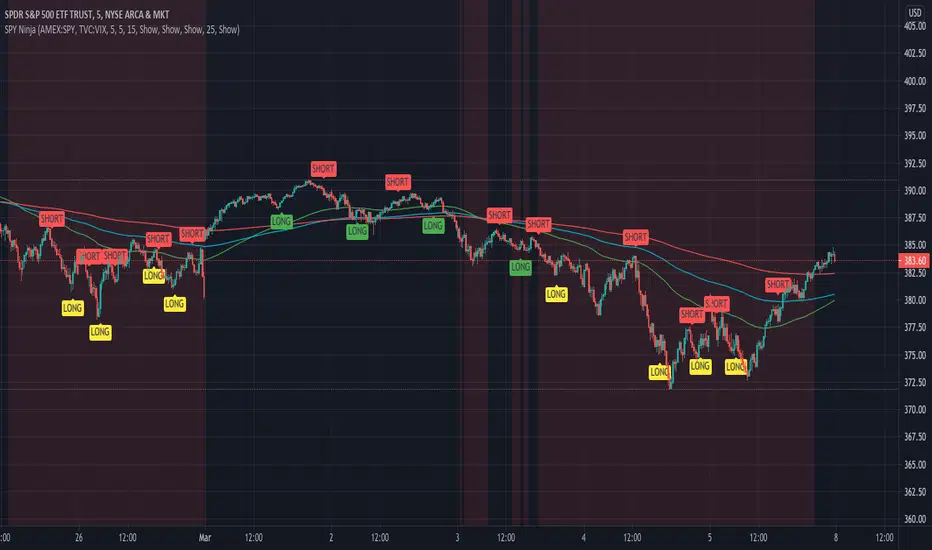
SPY Ninja
SPY Ninja correlates the true strength index exponential moving averages of SPY and VIX together. In doing so we can determine the start of trend shifts via SPY / VIX convergence in addition to crossover, with potential market entries and exits represented by the LONG and SELL signals.
SMMA 50,100, and 200 have been added to chart due to the historic SPY market reactivity to these moving averages. They often act as natural support and resistance levels with SPY, and when coinciding LONG and SHORT signals appear touching any of these levels, it adds an extra layer of confidence for traders' decisions. Also, by highlighting the areas on our SPY chart (red background areas) that represent a VIX threshold higher than 25, we can bring attention to areas with potentially higher volatility immediately so that traders know to proceed with caution.
SPY Ninja works harmoniously with the SPY Ninja Oscillator; Ninja provides the signals highlighting risky VIX areas of concern, while the Ninja Oscillator adds an additional 3 levels of potential confirmation for your trade decisions.
Fishing with SignalsFishing with Signals
HOW DOES IT WORK?
Fishing with Signals comprises of 3 indicators
1) Buy / Sell Signals
2) Band for Trend Recognition
3) ADX-DI Trend Identifier
Indicator 1 == Buy / Sell Signals
The signals are based on moving average exponential rectified by the previous high and low break at any real-time, it recognises the previous specified moving average deviation. If the predefined high and lows are broken along with current candle is closed below the specific moving average then sell is given and vice-versa for buy. The settings are not editable.
Indicator 2 == Band for Trend Recognition
The band comprises of 200 moving average with exponentially smoothening feature, there are three lines one can identify the trend if candles are below or above the band
Indicator 3 == ADX-DI Trend Identifier
The indicator gives a multiplication of ADX and the DI+ and DI-values, colour coded for bullish or bearish momentum and shows general market direction and divergence in a simpler visual way than the normal ADX-DI lines, a threshold value cannot be edited. The indicator is plotted relative to the 200 ema and can be seen as a "buffer" against price reversal. The ADX is used to indicate market direction, the existence or nonexistence of a trend and market momentum. Market direction is determined by the levels of the +DI and -DI. The ADX indicator, which varies in value from zero to 100, is the primary momentum indicator, default value is kept at +40 and -40. If the ADX is lowering or rising the DI line plotted will be moving as directed with change in colour and background filling. The Line hovering below and above the "buffer" is changing the colour with rising as navy and falling as maroon with intermittent colour of red and lime which also shows reversal.
HOW TO use the indicator?
For SHORT ==If the candles are below the Band for Trend Recognition and ADX-DI Trend Identifier is lowering and if the SELL SIGNAL comes one can go short with stop-loss be the close above top band and with momentum be positive.
For LONG == If the candles are above the Band for Trend Recognition and ADX-DI Trend Identifier is growing and if the BUY SIGNAL comes one can go Long with stop-loss be the close below lower band and with momentum be negative.
CAUTION!! : There will be false buy / sell signals also, where user have to verify with the other two indicators, for confirmation.
TARGET in any call = If the trend is up and buy signal comes then target may be trailed till next signal or close below band and vice versa for sell side.
USER OPTIONS : Choice of turning on / off the three indicators.
VISUAL CHECKS - The user could manually validate the back test results on various assets they would like to use this strategy on before putting it live.
USAGE MARKETS : Index Trading / Equities and also well with Commodities and Currencies.
TIME FRAME : Timeframe maybe any and as the user likes, still it works well with 5 min for less signals.
SETTING THE ALERTS : - Buy and Sell Signal alerts are advisable.
HOW TO GET ACCESS
Please click on the link / email available in the signature or send me a private message to get access.
FEEDBACK
Please click on the link/email in the signature or send me a private message for suggestions/feedbacks.
DISCLAIMER.
I AM NOT A FINANCIAL ADVISOR. THESE IDEAS ARE NOT ADVICE AND ARE FOR EDUCATION PURPOSES ONLY. ALWAYS DO YOUR OWN RESEARCH!
Utmost Care is taken to implement the suggestions of users and also tried to keep the chart neat and clean.
Greetings!!
Drop a mail to edgineer@yahoo.com or Drop a personal message for access.
Questions, Help, Discussion -> Telegram: Telegram: @miteysh

MomentumInvest TrendFollower [@TradersVenue]VSA CheatSheet - Have kept the chart clean and clear not by putting each signal pattern name. What matters is identifying the real price action than the pattern name. To keep the charts clutter free, haven't put the signal name under/above the candle.
Rejection or reversal patterns
Green Circle - Typical SellingClimax, Stopping Volume and Bag Holding signal patterns as per VSA. Strong price volume action but price rejection at lower level.
Red Circle - Typical Buying Climax, End Of Rising, Supply Overcoming Demand signal patterns as per VSA. Strong price volume action but price rejection at higher level.
Green Square - Typical bullish TrendReversal candle as per VSA. Bullish breakout bar immediately after a bearish breakout bar and engulfing the previous one or cover max part of it.
Red Square - Typical bearish TrendReversal candle as per VSA. Bearish breakout bar immediately after a bullish breakout bar and engulfing the previous one or cover max part of it.
Momentum breakout patterns
Blue/Green Star - Bullish breakouts. Downthrust bars with significant price volume action. Green if smaller low weak otherwise blue.
Red/Pink Star - Bearish breakouts. Downthrust bars with significant price volume action. Red if low higher weak else pink.
Candle Color
Green - Bullish with strong price action. Good to enter long towards close with SL of day low. System suggests quantity as per 2% trading rule. One can play with risk defined option strategies or cash segment as per quantity suggested.
Red - Bearish with strong price action. Good to enter short towards close with SL of day high. System suggests quantity as per 2% trading rule. One can play with risk defined option strategies like bear put spread or bear call spreads or go for hedged shorts.
Pink - Bearish with muted price action. Trail SL. Better to avoid trading these candles.
Light blue - Bullish with muted price action. Trail SL. Better to avoid trading these candles.
Plotted EMA Ribbon gives a sense of the strength of momentum. When each MA is placed with wide gaps momentum is strong. When there is EMA confluence, chances of trend strength are weakening. Background color of the chart green indicates bullishness in the underlying and red indicates that bearish pressure in the scrip. If the background color is green and you see one Blue/Green star candle it's good to go long. If the background color is red and you see one Red/Pink star candle it's good to go short.
A word of caution: Trading breakouts is very good. But you need to prepare for breakout failures. Here the system picks wide range bars for going long or short that means SL is wide probably 3% and above. Also if you notice after a strong PV breakout if price sustains below that it can see long unwinding pressure and simillary after a strong PV breakdown, if price sustains above the breakdown candle, chances of short covering is higher. Here money management and risk management becomes very important. Same has been included as part of the indicator to give you an optimal quantity for trade to keep the drawdowns lower. If you enable (1) RECO message and (2) Show Strategy (Else Study)? options then it shows a RECO box with quantity calculated as per 2% loss per trade rule. Lot of risk management, scale up/down for compounding is also available. You may try out those options one by one.
This indicator needs to be used along with the “VSA + Volume Oscillator ”, because this setup relies on VSA (Volume Spread Analysis). The overall usage will be provided through a demo to the subscribing users. In order to gain access to this indicator you may contact me using the below signature.

Bjorgum Triple EMA Strat-This script uses a triple EMA strategy to establish trend direction and reversal points
-Inputs are smoothed with Heiken Ashi values to reduce whipsaws, while providing timely execution
-Buy and sell indications are dictated by bar color
-Bar color is dictated by the candle close value in relation to the EMAs, specifically the faster of the 3
(If candle closes above or below the fast and intermediate averages, a buy or sell signal is indicated by bar color change)
-If the close falls between the two a cautionary signal is given. The viewer can hold, or take profit, or evaluate other indicators for clues
-Best results are obtained when coupled with Bjorgum TSI and Bjorgum RSI for confirmation of signals (see TradingView profile)
@Bjorgum on Stocktwits

SMMA ConfluenceVisualizes SMMA on multiple timeframes (5min, 15min, 30min, 1hr, 2hr, 3hr, 4hr, 6hr, 8hr, 12hr, and 1d) and allows selection of lookback.

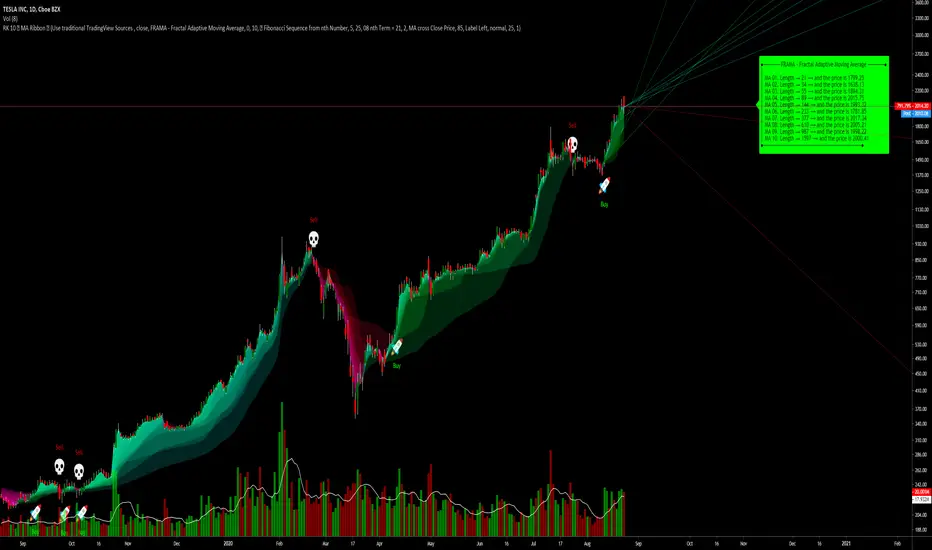
RK's 10 ∴ MA Types Ribbons (Fibonacci, Guppy and others)After some tips in my indicator
RK's 04 - Lots of MA Types Ribbon I Put some time and effort to make it better.
So, I'm sharing with you the results.
This is an up to 10 lines Moving Average Ribbon with an Auto Evaluate Length and a lots of options!!!
Type of Moving Average you can use:
SMA - Simple Moving Average
SMMA - Smoothed Moving Average
EMA - Exponential Moving Average
DEMA - Double Exponential Moving Average
TEMA - Triple Exponential Moving Average
WMA - Weighted Moving Average
HMA - Hull Moving Average
EHMA - Exponential Hull Moving Average
RMA - RSI Moving average
2PSS - Ehlers 2 Pole Super Smoother
3PSS - Ehlers 3 Pole Super Smoother
VWMA - Volume-Weighted Moving Average
ALMA - Arnaud Legoux Moving Average
STMA - Simple Triangular Moving Average
ETMA - Exponential Triangular Moving Average
LSMA - Least Squares Moving Average
ZSMA - Zero-Lag Simple Moving Average
ZEMA - Zero-Lag Exponential Moving Average
COVWMA - Coefficient of Variation Weighted Moving Average
COVWEMA - Coefficient of Variation Weighted Exponential Moving Average
FRAMA - Fractal Adaptive Moving Average
KAMA - Kaufman's Adaptive Moving Average
VIDYA - Variable Index Dynamic Average
If you want to change faster the MA type, in "Moving Average Setup:", Select "🤖 Use numbers to change MA Type", click inside the box in "🤖 Moving Average Type per Number:" and just scroll your mouse wheel. You can check what MA type you are using looking in the info panel label.
There is 4 automatic evaluate length:
Fibonacci Sequence
Arithmetic Progression
Geometric Progression
Guppy Multiple Moving Average (GMMA) without Lengths 03 and 05
And I already put a Manual Length, but I keep it inside the code, so if you want to use different lengths, just change the code, or ask me and I will put as an input.
And attending a request, this indicator can creates alerts when all the colors of the ribbons changes.
Hope you like it!
Any other good idea, just send me.
Pre-Market Volume ProfileThis indicator displays the pre-market volume (note: without the post-market of the previous day).
Unusual pre-market volume often indicates that institutional market makers are moving the market, which is a good sign for unusual high price movement.
The indicator helps me to spot stocks, if a pre-market gap is confirmed with enough (unusual) volume.
You can define, what "unusual" means by you, by adjusting the SMA length and the SMA multiplier.
The default is a length of 21 bars and a 2.5 multiplier, meaning I'm interested in a stock, if the pre-market volume exceeds the average pre-market volume by 2.5 times.

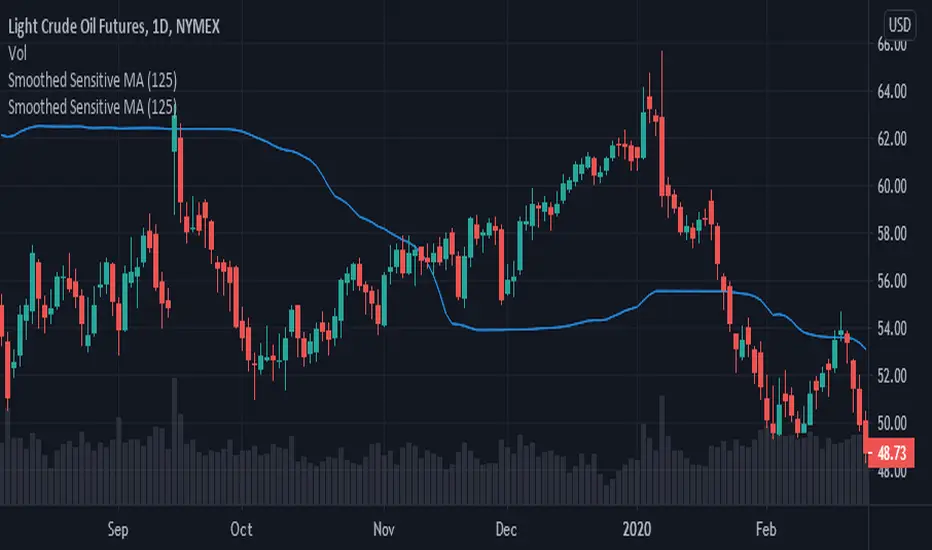
Smoothed Sensitive MAThis moving average is sensitive and reacts quickly to significant price movements, while remaining indifferent to small price moves.
Smoothed Sensitive MA is triple weighted for price changes.
It takes in one parameter "Length", which is used as both
1. the lookback period for price change,
zCC=abs(close-close [ len ])
and also as
2. the number of periods to be averaged
zSSMA=sum(zCC*zCC*zCC*close, len )/sum(zCC*zCC*zCC, len )
Alternatively, you could modify the script to use two separate parameters for values for 1 and 2.
Triple MA + EMA + SMMA + BBCombined multiple scripts under one script.
Great for Free account users. ;-)
This script contains:
Moving Average
Exponential Moving Average
Smoothed Moving Moving Average
Bollinger Bands

SMMA 5-13 crossCrossing the Smoothed Moving Averages with settings 5 & 13 give you confident signal for selling or buying.
IMPORTANT: Signal is always late.
SELL : Short SMMA (5) cross the Long SMMA (13) from top
BUY : Short SMMA (5) cross the Long SMMA (13) from down

[LunaOwl] Center of Gravity作品: 艾勒斯重心點 (Center of Gravity, CG)
Center of Gravity was developed by John Ehlers in 2002. The main purpose of the Center of Gravity indicator is to find possible reversal points as early as possible. Indicator has two series, the first is the CoG series, and the second is the signal line calculated by the five-period smoothed moving average. Cross representative indication of the direction. I coded this indicator according to the description of MT4, a little work.
重心點(Center of Gravity)是由約翰.艾勒斯在2002年開發的,這個指標的主要用途是儘早發現可能的反轉點。它有兩個部份,一個是重心點指標線,另一個是經過五期平滑移動平均線平滑過的信號線,它們的交叉結果代表方向。我按照MT4的說明編寫了這個小作品。

Smooth HA / Hull MA / MTF===========
Smooth HA / Hull MA / MTF
===========
A combination of a Smoothed Heikin Ashi Chart Line and a Hull MA Line, paints a "Long" or "Short" alert when the Hull MA changes color - editable settings for the smoothing of HA data and Hull MA Length; you can also change the time frame used (must be the same or longer as the chart).
-----------
This indicator does a real good job at finding highs and lows (otherwise known as entry and exit points!) picking up on just about every large, decent swing and making the most from those big moves! The disadvantage of all Smoothed HA strategies are when times are choppy or ranging - given the natural lag of the indicator you can be sure in choppy times you'd be buying at the top and selling at the bottom almost every time ~ No indicator is perfect!
This Smooth HA/Hull MA indicator also has a built in MTF function (Multi-Time-Frame). This means you can be using a 1hr chart and set the indicator to a 4hr chart - generally any movements on a greater time frame will overcome any movements of the smaller time frame, so this is where you should be gathering data about which direction the market is moving - as always, follow the trend.
Hope (like always) this is of at least some use to some people.
Good Luck and Happy Trading!
