Sequential SMT (QT)Sequential SMT (Quarterly Theory)
Price Divergences Between Correlated Asset Pairs Across Time Quarters
This indicator identifies Sequential SMT patterns - divergences between correlated assets across consecutive time periods. When price action diverges between traditionally correlated pairs, it may signal potential reversals or distribution phases.
How It Works
The indicator divides the trading day into specific time quarters and analyzes price extremes within each period. It compares consecutive quarters to detect divergences:
Bullish Pattern: One asset makes a lower low while its correlated pair makes a higher/equal low
Bearish Pattern: One asset makes a higher high while its correlated pair makes a lower/equal high
This implementation enhances standard divergence detection by:
Analyzing multiple timeframe cycles simultaneously (dual-cycle approach)
Using both wick and body-based analysis for hidden divergences
Incorporating True Open levels as confluence filters
Providing visual quarter/cycle boundaries for context
Key Features
Dual-Cycle Detection
M5 Timeframe: Tracks Daily Cycles (6h) AND 90-minute quarters simultaneously
M1 Timeframe: Tracks 90-minute cycles AND 22.5-minute quarters simultaneously
Both cycle types run concurrently for multiple confluence levels
Divergence Analysis
Standard Patterns: Identifies divergences using full candle ranges
Hidden Patterns: Body-only analysis for concealed divergence detection
5 Configurable Correlation Pairs
Pre-configured with major correlations:
BTC/ETH (Cryptocurrency pairs)
NQ/ES (Index futures)
EUR/GBP (Forex majors)
Gold/Silver (Precious metals)
Custom pair slot
Visual Components
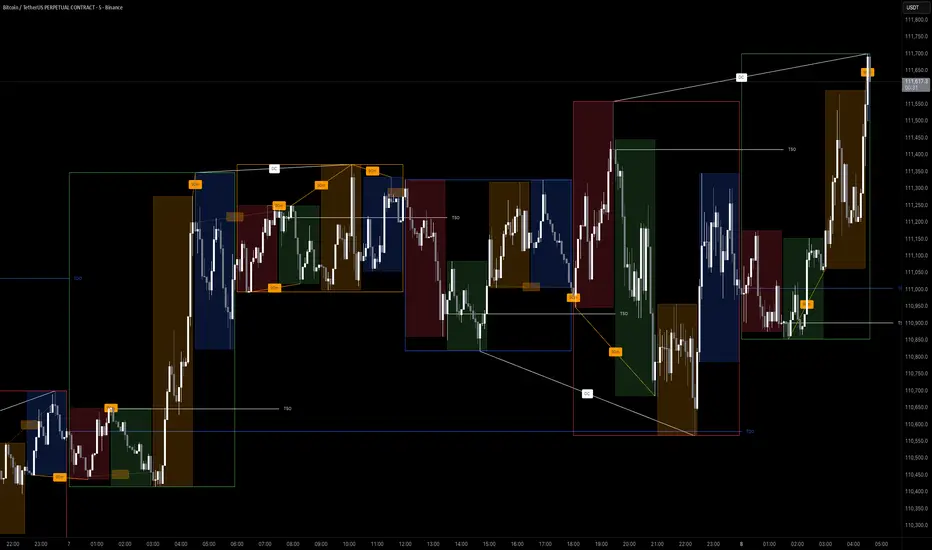
Quarter Boxes: Color-coded Q1-Q4 periods showing price ranges
Cycle Frames: Larger timeframe boundaries for context
SSMT Lines: Connect divergence points between quarters
True Opens: TDO (daily) and TSO (session) reference levels
Dual Labels: Period identification for each timeframe
Trading Application
This indicator is designed to identify divergence patterns that may precede reversals:
Signals are strongest when divergences occur near True Open levels
Multiple timeframe confluence increases signal reliability
Best used in conjunction with other technical analysis methods
The indicator is particularly useful for traders who:
Trade correlated asset pairs
Focus on intraday reversals
Use time-based market structure analysis
Combine multiple confluence factors for entries
Customization
Toggle individual components, adjust colors, control visual density. Configure correlation pairs to match your trading instruments. Debug panel available for detailed analysis.
Important Note
This indicator identifies divergence patterns based on mathematical relationships between correlated assets. Like all technical indicators, it should be used as part of a comprehensive trading approach with proper risk management.
---
Based on time-quarter analysis and correlation divergence concepts. Designed to help identify potential reversal zones through systematic divergence detection across multiple time cycles.
SMT
cd_SMT_Sweep_CISD_CxGeneral
This indicator is designed to show trading opportunities after sweeps of higher timeframe (HTF) highs/lows and, if available, Smart Money Technique (SMT) divergence with a correlated asset, followed by confirmation from a lower timeframe change in state delivery (CISD).
Users can track SMT, Sweep, and CISD levels across nine different timeframes.
________________________________________
Usage and Details
Commonly correlated timeframes are available in the menu by default. Users can also enter other compatible timeframes manually if necessary.
The indicator output is presented as:
• A summary table
• Display on HTF candles
• CISD levels shown as lines
Users can disable any of these from the menu.
Presentations of selected timeframes are displayed only if they are greater than or equal to the active chart timeframe.
From the Show/Hide section, you can control the display of:
• SMT table
• Sweep table
• HTF candles
• CISD levels
• HTF boxes aligned with the active timeframe
________________________________________
SMT Analysis
To receive analysis, users must enter correlated assets in the menu (or adjust them as needed).
If asset X is paired with correlated asset Y, then a separate entry for Y correlated with X is not required.
Four correlation pairs are included by default. Users should check them according to their broker/exchange or define new ones.
Checkboxes at the beginning of each row allow activation/deactivation of pairs.
SMT analysis is performed on the last three candles of each selected HTF.
If one asset makes a new high while the correlated one does not (or one makes a new low while the other does not), this is considered SMT and will be displayed both in the table and on the chart.
Charts without defined correlated assets will not display an SMT table.
________________________________________
Sweep Analysis
For the selected timeframes, the current candle is compared with the previous one.
If price violates the previous level and then pulls back behind it, this is considered a sweep. It is displayed in both the table and on the chart.
Within correlated pairs, the analysis is done separately and shown only in the table.
Example with correlated and non-correlated pairs:
• In the table, X = false, ✓ = true.
• The Sweep Table has two columns for Bullish and Bearish results.
• For correlated pairs, both values appear side by side.
• For undefined pairs, only the active asset is shown.
Example 1: EURUSD and GBPUSD pair
• If both sweep → ✓ ✓
• If one sweeps, the other does not → ✓ X
• If neither sweeps → X X
Example 2: AUDUSD with no correlated pair defined
• If sweep → ✓
• If no sweep → X
________________________________________
HTF Candles
For every HTF enabled by the user, the last three candles (including the current one) are shown on the chart.
SMT and sweep signals are marked where applicable.
________________________________________
CISD Levels
For the selected timeframes, bullish and bearish CISD levels are plotted on the chart.
________________________________________
HTF Boxes
HTF boxes aligned with the active timeframe are displayed on the chart.
Box border colors change according to whether the active HTF candle is bullish or bearish.
________________________________________
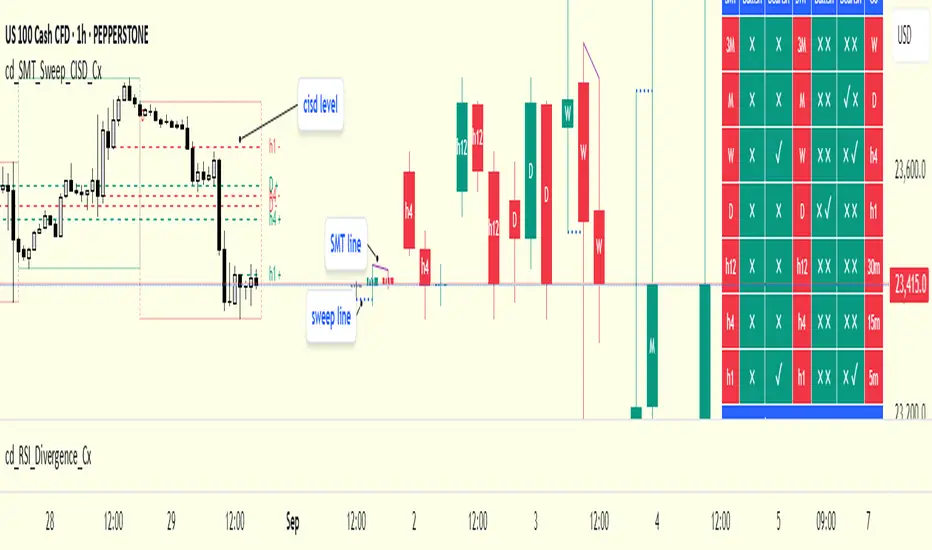
How to Read the Chart?
Let’s break down the example below:
• Active asset: Nasdaq
• Correlated asset: US500 (defined in the menu, confirmed in the table bottom row)
• Active timeframe: H1 → therefore, the HTF box is shown for Daily
• Since a correlated pair is defined, the indicator runs both SMT and Sweep analysis for the selected timeframes. Without correlation, only Sweep analysis would be shown.
Table is prepared for H1 and higher timeframes (as per user selection and active TF).
Observations:
• SMT side → H1 timeframe shows a bearish warning
• Sweep side → Bearish column shows X and ✓
o X → no sweep on Nasdaq
o ✓ → sweep on US500
Meaning: US500 made a new high (+ sweep) while Nasdaq did not → SMT formed.
The last column of the table shows the compatible LTF for confirmation.
For H1, it suggests checking the 5m timeframe.
On the chart:
• CISD levels for selected timeframes are drawn
• SMT line is marked on H1 candles
• Next step: move to 5m chart for CISD confirmation before trading (with other confluences).
Similarly, the Daily row in the table shows a Bullish Sweep on US500.
________________________________________
Alerts
Two alert options are available:
1. Activate Alert (SMT + Sweep):
Triggers if both SMT and Sweep occur in the selected timeframes. (Classic option)
2. Activate Alert (Sweep + Sweep):
Triggers if sweeps occur in both assets of a correlated pair at the same timeframe.
Interpretation:
If SMT + Sweep are already present on higher timeframes, and simultaneous sweeps appear on lower timeframes, this may indicate a strong directional move.
Of course, this must be validated with CISD and other confluences.
________________________________________
HTF CISD Levels
Although CISD levels act as confirmation levels in their own timeframe, observing how price reacts to HTF CISD levels can provide valuable insights for intraday analysis.
POIs overlapping with these levels may be higher priority.
________________________________________
What’s Next in Future Versions?
• Completed CISD confirmations
• Additional alert options
• Plus your feedback and suggestions
________________________________________
Final Note
I’ll be happy to hear your opinions and feedback.
Happy trading!
20/40/60Displays three consecutive, connected range boxes showing high/low price ranges for customizable periods. Boxes are positioned seamlessly with shared boundaries for continuous price action visualization.
Features
Three Connected Boxes: Red (most recent), Orange (middle), Green (earliest) periods
Customizable Positioning: Set range length and starting offset from current bar
Individual Styling: Custom colors, transparency, and border width for each box
Display Controls: Toggle borders, fills, and line visibility
Use Cases
Range Analysis: Compare volatility across time periods, spot breakouts
Support/Resistance: Use box boundaries as potential S/R levels
Market Structure: Visualize recent price development and trend patterns
Key Settings
Range Length: Bars per box (default: 20)
Starting Offset: Bars back from current to position boxes (default: 0)
Style Options: Colors, borders, and visibility controls for each box
Perfect for traders analyzing consecutive price ranges and comparing current conditions to recent historical periods.

SMT for Time-Based Sessions [ufo]SMT for Time-Based Sessions identifies when one asset breaks a session’s high/low while another correlated asset fails to do so. This imbalance often signals engineered liquidity grabs, reversals, or continuation setups. By focusing on divergences within specific trading sessions (London, New York AM, Lunch, New York PM, Asia, Daily or your own custom windows), the tool filters out noise and pinpoints only the most meaningful SMT divergences across multiple symbols in real-time.
Core Concept:
SMT (Smart Money Technique/Tool/Time) is a concept popularized by Inner Circle Trader (ICT) that suggests that when correlated or inversely correlated instruments fail to confirm each other's price movements (e.g., one breaks a high/low while the other doesn’t), it often indicates:
Liquidity manipulation by institutional players
Potential reversal points in the market
Weakness or strength in the current trend
Stop hunt operations before significant moves
This indicator identifies these divergences by comparing your chart symbol against up to two comparison symbols across different sessions and timeframes.
How Time-Based SMT Works:
Unlike basic divergence tools, this indicator is built specifically for Session-Based and Timeframe-Based SMT tracking. It continuously monitors intraday sessions and higher timeframes, then plots divergences the moment they occur.
Time-Based Session SMT
Session Tracking: Monitors highs and lows during each session
Post-Session Analysis: After a session ends, tracks whether price breaks session levels
Divergence Detection: When the main symbol breaks a high/low but comparison symbols don’t (or vice versa), an SMT signal is triggered
(e.g. Nasdaq traded above London high while S&P500 does not)
Visual Confirmation: Lines connect the session reference to the current extreme, with labels showing the diverging session, high/low, and symbol, this information is also displayed in the Info Panel
This will update if a new high/low extreme is made while the SMT is still valid, if invalidated these will be removed from the chart
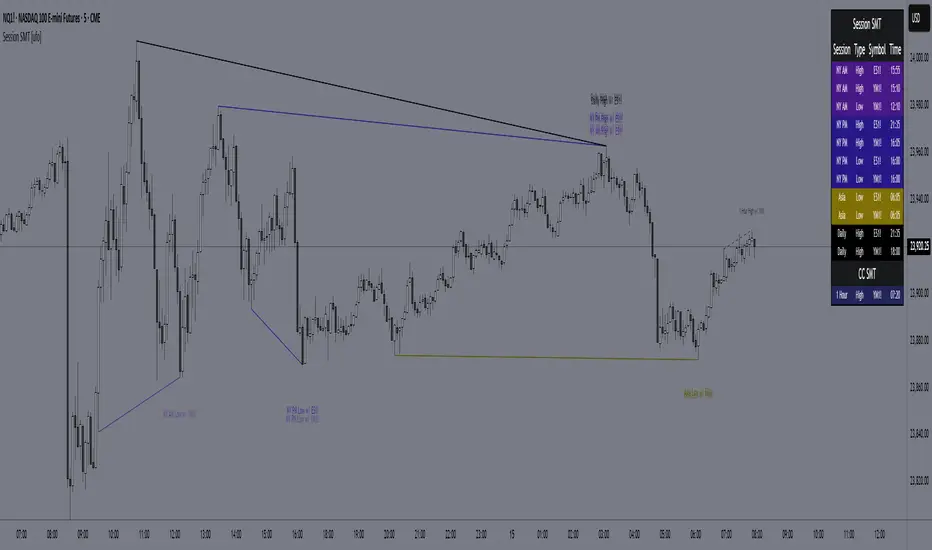
Example:
This NQ chart includes ES and YM as comparison symbols. At 03:20 AM New York time, both ES and YM broke the Asia session low (20:00 – 00:00), while NQ did not. This creates a bullish session divergence , which the indicator immediately detects and plots.
Although the chart shows three symbols for illustration, you don’t need to manually monitor comparison charts when using this indicator, the SMT divergence will be plotted automatically as soon as it occurs
Consecutive Candle SMT (CC SMT)
Previous Candle Reference: Uses the previous candle's high/low from the selected timeframe
Real-Time Comparison: Monitors if current price breaks these levels across all symbols
Instant Detection: Triggers SMT immediately when divergence occurs
Dynamic Updates: Lines and labels update in real-time as new extremes form and are automatically removed if invalidated
Example:
Here I configured CC SMT Timeframe 1 to monitor the previous 4-hour candle’s high/low. On this NQ chart with ES as a comparison symbol, ES broke above the prior 4-hour high at 14:00 New York time, while NQ did not, showing relative weakness creating a bearish CC SMT divergence
This chart is just an illustration. The indicator will automatically plot SMT divergences on your main chart, regardless of the timeframe you’re viewing
How To Use:
This indicator is not a buy/sell signal on its own. Instead, it is designed to highlight Time-Based SMT divergences so you can combine them with your existing trading strategy or model. It should be used as an extra layer of confluence, helping you confirm trade ideas.
Select your comparison symbols
For example:
Futures: NQ vs ES/YM
Forex: EURUSD vs GBPUSD/DXY(inversely)
Crypto: BTC vs ETH
Commodities: Gold vs Silver
Choose which sessions or candle timeframes you want the indicator to monitor
Watch for divergences the indicator plots when one symbol breaks a high/low while the other does not
Use these divergences as confluence, alongside your own strategy and risk management rules
Key Features:
Multiple Comparison Symbols
Symbol 1 & Symbol 2: Compare your main chart against up to 2 correlated instruments
Symbol Inversion: Perfect for inversely correlated pairs (e.g., EURUSD vs DXY)
Session-Based SMT Tracking
Monitors 7 fully customizable trading sessions with the default being:
London Session (2:00-5:00 NY time)
NY AM Session (9:30-12:00 NY time)
Lunch Session (12:00-13:00 NY time)
NY PM Session (13:00-16:00 NY time)
Asia Session (20:00-00:00 NY time)
Custom Session 6 (if you want to add an extra session)
Daily Session (18:00-18:00 NY time)
Fully customizable session times and names
Automatically detects when the main symbol breaks a session high/low while comparison symbols don't (and vice versa)
Consecutive Candle SMT (CC SMT)
Monitors 3 customizable timeframes
Tracking of divergences based on specific timeframe candles (15min, 60min, 4 hour, weekly, etc.)
Identifies when the current price breaks the previous candle's high/low differently than comparison symbols
Maintains history of past SMTs (configurable)
Timeframe 3 supports custom time shifts for non-standard candle boundaries
Example: 90min timeframe with a +60 shift changes the candle range from:
00:00-01:30, 01:30-03:00 etc
to:
01:00-02:30, 02:30-04:00 etc
Visual Customization
Line Styles: Customize the line styles for different symbols
Colors: Unique color schemes for instant session identification
Adjustable Offsets: Fine-tune label positions with multiplier settings
Show/Hide Controls: Complete control over visual elements
Custom Labels: Customize the SMT labels for highs and lows
Information Panel
Active SMT Conditions: Live tracking of all current divergences
Session Names: Clear identification of which session created the SMT
Symbol Information: Shows which comparison symbol is diverging
Timestamps: Optional time display showing when SMT was first detected
Flexible Positioning: 8 different panel positions
Smart Display Modes: Options to hide inactive sessions/timeframes
Alert System
Configurable alerts for specific sessions or timeframes
Get notified when new divergences appear instantly
Clear, informative alert descriptions
How To Setup Alerts:
Enable the "Enable Alerts" in the settings
Choose which sessions/timeframes to receive alerts for by choosing it in the setting below
(If you select "All Sessions" you will only be alerted for all the sessions you have enabled in the indicator settings)
Create an alert (ALT+A shortcut) or click the the 3 dots on the indicator "Add alert on Session SMT "
- Condition = Session SMT
- Function = Any alert() function call
- Alert name (Message) = Anything you prefer (e.g. SMT Alert)
If you want to create another alert for different settings, first input the new settings in the indicator, then create a new alert.
Note: Previous alerts will continue to notify you based on the settings they were originally set for, even if you change the indicator setting.
How This Helps Your Trading:
This tool automates the heavy lifting of tracking divergences across multiple markets and sessions, continuously monitoring highs and lows in real time and plotting only the most meaningful SMT signals so you can focus on execution, not chart-watching.
Smart Money Time (SMT)SMT Divergence – 90m / 30m / 10m (Prev-Cycle, Real-Time, Trailing)
Purpose:
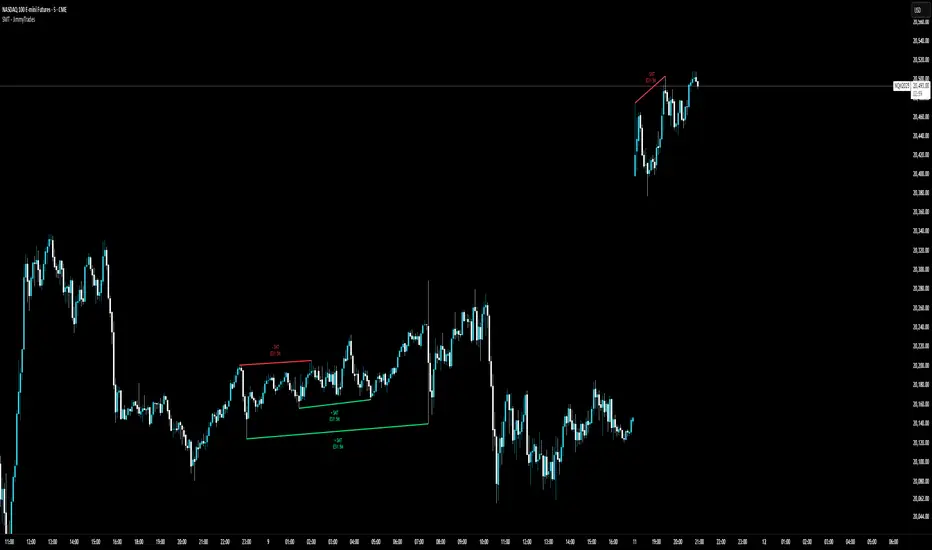
This indicator finds SMT (Smart Money Technique) divergences between two related markets (e.g., CME_MINI:NQ1! vs CME_MINI:ES1! ). It does this per 90m/30m/10m cycles and only compares the current cycle to the immediately previous cycle —never older. It supports three cycle granularities:
90-minute cycles (9 blocks from 02:30–16:00 NY time)
30-minute sub-cycles (27 blocks)
10-minute sub-cycles (81 blocks; exactly 3 per 30-minute cycle)
For each cycle, the script tracks each symbol’s extreme (highest high for potential bearish SMT, lowest low for potential bullish SMT). When the leader sets a new extreme vs its own previous cycle while the lagger fails to do so vs its previous cycle, an SMT divergence is formed and plotted on the chart in real time. Lines trail as price makes new extremes within the same cycle.
What you’ll see on the chart:
A line from the previous cycle’s extreme to the current cycle’s extreme on the symbol pane where the indicator is applied (Primary A).
An optional text label at the current extreme (e.g., “90m SMT”, “30m SMT”, “10m SMT”).
Lines update (“trail”) as the current cycle goes on. When a new cycle begins, tracking resets for that cycle.
Default styling (editable):
90m SMT: solid, width 1, black
30m SMT: solid, width 1, black
10m SMT: dotted, width 1, black
You can toggle the text on/off and change width, style, and colors separately for 90m, 30m, and 10m.
Signals (definitions)
Bearish SMT: One market makes a Higher High vs its own previous cycle, while the other fails to make a Higher High vs its previous cycle.
Bullish SMT: One market makes a Lower Low vs its own previous cycle, while the other fails to make a Lower Low vs its previous cycle.
The line is drawn on Primary A by default.
Settings (explained)
Symbols
Primary Symbol A – the chart’s “leader/lagger” pane the script draws on.
Comparison Symbol B – the second market used for SMT checks.
Detection toggles
Detect SMT: 90m / 30m / 10m – turn on/off detection for each timeframe.
Note: The script always compares current cycle ↔ previous cycle only.
Validate candle direction
When enabled, the bar that makes the new extreme must also close in the confirming direction on that same market:
Bearish SMT: the bar that made the new Higher High must be a down close (close < open).
Bullish SMT: the bar that made the new Lower Low must be an up close (close > open).
This filter removes many “wick-only” probes and reduces false positives.
Turn off if you prefer to register SMTs on any intrabar extreme, regardless of bar close.
Delete SMT when invalidated
After an SMT forms, if the lagger later breaks the previous extreme it initially failed to break, the divergence is considered invalid and the script deletes the line and its label. (An “SMT invalidated” alert can fire if alerts are enabled.)
Enable alerts
Fires on SMT formed (separate messages for 90m/30m/10m and bullish/bearish) and on SMT invalidated.
To use, click Create Alert on the indicator and choose “Any alert() function call”. Use “Once per bar” (or per bar close) to taste.
Appearance – per timeframe (90m / 30m / 10m)
Bullish/Bearish colors, Line width, Line style, Show text (toggle subtitle label).
Text Options
Text color, Text size, Text offset (vertical spacing from the extreme).
How to use
Add to chart and select two related markets, e.g., NQ (A) vs ES (B).
Choose which cycles to monitor (90m / 30m / 10m).
Optionally enable Validate candle direction to demand a confirming close on the bar that made the extreme.
Watch for plotted SMTs:
Bearish SMT (HH vs no HH) often signals potential weakness
Bullish SMT (LL vs no LL) often signals potential strength
Use SMTs as context/confluence—e.g., near session highs/lows, liquidity pools, PD arrays, or your own levels. Combine with structure, order flow, and risk rules.
Turn on alerts to be notified when SMTs form or are invalidated in real time.
Notes & behavior
New-York session timing: Cycles are fixed windows in America/New_York and automatically handle DST.
Real-time & trailing: Lines trail to the most recent extreme within the same cycle but there’s no look-ahead across cycles.
No repaint across cycles: Each signal is strictly current cycle vs previous cycle.
Cleanup: On invalidation the script deletes the label first, then the line, preventing orphan labels.
Tips
10m SMTs are more frequent/noisier; 90m are fewer but more meaningful. Many traders look for multi-frame agreement (e.g., a 30m SMT aligning with a fresh 10m SMT).
If you want fewer signals, keep Validate candle direction on; if you want maximum sensitivity, turn it off.
Disclaimer: Educational use only. Markets are risky; do your own research and manage risk responsibly.

FREEDOM - TJR Model\ FREEDOM – TJR Model\ 🚀
\ Automates TJR’s well-known NQ playbook with clean visuals, filters, and alerts—so you can focus on execution.\
\ Core idea\
1. Trade \ NQ\ in the \ New York session\ 🗽
2. Wait for a \ liquidity sweep\ of a \ prior session\ High/Low (Asia or London) ✂️
3. Confirm with \ SMT (NQ vs ES) divergence\ 🔀
4. Act on a \ proprietary entry signal\ 🔒
5. Risk at the swing 🛡️, target \ untapped internal/session liquidity\ 🎯
This indicator draws those session levels for you, tracks sweeps, detects SMT, applies higher-timeframe confluence, and fires alerts that respect your time window and filters.
---
\ What it draws & detects\
\ • Sessions & Liquidity Sweeps\ 🕒
* Plots \ Asia / London / New York\ session bands.
* On session close, it freezes the session’s \ High/Low\ as dotted “previous-session levels” and \ extends them forward\ until price \ crosses\ (choose \ Wicks\ or \ Close\ ).
* When price takes a previous-session \ High\ → \ Buyside sweep\ ; takes a \ Low\ → \ Sellside sweep\ .
* Optional \ Sweep Zones\ expand around the swept level using an \ ATR(21)\ margin; can auto-fade “fake” sweeps.
\ Tip: Keep “Extend previous session High/Low until cross” ON to maintain a clean roadmap into NY open.\
\ • SMT Divergence (NQ vs ES)\ 🔀
* Classic pivot-to-pivot SMT:
* \ Bearish SMT\ = NQ makes a \ higher high\ while ES does \ not\ .
* \ Bullish SMT\ = NQ makes a \ lower low\ while ES does \ not\ .
* Draws \ lines\ from pivot to pivot (no chart spam), with optional inline “SMT” label and optional confidence \ score\ (0–100) based on strength + recency.
* Context aware:
* Only shows \ Bearish SMT\ after a \ buy-side sweep\ (previous-session High taken).
* Only shows \ Bullish SMT\ after a \ sell-side sweep\ (previous-session Low taken).
* Respects your \ NY time window\ if enabled.
\ • Proprietary Entry Signals\ 🔒
* Prints entry lines + arrows only when your rules align (proprietary detection under the hood).
* Respects:
* \ Session-sweep bias\ (optional): Sells only after buy-side sweep; Buys only after sell-side sweep.
* \ Monotonic filter\ : new Sell must be \ higher\ than last Sell; new Buy must be \ lower\ than last Buy (resets each session).
* \ Minimum distance\ to nearest previous-session dotted level (in ticks).
* \ NY time filter\ window.
* \ HTF confluence\ (see below).
---
\ HTF Confluence (optional)\ 📈
* Choose \ MA slope\ (\ EMA/SMA/RMA/WMA\ ) or \ HH/HL structure\ on a higher timeframe (e.g., 60m/240m).
* Entry arrows and alerts can be gated so they only print when HTF bias agrees with the setup.
\ Tip: Start with EMA 50 on 60m for a smooth directional filter; add HH/HL only if you want stricter structure confirmation.\
---
\ Dashboard (bottom-right)\ 🧩
* \ VWAP state\ :
* \ Overbought\ (🔴) if close > VWAP + (mult × stdev)
* \ Oversold\ (🟢) if close < VWAP − (mult × stdev)
* Otherwise \ Neutral\ (⚪️)
* \ Premium / Discount\ vs previous-session 50% midline: Premium = above (red bias), Discount = below (green bias).
* \ SMT row\ : Bullish / Bearish / Neutral with optional score.
---
\ How to use the settings (quick tour)\
\ ENTRY\
* \ Entry Swing Length\ : lower = more signals.
* \ Confirmation\ : \ Candle Close\ or \ Wicks\ for breakout.
* \ Filter entry by session sweeps\ : enforces “sell after buy-side sweep, buy after sell-side sweep.”
* \ Minimum distance (ticks)\ : blocks entries too close to previous-session dotted levels.
* \ Replay mode\ : keeps entries visible in Bar Replay.
* \ NY Time filter\ : default \ 08:00–14:00 NY\ ; arrows/alerts respect the window.
* \ Arrow offset (ticks)\ : how far above/below the candle to plot the arrow.
\ SESSION SWEEPS\
* Toggle \ Buyside/Sellside zones\ , adjust \ ATR(21)\ margin & length.
* \ Hide Fake Sweep Zones\ (default ON).
* \ Extend H/L until cross\ (Wicks/Close).
* Optional \ daily reset\ for unswept dotted lines.
\ SESSIONS\
* Enable/disable \ Asia, London, NY AM, NY PM\ ; set start/end; choose color; extend midline if desired.
* DST toggles for NY/London.
\ HTF Confluence\
* Turn it ON/OFF; pick timeframe & method (MA slope or HH/HL); set MA type/length or swing length.
\ Dashboard\
* Show/hide table; set VWAP stdev length/multiplier.
* SMT settings: comparison symbol (\ default ES1!\ ), pivot length, show score/labels, recency window, etc.
\ Alerts\ (always last) 🔔
* \ Session line cross\ : choose Highs/Lows and crossing mode (\ Same as extension / Wicks / Close\ ).
* \ Entry alerts\ : \ Filtered / Unfiltered / Both\ .
* \ Filtered\ = respects sweep bias, HTF confluence, minimum distance, monotonic rule, and time window.
* \ Unfiltered\ = ignores sweep bias/HTF/monotonic (still respects minimum distance + time window).
* All entry alerts also respect the \ NY time window\ when enabled.
---
\ Suggested workflow\
* Open NQ on a 1–5m chart.
* Let the dotted \ previous-session H/L\ extend into NY; wait for a \ sweep\ .
* Check \ SMT\ : after buy-side sweep → look for \ bearish SMT\ ; after sell-side sweep → look for \ bullish SMT\ .
* Take the \ proprietary entry\ when filters agree.
* Stop at the swing; aim for \ untapped internal/session liquidity\ .
* Let \ alerts\ handle the monitoring.
---
\ Why traders like it\
* It mirrors the model popularized by \ TJR\ while removing the chart admin: sessions, sweeps, SMT, HTF gating, distances, monotonic sequencing, time windows, and ready-to-use alerts—so your execution stays consistent. ✨
---
\ Disclaimer\ ⚠️
\ This tool is for educational purposes only and does not constitute financial advice. Markets involve risk; always do your own research and test in replay/paper before trading live. FREEDOM – TJR Model is inspired by TJR’s publicly known framework but is not affiliated with, endorsed by, or sponsored by TJR. You are solely responsible for your trading decisions and outcomes.\


SMT Divergences V2 [OutOfOptions]Smart Money Technique (SMT) Divergence is designed to identify discrepancies between correlated assets within the same timeframe. It occurs when two related assets exhibit opposing signals, such as one forming a higher low while the other forms a lower low. This technique is particularly useful for anticipating market shifts or reversals before they become evident through other Premium Discount (PD) Arrays.
This indicator works by identifying the highs and lows that have formed for an asset on the current chart and the correlated symbol defined in the settings. Once a pivot on either asset is formed, it checks if the pivot has taken liquidity as identified by the previous pivot in the same direction (i.e., a new high taking out a previous high). If this is the case and the corresponding asset has not taken a similar pivot, the condition is determined to be a potential valid divergence. The indicator will then filter out SMTs formed by adjacent candles, requiring at least one candle difference between the candles forming the SMT.
If the “Candle Direction Validation” setting is enabled, the indicator will further check both assets to ensure that for bullish SMTs, the last high on both assets was formed by down candle, and for bearish SMTs, the low was formed by an up candle. This check can often eliminate low-probability SMTs that are frequently broken.
The referenced chart shows divergence between Nasdaq (NQ) and S&P 500 (ES) futures, which are normally closely correlated assets that move in the same direction. The lines shown represent bullish and bearish divergences between the two when they are formed. As you can see from the chart, SMT Divergences may not always indicate a reversal, or a reversal might be just a short-term retrace. Therefore, SMT Divergences should not be used independently. However, in conjunction with other PD arrays, they can provide strong confirmation of a change in market direction.
Configurability:
Pivot strength - Indicates how many bars to the left/right of a high for pivot to be considered, recommended to keep at 1 for maximum detection speed
Candle Direction Validation - Additional SMT validation to filter out weak/low-probability SMTs be examining candle direction
Remove Broken SMTs - Keeps the chart clean by removing broken (invalidate) SMTs from the chart, once price moves beyond the outmost edge of the SMT
Work in Realtime - Enabled real-time mode for even faster detection of SMTs
Line Styling for Bullish/Bearish SMTs - Ability to customize line style, color & width for bullish/bearish SMTs
Label Control - Whether or not to show SMT label and if shown what font size & color should be used and if labels should include a tooltip containing information about the SMT
What makes this indicator different:
When used on NQ/ES it will automatically detect the matching the corresponding ticker, i.e. if you have chart on NQU2025 it'll automatically match to ESU2025 and vice-versa. Works for mini/micro/continuous contract
Unlike other SMT indicators, this indicator has an option to remove broken (no longer valid SMTs)
Allows real-time detection of SMTs prior to the pivot being fully formed
Allows validation of SMTs to only display high-probability SMTs, that are more likely to signal a possible reversal
Includes alerting capability for both SMT creation and when the SMT is broken (invalidated)

cd_sweep&cisd_CxOverview:
When the price is at a significant zone/level on a higher time frame (HTF), and it sweeps (breaks through and then closes back below/above) the high or low of the previous HTF candle, it is common to look for a Change in State of Delivery (CISD) on a lower time frame (LTF) to enter a trade.
This model can be summarized as:
HTF Sweep → LTF CISD (Optional: SMT / Divergences)
________________________________________
Working Principle & Details:
1. The indicator monitors price action on the selected HTF and tracks any sweep (violation) of the previous HTF candle's high or low. Simultaneously, it identifies CISD levels on the LTF. If SMT is enabled, it will appear as a label on the chart.
When both HTF sweep and LTF CISD conditions are met, the indicator marks the chart at the open of the next candle and triggers an alert if set.
CISD levels are tracked and updated whenever a new HTF high/low is formed.
2. The indicator monitors the formation of entry models on up to six selected pairs, displaying results in two separate tables:
o HTF Sweep Query Table: Monitors live HTF candles and reports pairs that meet the sweep condition.
o CISD Table: Displays the pairs where a valid entry model has formed. A "🔥" symbol indicates the condition has occurred.
3. Bias Visualization:
Based on the selected HTF, a visual band is shown at the bottom of the chart using the chosen bullish/bearish colors.
Bias is determined by:
o Candle closing above/below the previous one suggesting continuation.
o A failed close after a sweep implying potential reversal.
4. HTF Candles:
Displays HTF candles based on the user-defined time frame.
5. Optional SMT (Smart Money Technique):
Must be enabled in the menu and requires the correlated pair to be entered correctly for accurate results.
Displayed only as a visual confirmation, not a requirement for model formation.
If the currently open symbol sweeps the previous candle while the correlated symbol does not (or vice versa), an "SMT" label appears on the chart.
6. Color & Table Positioning:
Controlled via the settings menu.
________________________________________
Warnings:
• The indicator only marks CISDs that form at HTF high/low zones.
• Entering every time the model forms does not guarantee profitability.
• Waiting for the model to appear at significant HTF levels/zones increases the likelihood of success.
• HTF and LTF selections should follow commonly accepted combinations or user-tested time frames.
• If you want to trigger alerts only for symbols entered in the indicator, ensure the "Use indicator alerts" option is enabled.
• To set alerts for the TradingView watchlist instead, disable the "Use indicator alerts" option.
________________________________________
Feel free to share your thoughts and suggestions.
Happy trading! 💫

HyperFlowIntroduction
HyperFlow is a premium market structure and liquidity rotation model built around the principles of internal inefficiencies, tested imbalances, and delivery shifts. Drawing inspiration from ICT concepts, it provides a high-level framework for identifying smart money footprints and timing entries with precision.
Rather than forecasting direction, HyperFlow focuses on recognizing repeatable delivery behaviors — helping traders visually track liquidity shifts from internal ranges to external objectives with consistency.
Core Philosophy
Markets are governed by the logic of liquidity engineering — the search and destruction of internal inefficiencies (Fair Value Gaps), followed by continuations toward external liquidity.
Timeframes to use:
HTF -> LTF
5m -> 15s
15m -> 1m
1h -> 5m
4h -> 15m
Daily -> 1h
Weekly -> 4h
Monthly -> 1D
HyperFlow identifies these transitions by:
Detecting High Timeframe Fair Value Gaps (HTF FVGs) — structural imbalances created by displacement
Tracking Valid Tests of those FVGs — signaling willingness to respect internal structure
Filtering for Delivery Confirmations — only acting when price delivers with intent through reclaimed imbalances
Mapping Risk and Objective Zones — using recent swing structures to define stop and target logic rooted in market logic
All components are reactive, visual, and non-repainting — designed to highlight structure after it forms, not anticipate it prematurely.
Key Features
Internal Range Liquidity Zones: Cleanly marked HTF imbalances show where price may seek efficiency
Tested FVG Filtering: Signals only form on valid rebalances — we wait for proof, not potential
Shift in Delivery Conditions: Price must show intent to reclaim imbalance before any rotation is considered
Automatic Objective Mapping: Recent structural highs/lows are used to project stop and target zones automatically
Session Filters + Time Alignment: Restrict signals to high-probability hours or defined killzones
Minimal, High-Impact Visuals: Tested/untested FVGs are differentiated by transparency and tone, keeping your chart clean and focused
HyperFlow is built for:
Traders who understand price delivery theory
Analysts studying displacement → reversion → continuation
Those seeking higher timeframe bias alignment through tested structure
Users of ICT-based concepts who want a visual, rules-based companion
This is not a beginner's tool. It’s for those seeking repeatable execution through structure and refinement, not guesswork.
Terms and Conditions
Our charting tools are products provided for informational and educational purposes only and do not constitute financial, investment, or trading advice. Our charting tools are not designed to predict market movements or provide specific recommendations. Users should be aware that past performance is not indicative of future results and should not be relied upon for making financial decisions. By using our charting tools, the purchaser agrees that the seller and the creator are not responsible for any decisions made based on the information provided by these charting tools. The purchaser assumes full responsibility and liability for any actions taken and the consequences thereof, including any loss of money or investments that may occur as a result of using these products. Hence, by purchasing these charting tools, the customer accepts and acknowledges that the seller and the creator are not liable nor responsible for any unwanted outcome that arises from the development, the sale, or the use of these products. Finally, the purchaser indemnifies the seller from any and all liability. If the purchaser was invited through the Friends and Family Program, they acknowledge that the provided discount code only applies to the first initial purchase of any SMCapital product. The purchaser is therefore responsible for cancelling – or requesting to cancel – their subscription in the event that they do not wish to continue using the product at full retail price. If the purchaser no longer wishes to use the products, they must unsubscribe from the membership service, if applicable. We hold no reimbursement, refund, or chargeback policy. Once these Terms and Conditions are accepted by the Customer, before purchase, no reimbursements, refunds or chargebacks will be provided under any circumstances.
By continuing to use these charting tools, the user acknowledges and agrees to the Terms and Conditions outlined in this legal disclaimer.

SMT DivergenceSMT Divergence Indicator
This powerful indicator identifies high-probability reversal points by detecting SMT (Smart Money Technique) divergences between two correlated assets. It spots subtle shifts in market momentum, revealing when one asset fails to confirm the price action of another—often signaling an impending trend change.
Key Features:
Inter-Market Divergence Detection: Automatically compares the price action of the main symbol with a second user-defined asset.
Identifies Key Reversals: Pinpoints both bullish and bearish SMT divergences, highlighting hidden strength in downtrends and underlying weakness in uptrends.
Customizable Pivot Detection: Allows fine-tuning of the pivot length to adjust sensitivity for different market conditions and timeframes.
Flexible Display Modes: Choose between clean 'Lines' connecting the diverging pivots or precise 'Labels' marking the exact high/low points.
Full Visual Customization: Complete control over the colors and line thickness for seamless integration with your existing chart layout.
Built-in Alerts: Stay notified of every potential opportunity with alerts for both bullish and bearish signals.
Settings:
Core Parameters:
Comparison Symbol: Select the second asset to compare against for divergence analysis (e.g., NQ1! if you are charting ES1!).
Pivot Length: Defines the number of bars to the left and right required to confirm a pivot high or low.
Visual Settings:
Display Style: Choose to visualize divergences as 'Lines' or 'Labels'.
Bearish/Bullish Color: Set custom colors for bearish and bullish divergence indicators.
Line Width: Adjust the thickness of the divergence lines for optimal visibility.
Perfect for traders who utilize inter-market analysis to confirm trade ideas. The SMT Divergence indicator provides a crucial edge by exposing non-confirmations between related assets, allowing for earlier and more confident entries into potential market reversals.

BOS mark-out (by Lumiere)Advanced BOS Detection with Strict Swing Confirmation
This indicator implements BOS detection with several unique features:
🔹 Dual-Candle Swing Validation - Unlike most BOS indicators that use single candle swings, this uses a two-candle confirmation for swing highs/lows, analyzing both the candle wicks and body transitions.
🔹 Directional Lock System - Implements a state machine that prevents duplicate signals until an opposite-direction BOS occurs, reducing noise.
🔹 Precision Wick Analysis - Compares wicks between the reversal candle and confirmation candle to identify the true swing point.
🔹 Real-Time Update & Live Market Adaptation – The indicator continuously monitors price action and instantly updates BOS signals as new candles form, ensuring you never miss a BOS.
How It Differs From Other BOS Indicators:
Most public BOS indicators use simple HH/HL or LH/LL detection.
Many don't implement the directional locking mechanism.
Few use the two-candle wick comparison approach.
Wick-Based Precision uses the extreme wicks of two candles (not just the body).
Strict Confirmation requires a close beyond the swing point (no "wick breaks" counted).
Usage Examples:
🟦 Bullish BOS:
A green candle closes, followed by a red candle. This will be the new high, and if the next candle closes above the highest wick of those two, it will be a BOS (only if we had a bearish BOS before)
🟥 Bearish BOS:
A red candle closes, followed by a green candle. This will be the new low, and if the next candle closes below the lowest wick of those two, it will be a BOS (only if we had a Bullish BOS before)

ICT HTF Candles [Pro] (fadi)The ICT HTF Candles shows you multi-timeframe price action by plotting up to six higher timeframe candles on your chart, scaled to real price levels. Set candle counts per timeframe or toggle them off for a clean view, saving you time switching between charts. This helps you spot trends and reversals quickly, align trades with the market’s direction, and time setups like sweeps or bounces better. From scalping on the 1m to swinging on the 4H, it simplifies ICT and Smart Money Concepts (SMC), revealing trend shifts and institutional moves clearly. Once you use it, trading without this clarity just won’t feel right.
Key Features:
In-Depth Price Action Levels
These levels track ICT PD arrays and confluences across timeframes, making it easy to see how price action flows from higher timeframes and what your setup faces. Is your 5m trade about to run into a 1H bearish order block? Did it bounce off a higher timeframe FVG and create an SMT with a correlated asset? They make your chart a clear roadmap to market structure, helping you find strong setups, save time, and align with institutional moves:
Change in State of Delivery (CISD): In ICT trading, CISD marks potential reversal levels on each timeframe by showing the open of the highest series of up (green) candles for a bullish shift or the open of the lowest series of down (red) candles for a bearish shift. These levels are set at the opening price of the first candle in those runs, highlighting where the market turns. The indicator makes these levels easy to spot across timeframes, so you can track reversal points clearly. You can set your own confirmation criteria—a close or wick above/below the CISD line (bearish/bullish) or a close or wick above/below the high/low—to verify the CISD level cross. When confirmed, there is a high probability that we have a change in trend, and a reversal order block forms. CISD helps you track these reversal levels and confirm market shifts, making multi-timeframe analysis straightforward.
Order Blocks: When a CISD level cross is confirmed, the price is now below a series of up (green) candles or above a series of down (red) candles, marking these candles as order blocks that usually support the new trend direction. The indicator shows these levels clearly across timeframes, making it easy to spot high-probability reversal or consolidation areas. Keep in mind that price may sometimes move to mitigate an imbalance, so use your best judgment based on your multi-timeframe analysis to confirm they meet your trading criteria.
Trend Bias: Traders often struggle figuring out market bias—guessing the trend wrong, losing on trades against the flow, or missing how lower and higher timeframes line up. The Trend Bias feature tracks order blocks and change in state of delivery, displaying bullish or bearish trends for each timeframe to help you choose trades that go with the market’s direction. The indicator shows these trends clearly across timeframes, so you can quickly see if the 5m matches the 1H or if you’re going against the bigger trend. This makes it easier to avoid bad trades and make decisions faster, keeping you on track with setups that follow the main trend.
Immediate Rebalance: When looking at price action, you’ll see the market doesn’t usually leave behind many Fair Value Gaps (FVGs). That’s because the market is efficient and always rebalancing any inefficiencies. When the market starts a strong move, the last candle will usually close above the previous candle high (for up moves) or below the low (for down moves). At this point, the market will do one of two things: immediately rebalance by retracing first, or have a small retracement but leave behind an FVG. The Immediate Rebalance feature tracks rebalance levels across multiple timeframes, clearly showing where price rebalances. This helps traders have a better expectation of how the market may need to retrace and anticipate Power of Three (PO3) setups by being ready for a Judas swing to rebalance the imbalance.
Fair Value Gaps and Volume Imbalances: If the market fails to immediately rebalance, it will usually attempt to come back and rebalance it at a later time. FVGs and VIs give you a clear area where the price might be heading if it starts breaking structure on lower timeframes. These inefficiencies—price gaps (FVGs) or aggressive moves (VIs)—show where the market’s working to fix imbalances. The Fair Value Gaps and Volume Imbalances feature tracks these levels across timeframes.
Previous Candle Levels: The Previous Candle Levels feature marks the high, low, and middle of the prior candle on each timeframe, helping you identify key price levels for sweeps, bounces, or breakouts. It tracks the candle’s high and low as its extremes and the middle as the 50% mark, which you can set to calculate using the high-to-low range or the open-to-close range. These levels can provide tradable setups on lower timeframes.
Smart Money Techniques (SMT): What’s an ICT indicator without an SMT feature to track cracks in correlated assets? The ICT HTF Candles monitors your chosen correlated assets, like EUR/USD and GBP/USD or SQ and NQ, for signs of strength or weakness to use as confluence with other features and build the case for A+ setups. The SMT feature spots divergences when one asset makes a higher high or lower low while the other doesn’t follow, hinting at potential reversals or market shifts. It tests SMT using two immediate candles, since higher timeframes (HTFs) create larger gaps on lower timeframes. Traders can easily see these divergence levels, like a 15m SMT lining up with a 1H order block or CISD, helping you confirm high-probability setups and strengthen trade entries with multi-timeframe confluence.

SMT - JimmyTrades🔧 SMT – JimmyTrades: Publication Rules and User Guide
📌 What This Script Does
This script detects Smart Money Traps (SMT) Divergences between the instrument on your chart and a comparative symbol (default: ES). It automatically plots both confirmed and unconfirmed bullish and bearish SMT setups across multiple timeframes.
These SMT divergences can help traders:
Identify potential reversal points
Confirm high-probability entries in line with smart money behavior
Enhance bias when confluence aligns with other market structure or liquidity factors
⚙️ Important Settings
Please make sure you correctly configure the following inputs:
Symbol: The comparative asset to check divergence against. Common examples: ES, NQ, SPX.
Session Type: Ensure this matches your chart’s session setting: Extended or Regular.
Adjustment Type: Match this to your chart (None, Dividends, or Splits) under TradingView’s chart settings (bottom-right corner).
Pivot Lookback: Controls the sensitivity of divergence detection (default is 15). Higher values reduce signal frequency.
Timeframes: You can enable up to six timeframes independently for SMT scanning.
🟢 Bullish SMT Signals
Bullish SMTs are identified when price on your chart makes a lower low, but the comparative symbol (e.g., ES) does not, suggesting potential accumulation or trap liquidity.
🔴 Bearish SMT Signals
Bearish SMTs are flagged when your chart makes a higher high, while the comparative symbol fails to do so, hinting at distribution or a stop run setup.
📈 How to Use This Script
Add the indicator to your chart.
Set the correct comparative symbol (e.g., ES for NQ, SPX for SPY, etc.).
Choose your preferred timeframes.
Watch for unconfirmed SMTs (dotted lines) as potential early warnings.
Look for confirmed SMTs (solid lines) once price respects the divergence zone for several bars.
Combine with structure, liquidity sweeps, killzones, and high-impact news for higher confluence.
🧠 Best Practices
Use SMT signals as part of a broader trade plan—not standalone entries.
Focus on SMTs forming after liquidity sweeps or during session opens (London/NY).
Combine with your higher-timeframe bias, breaker blocks, or Pegasus/Unicorn entry models.
⚠️ Limitations
Historical backtest may show perfect SMTs—real-time confirmation requires patience.
SMTs may not play out without proper context—avoid blindly entering based on signal alone.
This script is not financial advice—use at your own discretion and always manage risk.
Quarterly Theory ICT 05 [TradingFinder] Doubling Theory Signals🔵 Introduction
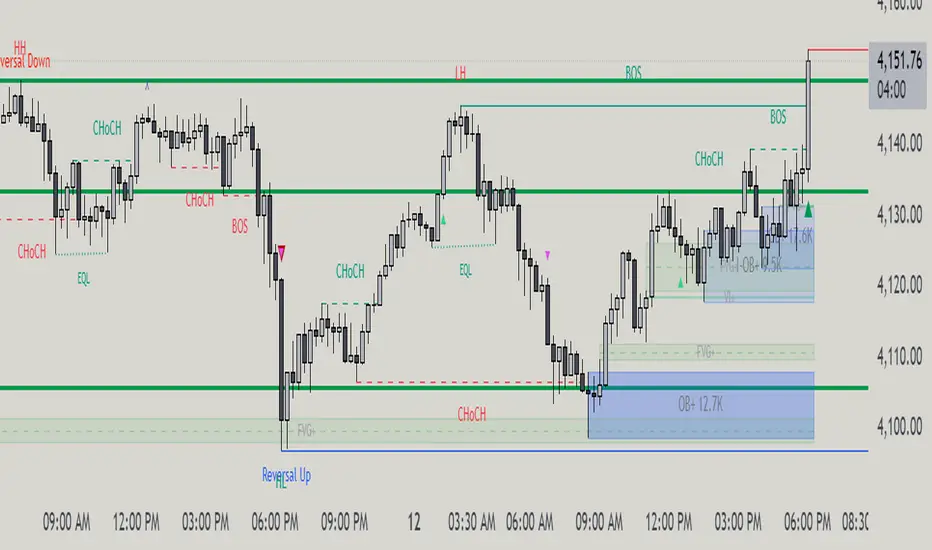
Doubling Theory is an advanced approach to price action and market structure analysis that uniquely combines time-based analysis with key Smart Money concepts such as SMT (Smart Money Technique), SSMT (Sequential SMT), Liquidity Sweep, and the Quarterly Theory ICT.
By leveraging fractal time structures and precisely identifying liquidity zones, this method aims to reveal institutional activity specifically smart money entry and exit points hidden within price movements.
At its core, the market is divided into two structural phases: Doubling 1 and Doubling 2. Each phase contains four quarters (Q1 through Q4), which follow the logic of the Quarterly Theory: Accumulation, Manipulation (Judas Swing), Distribution, and Continuation/Reversal.
These segments are anchored by the True Open, allowing for precise alignment with cyclical market behavior and providing a deeper structural interpretation of price action.
During Doubling 1, a Sequential SMT (SSMT) Divergence typically forms between two correlated assets. This time-structured divergence occurs between two swing points positioned in separate quarters (e.g., Q1 and Q2), where one asset breaks a significant low or high, while the second asset fails to confirm it. This lack of confirmation—especially when aligned with the Manipulation and Accumulation phases—often signals early smart money involvement.
Following this, the highest and lowest price points from Doubling 1 are designated as liquidity zones. As the market transitions into Doubling 2, it commonly returns to these zones in a calculated move known as a Liquidity Sweep—a sharp, engineered spike intended to trigger stop orders and pending positions. This sweep, often orchestrated by institutional players, facilitates entry into large positions with minimal slippage.
Bullish :
Bearish :
🔵 How to Use
Applying Doubling Theory requires a simultaneous understanding of temporal structure and inter-asset behavioral divergence. The method unfolds over two main phases—Doubling 1 and Doubling 2—each divided into four quarters (Q1 to Q4).
The first phase focuses on identifying a Sequential SMT (SSMT) divergence, which forms when two correlated assets (e.g., EURUSD and GBPUSD, or NQ and ES) react differently to key price levels across distinct quarters. For example, one asset may break a previous low while the other maintains structure. This misalignment—especially in Q2, the Manipulation phase—often indicates early smart money accumulation or distribution.
Once this divergence is observed, the extreme highs and lows of Doubling 1 are marked as liquidity zones. In Doubling 2, the market gravitates back toward these zones, executing a Liquidity Sweep.
This move is deliberate—designed to activate clustered stop-loss and pending orders and to exploit pockets of resting liquidity. These sweeps are typically driven by institutional forces looking to absorb liquidity and position themselves ahead of the next major price move.
The key to execution lies in the fact that, during the sweep in Doubling 2, a classic SMT divergence should also appear between the two assets. This indicates a weakening of the previous trend and adds an extra layer of confirmation.
🟣 Bullish Doubling Theory
In the bullish scenario, Doubling 1 begins with a bullish SSMT divergence, where one asset forms a lower low while the other maintains its structure. This divergence signals weakening bearish momentum and possible smart money accumulation. In Doubling 2, the market returns to the previous low and sweeps the liquidity zone—breaking below it on one asset, while the second fails to confirm, forming a bullish SMT divergence.
f this move is followed by a bullish PSP and a clear market structure break (MSB), a long entry is triggered. The stop-loss is placed just below the swept liquidity zone, while the target is set in the premium zone, anticipating a move driven by institutional buyers.
🟣 Bearish Doubling Theory
The bearish scenario follows the same structure in reverse. In Doubling 1, a bearish SSMT divergence occurs when one asset prints a higher high while the other fails to do so. This suggests distribution and weakening buying pressure. Then, in Doubling 2, the market returns to the previous high and executes a liquidity sweep, targeting trapped buyers.
A bearish SMT divergence appears, confirming the move, followed by a bearish PSP on the lower timeframe. A short position is initiated after a confirmed MSB, with the stop-loss placed
🔵 Settings
⚙️ Logical Settings
Quarterly Cycles Type : Select the time segmentation method for SMT analysis.
Available modes include : Yearly, Monthly, Weekly, Daily, 90 Minute, and Micro.
These define how the indicator divides market time into Q1–Q4 cycles.
Symbol : Choose the secondary asset to compare with the main chart asset (e.g., XAUUSD, US100, GBPUSD).
Pivot Period : Sets the sensitivity of the pivot detection algorithm. A smaller value increases responsiveness to price swings.
Pivot Sync Threshold : The maximum allowed difference (in bars) between pivots of the two assets for them to be compared.
Validity Pivot Length : Defines the time window (in bars) during which a divergence remains valid before it's considered outdated.
🎨 Display Settings
Show Cycle :Toggles the visual display of the current Quarter (Q1 to Q4) based on the selected time segmentation
Show Cycle Label : Shows the name (e.g., "Q2") of each detected Quarter on the chart.
Show Labels : Displays dynamic labels (e.g., “Q2”, “Bullish SMT”, “Sweep”) at relevant points.
Show Lines : Draws connection lines between key pivot or divergence points.
Color Settings : Allows customization of colors for bullish and bearish elements (lines, labels, and shapes)
🔔 Alert Settings
Alert Name : Custom name for the alert messages (used in TradingView’s alert system).
Message Frequenc y:
All : Every signal triggers an alert.
Once Per Bar : Alerts once per bar regardless of how many signals occur.
Per Bar Close : Only triggers when the bar closes and the signal still exists.
Time Zone Display : Choose the time zone in which alert timestamps are displayed (e.g., UTC).
Bullish SMT Divergence Alert : Enable/disable alerts specifically for bullish signals.
Bearish SMT Divergence Alert : Enable/disable alerts specifically for bearish signals
🔵 Conclusion
Doubling Theory is a powerful and structured framework within the realm of Smart Money Concepts and ICT methodology, enabling traders to detect high-probability reversal points with precision. By integrating SSMT, SMT, Liquidity Sweeps, and the Quarterly Theory into a unified system, this approach shifts the focus from reactive trading to anticipatory analysis—anchored in time, structure, and liquidity.
What makes Doubling Theory stand out is its logical synergy of time cycles, behavioral divergence, liquidity targeting, and institutional confirmation. In both bullish and bearish scenarios, it provides clearly defined entry and exit strategies, allowing traders to engage the market with confidence, controlled risk, and deeper insight into the mechanics of price manipulation and smart money footprints.

Intraday Pivot Highs & Lows (Asia London NY)Intraday Pivot Highs & Lows (Asia London NY)
Script Description
This TradingView indicator is optimized for Forex, scalping, intraday, and day trading strategies. It accurately plots Pivot Points and levels, high/low, support and resistance levels. These are clearly identified to aid the trader during killzone sessions and session opens. Ideal for scalp trading, intraday sessions, and leveraging SMT (Smart Money Techniques). Utilize these Price Levels effectively during London Open, NY Open, and the Asia Session, utilizing Market Structure to pinpoint key levels and reversal zones for successful trading. Improve your Trade Setups, recognize reliable Chart Patterns, identify critical Price Pivots, and trade confidently off Institutional Levels.
This script marks the intraday pivot highs, lows and midpoints retracement levels for
Asia
London
New York
It also plots the previous day's high, low, midpoint, and 0.618 Fibonacci retracement levels, providing traders with critical price reference points for making intraday trading decisions.
Originality & Usefulness
This indicator uniquely integrates pivot calculations across three major Forex sessions (Asia, London, NY), clearly delineating session boundaries.
It enhances visibility by using distinct styling
solid for New York
dashed for London
dotted lines for Asia
And colour co-ordinated labeling, improving traders' ability to identify important intraday price action zones efficiently. Unlike standard pivot indicators, this script emphasizes session-specific trading dynamics.
### Key Features ###
Session-Based Levels: Automatically plots high, low, midpoint, and Fibonacci (.618) levels for each major session (Asia, London, NY).
Distinct Visual Cues: Lines and labels use session-specific styles and colors to easily differentiate between sessions.
Previous Day Reference: Clearly plots and labels yesterday's high, low, midpoint, and Fibonacci levels.
Flexible Visibility: Traders can set timeframe visibility to maintain clean charts on higher timeframes.
### How It Works
At the start of next day's session, previous session lines are cleared, ensuring the chart remains uncluttered.
High, low, midpoint, and Fibonacci retracement levels (.618) are dynamically calculated and displayed at the close of each session.
All session levels remain visible until the start of the next respective session, providing continuous actionable insights.
Trading Application:
Session highs and lows act as strong intraday support and resistance zones.
Midpoints and Fibonacci levels are effective for identifying potential reversal zones and retracements.
Daily levels provide a broader context, useful for gauging intraday volatility and range.
### Limitations and Considerations ##
Best used on liquid assets with clear session-based price action, such as Forex major pairs, if used on indexes make sure they contain 24 hour price action not just New York session.
This indicator is designed to streamline intraday trading by clearly marking essential pivot points and session-based levels, significantly improving traders' market context and decision-making accuracy. Can be used to enhance SMT decision making when scalping killzones.

Time-Based Fair Value Gaps (FVG) with Inversions (iFVG)Overview
The Time-Based Fair Value Gaps (FVG) with Inversions (iFVG) (ICT/SMT) indicator is a specialized tool designed for traders using Inner Circle Trader (ICT) methodologies. Inspired by LuxAlgo's Fair Value Gap indicator, this script introduces significant enhancements by integrating ICT principles, focusing on precise time-based FVG detection, inversion tracking, and retest signals tailored for institutional trading strategies. Unlike LuxAlgo’s general FVG approach, this indicator filters FVGs within customizable 10-minute windows aligned with ICT’s macro timeframes and incorporates ICT-specific concepts like mitigation, liquidity grabs, and session-based gap prioritization.
This tool is optimized for 1–5 minute charts, though probably best for 1 minute charts, identifying bullish and bearish FVGs, tracking their mitigation into inverted FVGs (iFVGs) as key support/resistance zones, and generating retest signals with customizable “Close” or “Wick” confirmation. Features like ATR-based filtering, optional FVG labels, mitigation removal, and session-specific FVG detection (e.g., first FVG in AM/PM sessions) make it a powerful tool for ICT traders.
Originality and Improvements
While inspired by LuxAlgo’s FVG indicator (credit to LuxAlgo for their foundational work), this script significantly extends the original concept by:
1. Time-Based FVG Detection: Unlike LuxAlgo’s continuous FVG identification, this script filters FVGs within user-defined 10-minute windows each hour (:00–:10, :10–:20, etc.), aligning with ICT’s emphasis on specific periods of institutional activity, such as hourly opens/closes or kill zones (e.g., New York 7:00–11:00 AM EST). This ensures FVGs are relevant to high-probability ICT setups.
2. Session-Specific First FVG Option: A unique feature allows traders to display only the first FVG in ICT-defined AM (9:30–10:00 AM EST) or PM (1:30–2:00 PM EST) sessions, reflecting ICT’s focus on initial market imbalances during key liquidity events.
3. ICT-Driven Mitigation and Inversion Logic: The script tracks FVG mitigation (when price closes through a gap) and converts mitigated FVGs into iFVGs, which serve as ICT-style support/resistance zones. This aligns with ICT’s view that mitigated gaps become critical reversal points, unlike LuxAlgo’s simpler gap display.
4. Customizable Retest Signals: Retest signals for iFVGs are configurable for “Close” (conservative, requiring candle body confirmation) or “Wick” (faster, using highs/lows), catering to ICT traders’ need for precise entry timing during liquidity grabs or Judas swings.
5. ATR Filtering and Mitigation Removal: An optional ATR filter ensures only significant FVGs are displayed, reducing noise, while mitigation removal declutters the chart by removing filled gaps, aligning with ICT’s principle that mitigated gaps lose relevance unless inverted.
6. Timezone and Timeframe Safeguards: A timezone offset setting aligns FVG detection with EST for ICT’s New York-centric strategies, and a timeframe warning alerts users to avoid ≥1-hour charts, ensuring accuracy in time-based filtering.
These enhancements make the script a distinct tool that builds on LuxAlgo’s foundation while offering ICT traders a tailored, high-precision solution.
How It Works
FVG Detection
FVGs are identified when a candle’s low is higher than the high of two candles prior (bullish FVG) or a candle’s high is lower than the low of two candles prior (bearish FVG). Detection is restricted to:
• User-selected 10-minute windows (e.g., :00–:10, :50–:60) to capture ICT-relevant periods like hourly transitions.
• AM/PM session first FVGs (if enabled), focusing on 9:30–10:00 AM or 1:30–2:00 PM EST for key market opens.
An optional ATR filter (default: 0.25× ATR) ensures only gaps larger than the threshold are displayed, prioritizing significant imbalances.
Mitigation and Inversion
When price closes through an FVG (e.g., below a bullish FVG’s bottom), the FVG is mitigated and becomes an iFVG, plotted as a support/resistance zone. iFVGs are critical in ICT for identifying reversal points where institutional orders accumulate.
Retest Signals
The script generates signals when price retests an iFVG:
• Close: Triggers when the candle body confirms the retest (conservative, lower noise).
• Wick: Triggers when the candle’s high/low touches the iFVG (faster, higher sensitivity). Signals are visualized with triangular markers (▲ for bullish, ▼ for bearish) and can trigger alerts.
Visualization
• FVGs: Displayed as colored boxes (green for bullish, red for bearish) with optional “Bull FVG”/“Bear FVG” labels.
• iFVGs: Shown as extended boxes with dashed midlines, limited to the user-defined number of recent zones (default: 5).
• Mitigation Removal: Mitigated FVGs/iFVGs are removed (if enabled) to keep the chart clean.
How to Use
Recommended Settings
• Timeframe: Use 1–5 minute charts for precision, avoiding ≥1-hour timeframes (a warning label appears if misconfigured).
• Time Windows: Enable :00–:10 and :50–:60 for hourly open/close FVGs, or use the “Show only 1st presented FVG” option for AM/PM session focus.
• ATR Filter: Keep enabled (multiplier 0.25–0.5) for significant gaps; disable on 1-minute charts for more FVGs during volatility.
• Signal Preference: Use “Close” for conservative entries, “Wick” for aggressive setups.
• Timezone Offset: Set to -5 for EST (or -4 for EDT) to align with ICT’s New York session.
Trading Strategy
1. Macro Timeframes: Focus on New York (7:00–11:00 AM EST) or London (2:00–5:00 AM EST) kill zones for high institutional activity.
2. FVG Entries: Trade bullish FVGs as support in uptrends or bearish FVGs as resistance in downtrends, especially in :00–:10 or :50–:60 windows.
3. iFVG Retests: Enter on retest signals (▲/▼) during liquidity grabs or Judas swings, using “Close” for confirmation or “Wick” for speed.
4. Session FVGs: Use the “Show only 1st presented FVG” option to target the first gap in AM/PM sessions, often tied to ICT’s market maker algorithms.
5. Risk Management: Combine with ICT concepts like order blocks or breaker blocks for confluence, and set stops beyond FVG/iFVG boundaries.
Alerts
Set alerts for:
• “Bullish FVG Detected”/“Bearish FVG Detected”: New FVGs in selected windows.
• “Bullish Signal”/“Bearish Signal”: iFVG retest confirmations.
Settings Description
• Show Last (1–100, default: 5): Number of recent iFVGs to display. Lower values reduce clutter.
• Show only 1st presented FVG : Limits FVGs to the first in 9:30–10:00 AM or 1:30–2:00 PM EST sessions (overrides time window checkboxes).
• Time Window Checkboxes: Enable/disable FVG detection in 10-minute windows (:00–:10, :10–:20, etc.). All enabled by default.
• Signal Preference: “Close” (default) or “Wick” for iFVG retest signals.
• Use ATR Filter: Enables ATR-based size filtering (default: true).
• ATR Multiplier (0–∞, default: 0.25): Sets FVG size threshold (higher values = larger gaps).
• Remove Mitigated FVGs: Removes filled FVGs/iFVGs (default: true).
• Show FVG Labels: Displays “Bull FVG”/“Bear FVG” labels (default: true).
• Timezone Offset (-12 to 12, default: -5): Aligns time windows with EST.
• Colors: Customize bullish (green), bearish (red), and midline (gray) colors.
Why Use This Indicator?
This indicator empowers ICT traders with a tool that goes beyond generic FVG detection, offering precise, time-filtered gaps and inversion tracking aligned with institutional trading principles. By focusing on ICT’s macro timeframes, session-specific imbalances, and customizable signal logic, it provides a clear edge for scalping, swing trading, or reversal setups in high-liquidity markets.

Supply and Demand Order Blocks - Nadeem Al-QahwiThis advanced order block detection system identifies key supply and demand zones on your chart using a proprietary multi-factor algorithm. Unlike basic implementations that only look for engulfing patterns, this indicator incorporates price momentum, volume confirmation, and swing point analysis to filter out false signals and highlight only the most significant trading zones.
Unique Features
Dual Detection System:
Identifies both internal order blocks (within trends) and swing order blocks (at market turns)
Separate customization for each type allows focused analysis
Smart Zone Validation:
Dynamic strength calculation based on price rejection intensity
Timeframe-sensitive filtering (automatically adjusts for different chart intervals)
Minimum price movement threshold to eliminate insignificant zones
Advanced Visualization:
Three display modes (Boxes & Levels, Boxes Only, Levels Only)
Gradient coloring system showing zone strength intensity
Configurable midline markers for precise entry/exit planning
Methodology
The indicator scans the specified lookback period for:
Bullish Order Blocks: Last bearish candle before a sustained upward move
Bearish Order Blocks: Last bullish candle before a sustained downward move
Each potential zone is evaluated using:
Price Action Confirmation:
Minimum required price move (configurable as percentage)
Consecutive closes beyond the order block range
Volume Analysis (implied through price movement):
Significant expansion beyond the zone
Sustained momentum after breakout
Zone Quality Filters:
Overlap prevention (merges similar zones)
Strength ranking system (prioritizes zones with strongest reactions)
Usage Instructions
Primary Settings:
Adjust lookback period (default 500 bars)
Select display style based on your trading needs
Zone Customization:
Internal Order Blocks: Best for trending markets
Swing Order Blocks: Ideal for reversal trading
Configure colors and styles for visual clarity
Advanced Filters:
Minimum price move: Increase for higher timeframes
Overlap threshold: Adjust based on market volatility
Strength filter: Focus only on high-probability zones
Trading Applications
Trend Trading: Use internal order blocks as continuation signals
Reversal Trading: Swing order blocks mark potential turning points
Risk Management: Zone boundaries serve as natural stop levels
Multiple Timeframe Analysis: Combine settings for different chart intervals
Originality Statement
This implementation differs from basic order block indicators through:
Proprietary strength calculation algorithm
Adaptive timeframe filtering
Intelligent zone merging technology
Configurable display system for personalized charting
While the concept of order blocks is not novel, this particular implementation adds significant value through its sophisticated filtering mechanisms and customizable visualization options that aren't available in open-source alternatives.
Quarterly Theory ICT 04 [TradingFinder] SSMT 4Quarter Divergence🔵 Introduction
Sequential SMT Divergence is an advanced price-action-based analytical technique rooted in the ICT (Inner Circle Trader) methodology. Its primary objective is to identify early-stage divergences between correlated assets within precise time structures. This tool not only breaks down market structure but also enables traders to detect engineered liquidity traps before the market reacts.
In simple terms, SMT (Smart Money Technique) occurs when two correlated assets—such as indices (ES and NQ), currency pairs (EURUSD and GBPUSD), or commodities (Gold and Silver)—exhibit different reactions at key price levels (swing highs or lows). This lack of alignment is often a sign of smart money manipulation and signals a lack of confirmation in the ongoing trend—hinting at an imminent reversal or at least a pause in momentum.
In its Sequential form, SMT divergences are examined through a more granular temporal lens—between intraday quarters (Q1 through Q4). When SMT appears at the transition from one quarter to another (e.g., Q1 to Q2 or Q3 to Q4), the signal becomes significantly more powerful, often aligning with a critical phase in the Quarterly Theory—a framework that segments market behavior into four distinct phases: Accumulation, Manipulation, Distribution, and Reversal/Continuation.
For instance, a Bullish SMT forms when one asset prints a new low while its correlated counterpart fails to break the corresponding low from the previous quarter. This usually indicates absorption of selling pressure and the beginning of accumulation by smart money. Conversely, a Bearish SMT arises when one asset makes a higher high, but the second asset fails to confirm, signaling distribution or a fake-out before a decline.
However, SMT alone is not enough. To confirm a true Market Structure Break (MSB), the appearance of a Precision Swing Point (PSP) is essential—a specific candlestick formation on a lower timeframe (typically 5 to 15 minutes) that reveals the entry of institutional participants. The combination of SMT and PSP provides a more accurate entry point and better understanding of premium and discount zones.
The Sequential SMT Indicator, introduced in this article, dynamically scans charts for such divergence patterns across multiple sessions. It is applicable to various markets including Forex, crypto, commodities, and indices, and shows particularly strong performance during mid-week sessions (Wednesdays and Thursdays)—when most weekly highs and lows tend to form.
Bullish Sequential SMT :
Bearish Sequential SMT :
🔵 How to Use
The Sequential SMT (SSMT) indicator is designed to detect time and structure-based divergences between two correlated assets. This divergence occurs when both assets print a similar swing (high or low) in the previous quarter (e.g., Q3), but in the current quarter (e.g., Q4), only one asset manages to break that swing level—while the other fails to reach it.
This temporal mismatch is precisely identified by the SSMT indicator and often signals smart money activity, a market phase transition, or even the presence of an engineered liquidity trap. The signal becomes especially powerful when paired with a Precision Swing Point (PSP)—a confirming candle on lower timeframes (5m–15m) that typically indicates a market structure break (MSB) and the entry of smart liquidity.
🟣 Bullish Sequential SMT
In the previous quarter, both assets form a similar swing low.
In the current quarter, one asset (e.g., EURUSD) breaks that low and trades below it.
The other asset (e.g., GBPUSD) fails to reach the same low, preserving the structure.
This time-based divergence reflects declining selling pressure, potential absorption, and often marks the end of a manipulation phase and the start of accumulation. If confirmed by a bullish PSP candle, it offers a strong long opportunity, with stop-losses defined just below the swing low.
🟣 Bearish Sequential SMT
In the previous quarter, both assets form a similar swing high.
In the current quarter, one asset (e.g., NQ) breaks above that high.
The other asset (e.g., ES) fails to reach that high, remaining below it.
This type of divergence signals weakening bullish momentum and the likelihood of distribution or a fake-out before a price drop. When followed by a bearish PSP candle, it sets up a strong shorting opportunity with targets in the discount zone and protective stops placed above the swing high.
🔵 Settings
⚙️ Logical Settings
Quarterly Cycles Type : Select the time segmentation method for SMT analysis.
Available modes include: Yearly, Monthly, Weekly, Daily, 90 Minute, and Micro.
These define how the indicator divides market time into Q1–Q4 cycles.
Symbol : Choose the secondary asset to compare with the main chart asset (e.g., XAUUSD, US100, GBPUSD).
Pivot Period : Sets the sensitivity of the pivot detection algorithm. A smaller value increases responsiveness to price swings.
Activate Max Pivot Back : When enabled, limits the maximum number of past pivots to be considered for divergence detection.
Max Pivot Back Length : Defines how many past pivots can be used (if the above toggle is active).
Pivot Sync Threshold : The maximum allowed difference (in bars) between pivots of the two assets for them to be compared.
Validity Pivot Length : Defines the time window (in bars) during which a divergence remains valid before it's considered outdated.
🎨 Display Settings
Show Cycle :Toggles the visual display of the current Quarter (Q1 to Q4) based on the selected time segmentation
Show Cycle Label : Shows the name (e.g., "Q2") of each detected Quarter on the chart.
Show Bullish SMT Line : Draws a line connecting the bullish divergence points.
Show Bullish SMT Label : Displays a label on the chart when a bullish divergence is detected.
Bullish Color : Sets the color for bullish SMT markers (label, shape, and line).
Show Bearish SMT Line : Draws a line for bearish divergence.
Show Bearish SMT Label : Displays a label when a bearish SMT divergence is found.
Bearish Color : Sets the color for bearish SMT visual elements.
🔔 Alert Settings
Alert Name : Custom name for the alert messages (used in TradingView’s alert system).
Message Frequency :
All: Every signal triggers an alert.
Once Per Bar: Alerts once per bar regardless of how many signals occur.
Per Bar Close: Only triggers when the bar closes and the signal still exists.
Time Zone Display : Choose the time zone in which alert timestamps are displayed (e.g., UTC).
Bullish SMT Divergence Alert : Enable/disable alerts specifically for bullish signals.
Bearish SMT Divergence Alert : Enable/disable alerts specifically for bearish signals
🔵 Conclusion
The Sequential SMT (SSMT) indicator is a powerful and precise tool for identifying structural divergences between correlated assets within a time-based framework. Unlike traditional divergence models that rely solely on sequential pivot comparisons, SSMT leverages Quarterly Theory, in combination with concepts like liquidity sweeps, market structure breaks (MSB) and precision swing points (PSP), to provide a deeper and more actionable view of market dynamics.
By using SSMT, traders gain not only the ability to identify where divergence occurs, but also when it matters most within the market cycle. This empowers them to anticipate major moves or traps before they fully materialize, and position themselves accordingly in high-probability trade zones.
Whether you're trading Forex, crypto, indices, or commodities, the true strength of this indicator is revealed when used in sync with the Accumulation, Manipulation, Distribution, and Reversal phases of the market. Integrated with other confluence tools and market models, SSMT can serve as a core component in a professional, rule-based, and highly personalized trading strategy.

SMT Divergence ICT 02 [TradingFinder] Smart Money Technique SMC🔵 Introduction
SMT Divergence (Smart Money Technique Divergence) is a price action-based trading concept that detects discrepancies in market behavior between two assets that are generally expected to move in the same direction. Rooted in ICT (Inner Circle Trader) methodology, this approach helps traders recognize subtle signs of market manipulation or imbalance, often ahead of traditional indicators.
The core idea behind SMT divergence is simple: when two correlated instruments—such as currency pairs, indices, or assets from the same sector—start forming different swing points (highs or lows), this can reveal a lack of confirmation in the trend. Such divergence is often a precursor to a price reversal or pause in momentum.
This technique works effectively across various markets including Forex, stocks, and cryptocurrencies. It’s particularly valuable when used alongside concepts like liquidity sweeps, market structure breaks (MSBs), or order block identification.
In advanced use cases, Sequential SMT helps uncover patterns of alternating divergences across sessions, often signaling engineered liquidity traps before price reacts.
When combined with the Quarterly Theory—which segments market behavior into Accumulation, Manipulation, Distribution, and Continuation/Reversal phases—traders gain insight not only into where divergence happens, but when it's most likely to be significant within the market cycle.
Bullish SMT :
Bullish SMT Divergence occurs when one asset prints a higher low while the correlated asset forms a lower low. This asymmetry often suggests that the downside move is losing strength, hinting at a potential bullish shift.
Bearish SMT :
Bearish SMT Divergence is formed when one asset creates a higher high, while the second asset fails to confirm by printing a lower high. This typically signals weakening bullish pressure and the possibility of a reversal to the downside.
🔵 How to Use
The SMT Divergence indicator is designed to detect imbalances between two positively correlated assets—such as major currency pairs, indices, or commodities. These divergences often indicate early signs of market inefficiency or smart money manipulation and can help traders anticipate trend shifts with higher precision.
Unlike traditional divergence indicators or earlier versions of this script, this upgraded version does not rely solely on consecutive pivot comparisons. Instead, it dynamically scans all available pivots within the chart to identify divergences at any structural level—major or minor—across the price action. This broader detection method increases the reliability and frequency of meaningful SMT signals.
Moreover, when integrated with Sequential SMT logic, the indicator is capable of identifying multiple divergence sequences across sessions. These sequences often signal engineered liquidity traps and can be mapped within the Quarterly Theory framework, allowing traders to pinpoint not just the presence of divergence but also the phase of the market cycle it appears in (Accumulation, Manipulation, Distribution, or Continuation).
🟣 Bullish SMT Divergence
This signal occurs when the primary asset forms a higher low, while the correlated asset forms a lower low. This pattern implies weakening bearish momentum and a potential shift to the upside.
If the correlated asset breaks its previous low but the primary asset does not, this divergence suggests absorption of selling pressure and possible accumulation by smart money—making it a strong bullish signal, especially when aligned with a favorable market phase (e.g., the end of a manipulation phase in Q2).
🟣 Bearish SMT Divergence
This signal occurs when the primary asset creates a higher high, while the correlated asset forms a lower high. This mismatch indicates fading bullish momentum and a potential reversal to the downside.
If the correlated asset fails to confirm a breakout made by the main asset, the divergence may point to distribution or exhaustion. When seen within Q3 or Q4 phases of the Quarterly Theory, this pattern often precedes sharp declines or fake-outs engineered by smart money
🔵 Settings
⚙️ Logical Settings
Symbol : Choose the secondary asset to compare with the main chart asset (e.g., XAUUSD, US100, GBPUSD).
Pivot Period : Sets the sensitivity of the pivot detection algorithm. A smaller value increases responsiveness to price swings.
Activate Max Pivot Back : When enabled, limits the maximum number of past pivots to be considered for divergence detection.
Max Pivot Back Length : Defines how many past pivots can be used (if the above toggle is active).
Pivot Sync Threshold : The maximum allowed difference (in bars) between pivots of the two assets for them to be compared.
Validity Pivot Length : Defines the time window (in bars) during which a divergence remains valid before it's considered outdated.
🎨 Display Settings
Show Bullish SMT Line : Draws a line connecting the bullish divergence points.
Show Bullish SMT Label : Displays a label on the chart when a bullish divergence is detected.
Bullish Color : Sets the color for bullish SMT markers (label, shape, and line).
Show Bearish SMT Line : Draws a line for bearish divergence.
Show Bearish SMT Label : Displays a label when a bearish SMT divergence is found.
Bearish Color : Sets the color for bearish SMT visual elements.
🔔 Alert Settings
Alert Name : Custom name for the alert messages (used in TradingView’s alert system).
Message Frequency :
All : Every signal triggers an alert.
Once Per Bar : Alerts once per bar regardless of how many signals occur.
Per Bar Close : Only triggers when the bar closes and the signal still exists.
Time Zone Display : Choose the time zone in which alert timestamps are displayed (e.g., UTC).
Bullish SMT Divergence Alert : Enable/disable alerts specifically for bullish signals.
Bearish SMT Divergence Alert : Enable/disable alerts specifically for bearish signals
🔵Conclusion
The SMT Plus indicator offers a refined and powerful approach to detecting smart money behavior through divergence analysis between correlated assets. By removing the limitations of consecutive pivot comparisons and allowing for broader structural detection, it captures more accurate and timely signals that often precede major market moves.
When paired with frameworks like Sequential SMT and the Quarterly Theory, the indicator not only highlights where divergence occurs, but also when in the market cycle it's most likely to matter. Its flexible settings, customizable visuals, and integrated alert system make it suitable for intraday scalpers, swing traders, and even long-term macro analysts.
Whether you're using it as a standalone decision-making tool or combining it with other ICT concepts, SMT Plus gives you an edge in recognizing manipulation, timing reversals, and staying in sync with the real market narrative—not just the chart.

ICT SMT (fadi)The ICT SMT (fadi) Indicator is a powerful indicator inspired by the Inner Circle Trader (ICT) methodology, designed to identify Smart Money Technique (SMT) divergences between correlated assets. This indicator helps traders spot potential reversal points or trend shifts by comparing price action of a user-defined symbol (e.g., “ES1!” for E-mini S&P 500 futures) against the current chart’s price structure. Ideal for forex, indices, futures, and crypto markets, it highlights discrepancies in correlated asset behavior to enhance trading decisions.
These discrepancies occur when one asset shows signs of strength—such as holding support or rallying—while the other weakens or drops, signaling potential manipulation or a shift in smart money activity. This is relevant because it reveals where institutional traders may be accumulating or distributing positions, giving insight into impending trend changes. This indicator offers higher accuracy and detects nearly every SMT present on the chart by calculating multiple possibilities.
Features
• Smart Algorithmic detection of high probability SMTs
• Detect SMT with two other symbols
• Detect 2-Candle SMT as an additional configurable option
• Confirmation and Invalidation levels
• Expand or narrow the detection range by changing the number of pivots to use
• Raise alerts when SMT has been detected
Usage
1. Apply the indicator to your chart.
2. In the settings, input a correlated symbol (e.g., “NQ1!” for Nasdaq futures if charting “ES1!”, or “EURUSD” if analyzing “GBPUSD”).
3. Monitor the plotted markers and labels:
• Green markers for bullish divergences.
• Red markers for bearish divergences.
4. Combine with other ICT concepts (e.g., order blocks, liquidity zones) for higher-probability setups.
Best Practices
• Pair with strongly correlated assets (e.g., ES vs. NQ, EURUSD vs. GBPUSD) for reliable signals.
• Backtest on your chosen market to confirm effectiveness.

[TehThomas] - ICT SMT DivergencesIntroduction
SMT Divergences is a cutting-edge trading tool designed for traders who utilize Smart Money Techniques (SMT), a core concept in the Inner Circle Trader (ICT) methodology. This indicator is specifically built to detect SMT divergences by comparing price action across multiple correlated assets. It helps traders identify institutional activity, liquidity grabs, and inefficiencies in the market, offering valuable insights for high-probability trade setups.
Smart Money Techniques revolve around the idea that institutional traders and large market participants leave behind footprints in the form of price divergences. By analyzing multiple asset pairs simultaneously, this indicator helps traders pinpoint areas where one market structure contradicts another, revealing potential trade opportunities before the majority of retail traders notice them.
What is SMT Divergence?
Smart Money Divergence (SMT) occurs when correlated assets or markets behave differently in key areas of interest. These divergences often indicate market inefficiencies caused by liquidity grabs or institutional order flow. There are two main types of SMT divergences:
1. Bearish SMT Divergence (Smart Money Distribution) 🔴
Occurs when:
One asset makes a higher high, while another correlated asset makes a lower high.
This signals underlying weakness in the price action of the first asset.
Institutions may be offloading positions, preparing for a downward move.
📉 Example: If GBP/USD makes a higher high, but EUR/USD makes a lower high, it indicates potential weakness in GBP/USD and a possible short opportunity.
2. Bullish SMT Divergence (Smart Money Accumulation) 🔵
Occurs when:
One asset makes a lower low, while another correlated asset makes a higher low.
This suggests strength and potential accumulation by institutional traders.
Smart Money may be positioning for a bullish reversal.
📈 Example: If NASDAQ (US100) makes a lower low, but S&P 500 (US500) makes a higher low, it could indicate bullish strength in the stock market, suggesting a possible long trade.
How This Indicator Works
The SMT Divergences automatically identifies and plots SMT divergences on your chart, allowing you to spot hidden market imbalances at a glance.
🔍 Key Features
✅ Compare Up to 4 Assets Simultaneously – Select up to four correlated pairs to compare against the main charted asset.
✅ Automatic Detection of SMT Divergences – The script finds divergences in swing highs and swing lows and visually marks them on the chart.
✅ Customizable Line Styles & Colors – Adjust the appearance of the divergence lines and labels to suit your trading style.
✅ Smart Labeling System – Displays which asset pairs are diverging, making it easy to analyze market conditions.
✅ Works Across Multiple Markets – Use for Forex, Indices, Crypto, and Commodities, giving traders flexibility in different asset classes.
✅ Designed for ICT Traders – Aligns perfectly with other ICT concepts such as Liquidity Zones, Order Blocks, and Fair Value Gaps (FVGs).
🛠 Indicator Settings & Customization
The indicator provides various settings to tailor it to your trading preferences:
Pivot Lookback Length: Adjusts how many bars the indicator looks back to determine swing highs/lows.
Symbol Selection: Choose up to four additional assets to compare against your main trading pair.
Divergence Line Colors: Customize the color of bearish (red) and bullish (blue) divergences for better visibility.
Line Styles: Choose between solid, dotted, or dashed lines to highlight divergences in your preferred way.
Label Customization: Modify text color and display preferences for a clean and informative chart layout.
How to Use This Indicator in Your Trading Strategy
This indicator is best used in combination with other ICT concepts to improve confluence and increase trade accuracy. Here’s how you can integrate it into your trading strategy:
🔹 Step 1: Identify SMT Divergences
Wait for bullish or bearish SMT divergences to appear on your chart.
Check if the divergence aligns with key liquidity zones, fair value gaps (FVGs), or order blocks.
🔹 Step 2: Confirm Institutional Activity
Look for liquidity sweeps (stop hunts) before a potential reversal.
If a bearish SMT divergence forms near a major resistance level, it may signal Smart Money selling.
If a bullish SMT divergence forms near a support zone, it could indicate accumulation.
🔹 Step 3: Enter a Trade with Confluence
Combine SMT divergences with market structure shifts to time entries.
Use additional ICT tools like Premium & Discount Arrays, Volume Profile, and Market Maker Models for confirmation.
Set stop-losses above liquidity zones and aim for high-risk reward ratios.
🔹 Step 4: Manage Risk & Take Profits
Always use proper risk management, keeping an eye on liquidity grabs and market sentiment.
Consider taking partial profits at key structural points and letting the rest of the trade run.
Why This Indicator is a Game-Changer for ICT Traders
Traditional retail traders often fail to spot Smart Money footprints, which is why many struggle with false breakouts and liquidity traps. The - ICT SMT Divergences indicator eliminates this problem by providing a clear, visual representation of SMT divergences, allowing traders to track institutional movements in real-time.
🔹 Save Time – No need to manually compare charts; the script does the work for you.
🔹 Improve Accuracy – Get high-probability trade setups by following institutional footprints.
🔹 Enhance Your Trading Edge – Use SMT divergences in combination with liquidity grabs, order blocks, and fair value gaps to refine your strategy.
🔹 Universal Market Compatibility – Works for Forex, Indices, Crypto, Commodities, and even Stocks, giving you flexibility in different markets.
Final Thoughts
The SMT Divergences is a must-have tool for traders who rely on Smart Money Techniques (SMT) and ICT methodologies. By identifying SMT divergences across multiple correlated markets, this indicator provides unparalleled insights into institutional trading behavior and enhances your ability to trade with Smart Money.
Whether you are a day trader, swing trader, or position trader, this indicator will help you make more informed decisions, avoid liquidity traps, and improve your overall profitability.
__________________________________________
Thanks for your support!
If you found this idea helpful or learned something new, drop a like 👍 and leave a comment, I’d love to hear your thoughts! 🚀
Make sure to follow me for more price action insights, free indicators, and trading strategies. Let’s grow and trade smarter together! 📈
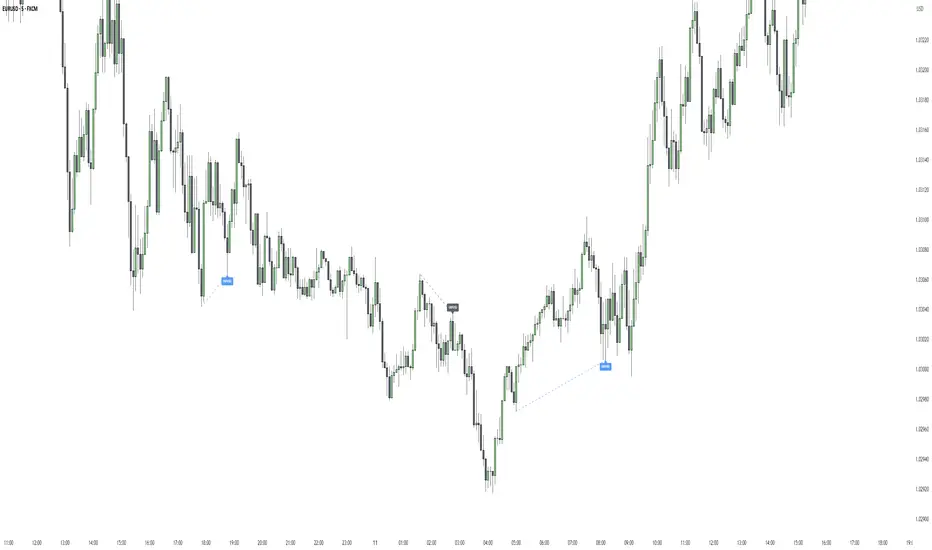
Hidden SMT Divergence ICT 01 [TradingFinder] HSMT SMC Technique🔵 Introduction
Hidden SMT Divergence, an advanced concept within the Smart Money Technique (SMT), identifies discrepancies between correlated assets by focusing on their closing prices.
Unlike the standard SMT Divergence, which uses high and low prices for analysis, Hidden SMT Divergence uncovers subtle signals by examining divergences based on the assets' closing values.
These divergences often highlight potential reversals or trend continuations, making this technique a valuable tool for traders aiming to anticipate market movements.
This approach applies across various markets and asset classes, including :
Commodities : CAPITALCOM:GOLD vs. CAPITALCOM:SILVER or BLACKBULL:BRENT vs. BLACKBULL:WTI .
Indices : NASDAQ:NDX vs. TVC:SPX vs. FX:US30 .
FOREX : FX:EURUSD vs. OANDA:GBPUSD vs. TVC:DXY (US Dollar Index).
Cryptocurrencies : BITSTAMP:BTCUSD vs. COINBASE:ETHUSD vs. KUCOIN:SOLUSDT vs. CRYPTOCAP:TOTAL3 .
Volatility Measures : FOREXCOM:XAUUSD vs. TVC:VIX (Volatility Index).
By identifying divergences within these asset groups, traders can gain actionable insights into potential market reversals or shifts in trend direction. Hidden SMT Divergence is particularly effective for pinpointing subtle market signals that traditional methods may overlook.
Bullish Hidden SMT Divergence : This divergence emerges when one asset forms a higher low, while the correlated asset creates a lower low in terms of their closing prices. It often signals weakening downward momentum and a potential reversal to the upside.
Bearish Hidden SMT Divergence : This occurs when one asset establishes a higher high, while the correlated asset forms a lower high based on their closing prices. It typically reflects declining upward momentum and a probable shift to the downside.
🔵 How to Use
The Hidden SMT Divergence indicator provides traders with a systematic approach to identify market reversals or trend continuations through divergences in closing prices between two correlated assets.
🟣 Bullish Hidden SMT Divergence
Bullish Hidden SMT Divergence occurs when the closing price of the primary asset forms a higher low, while the correlated asset creates a lower low. This pattern indicates weakening downward momentum and signals a potential reversal to the upside.
After identifying the divergence, confirm it using additional tools like support levels, volume trends, or indicators such as RSI and MACD. Enter a buy position as the price shows signs of reversal near support zones, ensuring proper risk management by placing a stop-loss below the support level.
Bearish Hidden SMT Divergence
Bearish Hidden SMT Divergence is identified when the closing price of the primary asset forms a higher high, while the correlated asset creates a lower high. This divergence suggests a weakening uptrend and a likely reversal to the downside.
Validate the signal by examining resistance levels, declining volume, or complementary indicators. Consider entering a sell position as the price starts declining from resistance levels, and set a stop-loss above the resistance zone to limit potential losses.
🔵 Setting
Second Symbol : Select the secondary asset to compare with the primary asset. By default, "XAUUSD" (Gold) is used, but it can be customized to any stock, cryptocurrency, or currency pair.
Divergence Fractal Periods : Defines the number of past candles considered for identifying divergences. The default value is 2, but traders can adjust it for greater precision.
Bullish Divergence Line : Displays a dashed line connecting the points of bullish divergence.
Bearish Divergence Line : Shows a similar line for bearish divergence points.
Bullish Divergence Label : Marks areas of bullish divergence with a "+SMT" label.
Bearish Divergence Label : Highlights bearish divergences with a "-SMT" label.
Chart Type : Choose between Line or Candle charts for enhanced visualization.
🔵 Conclusion
Hidden SMT Divergence offers traders a refined method for identifying market reversals by analyzing closing price discrepancies between correlated assets. Its ability to uncover subtle divergences makes it an essential tool for traders who aim to stay ahead of market trends.
By integrating this technique with other technical analysis tools and sound risk management, traders can enhance their decision-making process and capitalize on market opportunities with greater confidence.
Hidden SMT Divergence’s focus on closing prices ensures more precise signals, helping traders refine their strategies across various markets, including Forex, commodities, indices, and cryptocurrencies.
Its open-source nature allows for customization and verification, providing transparency and flexibility to suit diverse trading needs. Hidden SMT Divergence stands as a powerful addition to the arsenal of any trader seeking to unlock hidden opportunities in dynamic financial markets.
