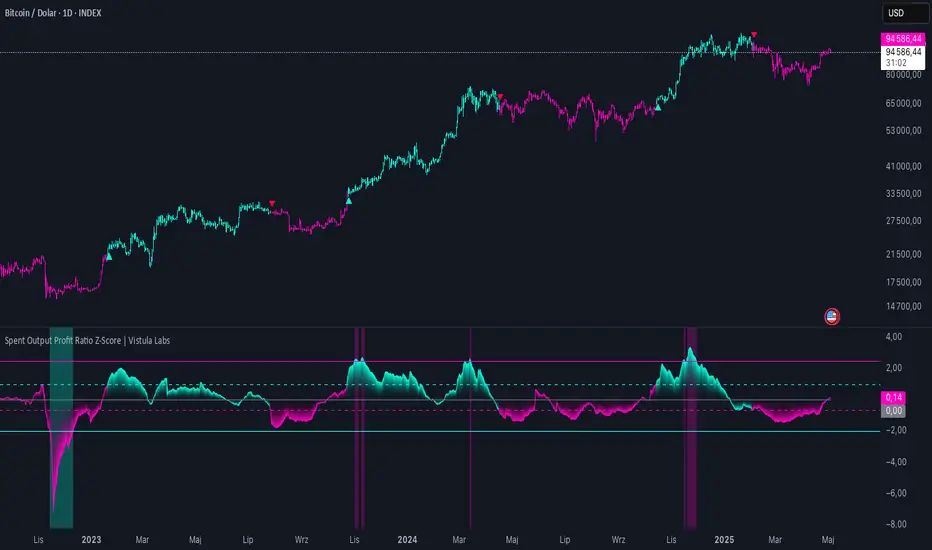
Spent Output Profit Ratio Z-Score | Vistula LabsOverview
The Spent Output Profit Ratio (SOPR) Z-Score indicator is a sophisticated tool designed by Vistula Labs to help cryptocurrency traders analyze market sentiment and identify potential trend reversals. It leverages on-chain data from Glassnode to calculate the Spent Output Profit Ratio (SOPR) for Bitcoin and Ethereum, transforming this metric into a Z-Score for easy interpretation.
What is SOPR?
Spent Output Profit Ratio (SOPR) measures the profit ratio of spent outputs (transactions) on the blockchain:
SOPR > 1: Indicates that, on average, coins are being sold at a profit.
SOPR < 1: Suggests that coins are being sold at a loss.
SOPR = 1: Break-even point, often seen as a key psychological level.
SOPR provides insights into holder behavior—whether they are locking in profits or cutting losses—making it a valuable gauge of market sentiment.
How It Works
The indicator applies a Z-Score to the SOPR data to normalize it relative to its historical behavior:
Z-Score = (Smoothed SOPR - Moving Average of Smoothed SOPR) / Standard Deviation of Smoothed SOPR
Smoothed SOPR: A moving average (e.g., WMA) of SOPR over a short period (default: 30 bars) to reduce noise.
Moving Average of Smoothed SOPR: A longer moving average (default: 180 bars) of the smoothed SOPR.
Standard Deviation: Calculated over a lookback period (default: 200 bars).
This Z-Score highlights how extreme the current SOPR is compared to its historical norm, helping traders spot significant deviations.
Key Features
Data Source:
Selectable between BTC and ETH, using daily SOPR data from Glassnode.
Customization:
Moving Average Types: Choose from SMA, EMA, DEMA, RMA, WMA, or VWMA for both smoothing and main averages.
Lengths: Adjust the smoothing period (default: 30) and main moving average length (default: 180).
Z-Score Lookback: Default is 200 bars.
Thresholds: Set levels for long/short signals and overbought/oversold conditions.
Signals:
Long Signal: Triggered when Z-Score crosses above 1.02, suggesting potential upward momentum.
Short Signal: Triggered when Z-Score crosses below -0.66, indicating potential downward momentum.
Overbought/Oversold Conditions:
Overbought: Z-Score > 2.5, signaling potential overvaluation.
Oversold: Z-Score < -2.0, indicating potential undervaluation.
Visualizations:
Z-Score Plot: Teal for long signals, magenta for short signals.
Threshold Lines: Dashed for long/short, solid for overbought/oversold.
Candlestick Coloring: Matches signal colors.
Arrows: Green up-triangles for long entries, red down-triangles for short entries.
Background Colors: Magenta for overbought, teal for oversold.
Alerts:
Conditions for Long Opportunity, Short Opportunity, Overbought, and Oversold.
Usage Guide
Select Cryptocurrency: Choose BTC or ETH.
Adjust Moving Averages: Customize types and lengths for smoothing and main averages.
Set Thresholds: Define Z-Score levels for signals and extreme conditions.
Monitor Signals: Use color changes, arrows, and background highlights to identify opportunities.
Enable Alerts: Stay informed without constant chart watching.
Interpretation
High Z-Score (>1.02): SOPR is significantly above its historical mean, potentially indicating overvaluation or strong bullish momentum.
Low Z-Score (<-0.66): SOPR is below its mean, suggesting undervaluation or bearish momentum.
Extreme Conditions: Z-Scores above 2.5 or below -2.0 highlight overbought or oversold markets, often preceding reversals.
Conclusion
The SOPR Z-Score indicator combines on-chain data with statistical analysis to provide traders with a clear, actionable view of market sentiment. Its customizable settings, visual clarity, and alert system make it an essential tool for both novice and experienced traders seeking an edge in the cryptocurrency markets.
Sopr
Spent Output Profit Ratio (SOPR) Z-Score | [DeV]SOPR Z-Score
The Spent Output Profit Ratio (SOPR) is an advanced on-chain metric designed to provide deep insights into Bitcoin market dynamics by measuring the ratio between the combined USD value of all Bitcoin outputs spent on a given day and their combined USD value at the time of creation (typically, their purchase price). As a member of the Realized Profit/Loss family of metrics, SOPR offers a window into aggregate seller behavior, effectively representing the USD amount received by sellers divided by the USD amount they originally paid. This indicator enhances this metric by normalizing it into a Z-Score, enabling a statistically robust analysis of market sentiment relative to historical trends, augmented by a suite of customizable features for precision and visualization.
SOPR Settings -
Lookback Length (Default: 150 days): Determines the historical window for calculating the Z-Score’s mean and standard deviation. A longer lookback captures broader market cycles, providing a stable baseline for identifying extreme deviations, which is particularly valuable for long-term strategic analysis.
Smoothing Period (Default: 100 days): Applies an EMA to the raw SOPR, balancing responsiveness to recent changes with noise reduction. This extended smoothing period ensures the indicator focuses on sustained shifts in seller behavior, ideal for institutional-grade trend analysis.
Moving Average Settings -
MA Lookback Length (Default: 90 days): Sets the period for the Z-Score’s moving average, offering a shorter-term trend signal relative to the 150-day Z-Score lookback. This contrast enhances the ability to detect momentum shifts within the broader context.
MA Type (Default: EMA): Provides six moving average types, from the simple SMA to the volume-weighted VWMA. The default EMA strikes an optimal balance between smoothness and responsiveness, while alternatives like HMA (Hull) or VWMA (volume-weighted) allow for specialized applications, such as emphasizing recent price action or incorporating volume dynamics.
Display Settings -
Show Moving Average (Default: True): Toggles the visibility of the Z-Score MA plot, enabling users to focus solely on the raw Z-Score when preferred.
Show Background Colors (Default: True): Activates dynamic background shading, enhancing visual interpretation of market regimes.
Background Color Source (Default: SOPR): Allows users to tie the background color to either the SOPR Z-Score’s midline (reflecting adjustedZScore > 0) or the MA’s trend direction (zScoreMA > zScoreMA ). This dual-source option provides flexibility to align the visual context with the primary analytical focus.
Analytical Applications -
Bear Market Resistance: When the Z-Score approaches or exceeds zero (raw SOPR near 1), it often signals resistance as sellers rush to exit at break-even, a pattern historically observed during downtrends. A rising Z-Score MA crossing zero can confirm this pressure.
Bull Market Support: Conversely, a Z-Score dropping below zero in uptrends indicates reluctance to sell at a loss, forming support as sell pressure diminishes. The MA’s bullish coloring reinforces confirmation of renewed buying interest.
Extreme Deviations: Values significantly above or below zero highlight overbought or oversold conditions, respectively, offering opportunities for contrarian positioning when paired with other on-chain or price-based metrics.

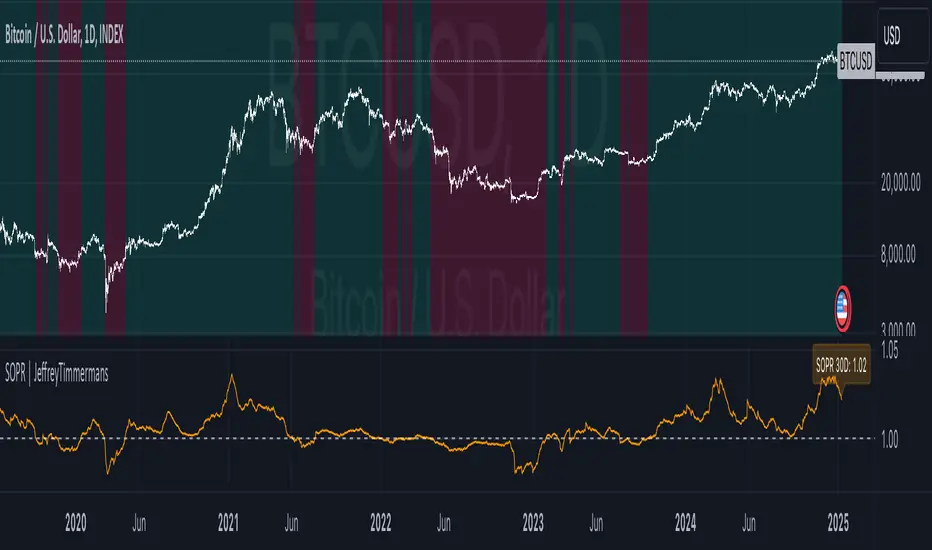
Spent Output Profit Ratio | JeffreyTimmermansSOPR
The "Spent Output Profit Ratio" , aka SOPR indicator is a valuable tool designed to analyze the profitability of spent Bitcoin outputs. SOPR is derived by dividing the selling price of Bitcoin by its purchase price, offering insights into market participants' profit-taking or loss-cutting behavior.
This script features two selectable SOPR metrics:
SOPR 30D: A 30-day Exponential Moving Average (EMA) for short-term trend analysis.
SOPR 365D: A 365-day EMA for assessing long-term profitability trends.
How It Works
Key Levels: The horizontal reference line at 1.0 acts as a critical threshold:
Above 1.0: Market participants are generally in profit, indicating bullish sentiment.
Below 1.0: Market participants are selling at a loss, often signaling bearish sentiment.
Background Colors
Green: Indicates bullish conditions when the selected SOPR value is above 1.
Red: Highlights bearish conditions when the value is below 1.
Dynamic Selection
Easily switch between SOPR 30D and SOPR 365D in the settings for tailored analysis.
Features
Customizable SOPR Selection: Toggle between 30-day and 365-day SOPR views based on your trading preferences.
Dynamic Label: A floating label displays the current SOPR value in real-time, along with the selected SOPR metric for easy monitoring.
Background Highlights: Visual cues for bullish and bearish conditions simplify chart interpretation.
Real-Time Alerts
Bullish Alerts: Triggered when the selected SOPR crosses above 1.
Bearish Alerts: Triggered when the selected SOPR crosses below 1.
Clean Visualization
The indicator includes a horizontal reference line and clear color schemes for easy trend identification.
The SOPR Indicator is an essential tool for traders and analysts seeking to understand Bitcoin market sentiment and profitability trends. Whether used for short-term trades or long-term market analysis, this script provides actionable insights to refine your decision-making process.
-Jeffrey
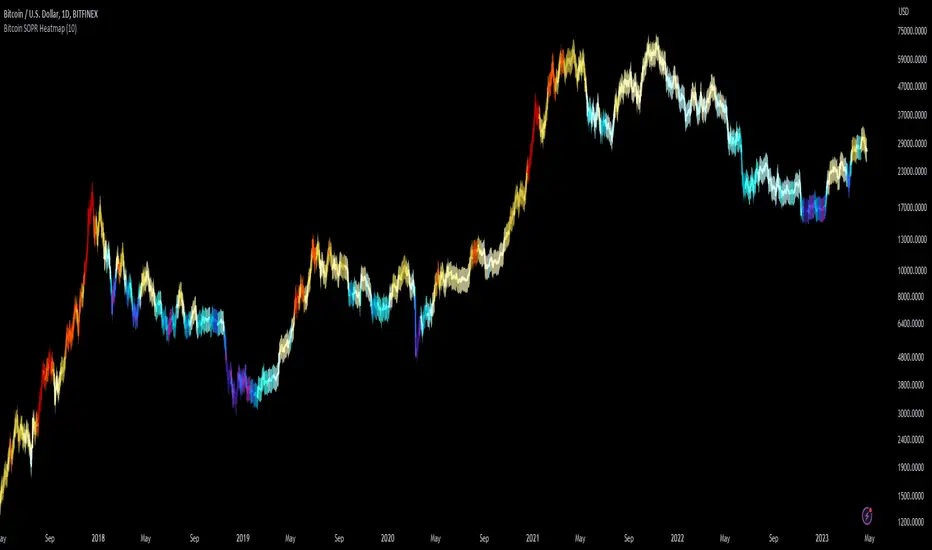
Bitcoin SOPR HeatmapSOPR (spent output profit ratio) is a metric, provided by Glassnode to measure if most BTC are moved in profit or in loss. The higher SOPR is, the more profits are realized (theoretically) and vice versa.
This indicator shows SOPR visually as a heatmap directly on the Bitcoin chart.
Cold temperatures (blue, purple) show bear markets. Bear market peaks should be visible in dark purple.
Hot temperatues (yellow, red) show bull markets. Hype phases should be visible in red.
I recommend to hide chart when using the indicator. Otherwise you can also enlarge the heatmap in the settings.
The indicator works best on BTCUSD standard charts on daily timeframe. Otherwise you will see an error message.
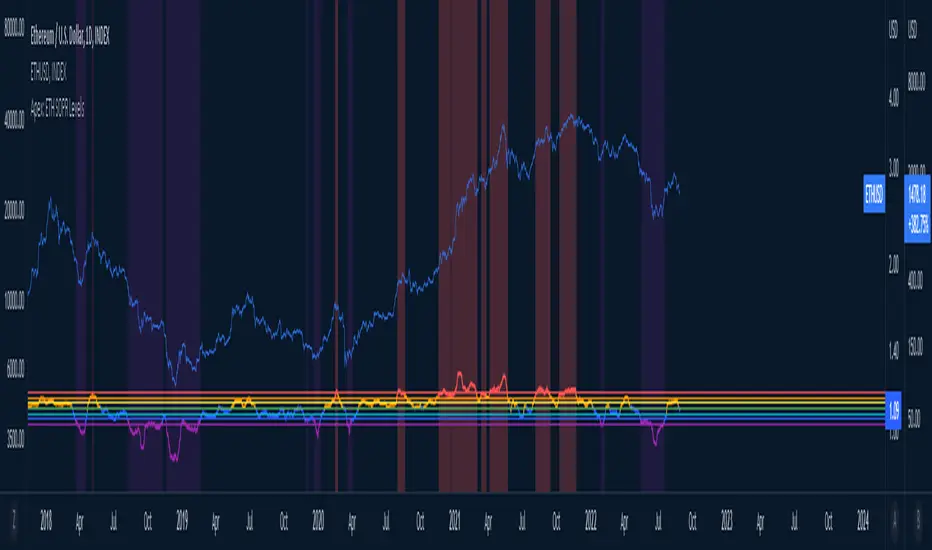
Apex ETH SOPR LevelsThe SOPR (Spent Output Profit Ratio) indicator provides insight into macro market sentiment, profitability, and losses taken over a specific time frame.
It reflects the degree of realized profit for all coins moved on-chain.
This indicator SOPR is for Ethereum only
Personal settings:
Control for the SOPR average for the long or short term (Minimum number is 7)
Control for colors of the SOPR average
Red = High: Greed
Purple = Low: Extreme fear
SOPR SignalThe script uses Glassnode's SOPR on-chain data to identify:
1. Sentiment Trends:
- Green circle on bottom (Bullish) -> Investors are selling in profits
- Red circle on top (Bearish) -> Investors are selling in losses
2. Short-term Entries:
- Small green circle on SOPR (Bullish) -> Approaching investor purchase price in bull run -> not willing to sell -> decrease supply
- Small red circle on SOPR (Bearish) -> Approaching break even price in bear run -> chance to get out -> increase supply
3. Potential Trend Change:
- Yellow circle on top/bottom -> Potential trend changing soon

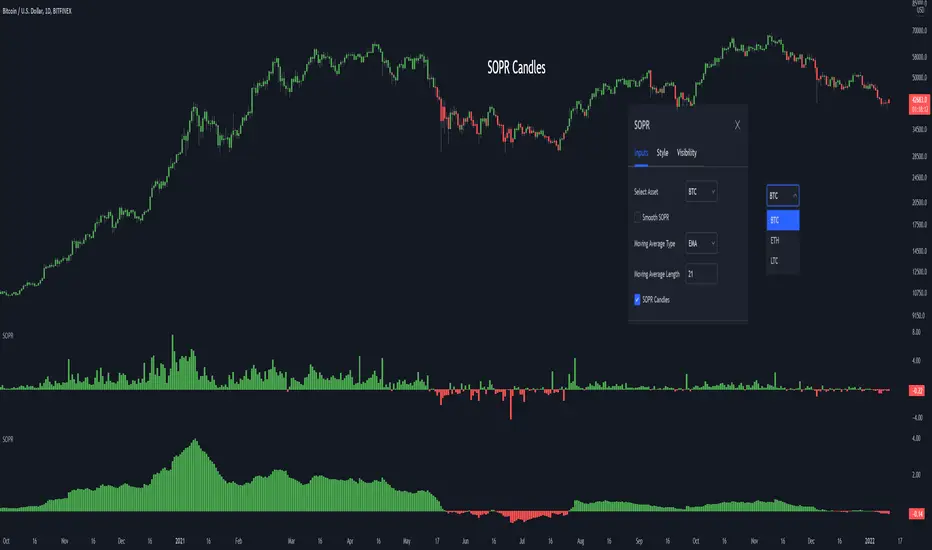
SOPR Candles OscillatorThe Spent Output Profit Ratio (SOPR) is computed by dividing the realized value (in USD) divided by the value at creation (USD) of a spent output. Or simply: price sold / price paid. This metric was created by Renato Shirakashi.
The indicator provides insight into macro market sentiment, profitability and losses taken over a particular time-frame. It reflects the degree of realized profit for all coins moved on-chain.
SOPR is measured by taking the ratio between the fiat value at the time of UTXO creation, and the fiat value when the UTXO is spent.
In this indicator, I have essentially created an index that measures SOPR value on any given day. This is visually displayed as an oscillator.
SOPR values greater than 0 implies that the coins moved that day are, on average, selling at a profit (price sold is greater than the price paid).
SOPR value less than 0 implies that the coins moved that day are, on average, selling at a loss (price sold is less than the price paid).
You have the ability to see the SOPR of BTC , ETH and LTC. You can also smooth the SOPR using an EMA or SMA of your choice. I have added colored bars to the chart to make it easier to visualize SOPR and it's relation to price action.
Thank you to both TradingView and Glassnode for adding all the on-chain data.

SOPR - Spent Output Profit RatioThe SOPR (Spent Output Profit Ratio) indicator provides insight into macro market sentiment, profitability and losses taken over a particular time-frame. It reflects the degree of realised profit for all coins moved on-chain.
SOPR is measured by considering only coins moved the timescale considered (daily, hourly etc), and taking the ratio between the fiat value at the time of UTXO creation, and the fiat value when the UTXO is spent.
SOPR values greater than 1 implies that the coins moved that day are, on average, selling at a profit (price sold is greater than the price paid).
SOPR value less than 1 implies that the coins moved that day are, on average, selling at a loss (price sold is less than the price paid).
You have the ability to see the SOPR of BTC, ETH and LTC. You can also smooth the SOPR using an EMA or SMA of your choice.
Thank you to both TradingView and Glassnode for adding all the on-chain data