Volume Spread Analysis [TANHEF]Volume Spread Analysis: Understanding Market Intentions through the Interpretation of Volume and Price Movements.
█ Simple Explanation:
The Volume Spread Analysis (VSA) indicator is a comprehensive tool that helps traders identify key market patterns and trends based on volume and spread data. This indicator highlights significant VSA patterns and provides insights into market behavior through color-coded volume/spread bars and identification of bars indicating strength, weakness, and neutrality between buyers and sellers. It also includes powerful volume and spread forecasting capabilities.
█ Laws of Volume Spread Analysis (VSA):
The origin of VSA begins with Richard Wyckoff, a pivotal figure in its development. Wyckoff made significant contributions to trading theory, including the formulation of three basic laws:
The Law of Supply and Demand: This fundamental law states that supply and demand balance each other over time. High demand and low supply lead to rising prices until demand falls to a level where supply can meet it. Conversely, low demand and high supply cause prices to fall until demand increases enough to absorb the excess supply.
The Law of Cause and Effect: This law assumes that a 'cause' will result in an 'effect' proportional to the 'cause'. A strong 'cause' will lead to a strong trend (effect), while a weak 'cause' will lead to a weak trend.
The Law of Effort vs. Result: This law asserts that the result should reflect the effort exerted. In trading terms, a large volume should result in a significant price move (spread). If the spread is small, the volume should also be small. Any deviation from this pattern is considered an anomaly.
█ Volume and Spread Analysis Bars:
Display: Volume and/or spread bars that consist of color coded levels. If both of these are displayed, the number of spread bars can be limited for visual appeal and understanding, with the spread bars scaled to match the volume bars. While automatic calculation of the number of visual bars for auto scaling is possible, it is avoided to prevent the indicator from reloading whenever the number of visual price bars on the chart is adjusted, ensuring uninterrupted analysis. A displayable table (Legend) of bar colors and levels can give context and clarify to each volume/spread bar.
Calculation: Levels are calculated using multipliers applied to moving averages to represent key levels based on historical data: low, normal, high, ultra. This method smooths out short-term fluctuations and focuses on longer-term trends.
Low Level: Indicates reduced volatility and market interest.
Normal Level: Reflects typical market activity and volatility.
High Level: Indicates increased activity and volatility.
Ultra Level: Identifies extreme levels of activity and volatility.
This illustrates the appearance of Volume and Spread bars when scaled and plotted together:
█ Forecasting Capabilities:
Display: Forecasted volume and spread levels using predictive models.
Calculation: Volume and Spread prediction calculations differ as volume is linear and spread is non-linear.
Volume Forecast (Linear Forecasting): Predicts future volume based on current volume rate and bar time till close.
Spread Forecast (Non-Linear Dynamic Forecasting): Predicts future spread using a dynamic multiplier, less near midpoint (consolidation) and more near low or high (trending), reflecting non-linear expansion.
Moving Averages: In forecasting, moving averages utilize forecasted levels instead of actual levels to ensure the correct level is forecasted (low, normal, high, or ultra).
The following compares forecasted volume with actual resulting volume, highlighting the power of early identifying increased volume through forecasted levels:
█ VSA Patterns:
Criteria and descriptions for each VSA pattern are available as tooltips beside them within the indicator’s settings. These tooltips provide explanations of potential developments based on the volume and spread data.
Signs of Strength (🟢): Patterns indicating strong buying pressure and potential market upturns.
Down Thrust
Selling Climax
No Effort → Bearish Result
Bearish Effort → No Result
Inverse Down Thrust
Failed Selling Climax
Bull Outside Reversal
End of Falling Market (Bag Holder)
Pseudo Down Thrust
No Supply
Signs of Weakness (🔴): Patterns indicating strong selling pressure and potential market downturns.
Up Thrust
Buying Climax
No Effort → Bullish Result
Bullish Effort → No Result
Inverse Up Thrust
Failed Buying Climax
Bear Outside Reversal
End of Rising Market (Bag Seller)
Pseudo Up Thrust
No Demand
Neutral Patterns (🔵): Patterns indicating market indecision and potential for continuation or reversal.
Quiet Doji
Balanced Doji
Strong Doji
Quiet Spinning Top
Balanced Spinning Top
Strong Spinning Top
Quiet High Wave
Balanced High Wave
Strong High Wave
Consolidation
Bar Patterns (🟡): Common candlestick patterns that offer insights into market sentiment. These are required in some VSA patterns and can also be displayed independently.
Bull Pin Bar
Bear Pin Bar
Doji
Spinning Top
High Wave
Consolidation
This demonstrates the acronym and descriptive options for displaying bar patterns, with the ability to hover over text to reveal the descriptive text along with what type of pattern:
█ Alerts:
VSA Pattern Alerts: Notifications for identified VSA patterns at bar close.
Volume and Spread Alerts: Alerts for confirmed and forecasted volume/spread levels (Low, High, Ultra).
Forecasted Volume and Spread Alerts: Alerts for forecasted volume/spread levels (High, Ultra) include a minimum percent time elapsed input to reduce false early signals by ensuring sufficient bar time has passed.
█ Inputs and Settings:
Display Volume and/or Spread: Choose between displaying volume bars, spread bars, or both with different lookback periods.
Indicator Bar Color: Select color schemes for bars (Normal, Detail, Levels).
Indicator Moving Average Color: Select schemes for bars (Fill, Lines, None).
Price Bar Colors: Options to color price bars based on VSA patterns and volume levels.
Legend: Display a table of bar colors and levels for context and clarity of volume/spread bars.
Forecast: Configure forecast display and prediction details for volume and spread.
Average Multipliers: Define multipliers for different levels (Low, High, Ultra) to refine the analysis.
Moving Average: Set volume and spread moving average settings.
VSA: Select the VSA patterns to be calculated and displayed (Strength, Weakness, Neutral).
Bar Patterns: Criteria for bar patterns used in VSA (Doji, Bull Pin Bar, Bear Pin Bar, Spinning Top, Consolidation, High Wave).
Colors: Set exact colors used for indicator bars, indicator moving averages, and price bars.
More Display Options: Specify how VSA pattern text is displayed (Acronym, Descriptive), positioning, and sizes.
Alerts: Configure alerts for VSA patterns, volume, and spread levels, including forecasted levels.
█ Usage:
The Volume Spread Analysis indicator is a helpful tool for leveraging volume spread analysis to make informed trading decisions. It offers comprehensive visual and textual cues on the chart, making it easier to identify market conditions, potential reversals, and continuations. Whether analyzing historical data or forecasting future trends, this indicator provides insights into the underlying factors driving market movements.
Spread

VolumeSpreadAnalysisLibrary "VolumeSpreadAnalysis"
A library for Volume Spread Analysis (VSA).
spread(_barIndex)
Calculates the spread of a bar.
Parameters:
_barIndex (int) : (int) The index of the bar.
Returns: (float) The spread of the bar.
volume(_barIndex)
Retrieves the volume of a bar.
Parameters:
_barIndex (int) : (int) The index of the bar.
Returns: (float) The volume of the bar.
body(_barIndex)
Calculates the body of a bar.
Parameters:
_barIndex (simple int) : (int) The index of the bar.
Returns: (float) The body size of the bar.
wickUpper(_barIndex)
Calculates the upper wick of a bar (upper shadow).
Parameters:
_barIndex (simple int) : (int) The index of the bar.
Returns: (float) The upper wick size of the bar.
wickLower(_barIndex)
Calculates the lower wick of a bar (lower shadow).
Parameters:
_barIndex (simple int) : (int) The index of the bar.
Returns: (float) The lower wick size of the bar.
calcForecastedSMA(_source, _length, _forecastedLevel)
Calculates the forecasted Simple Moving Average (SMA).
Parameters:
_source (float) : (series float) Source data for calculation.
_length (simple int) : (int) The length of the SMA.
_forecastedLevel (float) : (float) The forecasted level to include in the calculation.
Returns: (float) The forecasted SMA value.
calcForecastedEMA(_source, _length, _forecastedLevel)
Calculates the forecasted Exponential Moving Average (EMA).
Parameters:
_source (float) : (series float) Source data for calculation.
_length (simple int) : (int) The length of the EMA.
_forecastedLevel (float) : (float) The forecasted level to include in the calculation.
Returns: (float) The forecasted EMA value.
calcForecastedRMA(_source, _length, _forecastedLevel)
Calculates the forecasted Relative Moving Average (RMA).
Parameters:
_source (float) : (series float) Source data for calculation.
_length (simple int) : (int) The length of the RMA.
_forecastedLevel (float) : (float) The forecasted level to include in the calculation.
Returns: (float) The forecasted RMA value.
calcForecastedWMA(_source, _length, _forecastedLevel)
Calculates the forecasted Weighted Moving Average (WMA).
Parameters:
_source (float) : (series float) Source data for calculation.
_length (simple int) : (int) The length of the WMA.
_forecastedLevel (float) : (float) The forecasted level to include in the calculation.
Returns: (float) The forecasted WMA value.
calcElapsedTimePercent()
Calculates the elapsed time percent of the current bar.
Returns: (float) The elapsed time percent.
calcForecastedSpread(multiplierAtMidpoints, multiplierAtPeaks)
Calculates the forecasted spread using elapsed time and dynamic multipliers, handling spread's non-linear nature.
Parameters:
multiplierAtMidpoints (float) : (float) The multiplier value at midpoints.
multiplierAtPeaks (float) : (float) The multiplier value at peaks.
Returns: (float) The forecasted spread value.
calcForecastedVolume()
Calculates the forecasted volume using elapsed time, satisfying volume's linear nature.
Returns: (float) The forecasted volume value.
calcForecastedMA(_source, _length, _forecastedSource, _type)
Calculates the forecasted Moving Average (MA) based on the specified type.
Parameters:
_source (float) : (series float) Source data for calculation.
_length (simple int) : (int) The length of the MA.
_forecastedSource (float) : (float) The forecasted level to include in the calculation.
_type (simple string) : (string) The type of the MA ("SMA", "EMA", "SMMA (RMA)", "WMA").
Returns: (float) The forecasted MA value.
calcMA(_source, _length, _type)
Calculates the Moving Average (MA) based on the specified type.
Parameters:
_source (float) : (series float) Source data for calculation.
_length (simple int) : (int) The length of the MA.
_type (simple string) : (string) The type of the MA ("SMA", "EMA", "SMMA (RMA)", "WMA").
Returns: (float) The MA value.
bullBar(_barIndex)
Determines if the bar is bullish.
Parameters:
_barIndex (simple int) : (int) The index of the bar.
Returns: (bool) True if the bar is bullish, otherwise false.
bearBar(_barIndex)
Determines if the bar is bearish.
Parameters:
_barIndex (simple int) : (int) The index of the bar.
Returns: (bool) True if the bar is bearish, otherwise false.
breakout(_barIndex)
Determines if there is a breakout above the previous bar.
Parameters:
_barIndex (simple int) : (int) The index of the bar.
Returns: (bool) True if there is a breakout, otherwise false.
breakdown(_barIndex)
Determines if there is a breakdown below the previous bar.
Parameters:
_barIndex (simple int) : (int) The index of the bar.
Returns: (bool) True if there is a breakdown, otherwise false.
rejectionWickUpper(_rejectionWick)
Determines if the upper wick is a rejection wick.
Parameters:
_rejectionWick (simple float) : (float) The rejection wick percentage.
Returns: (bool) True if the upper wick is a rejection wick, otherwise false.
rejectionWickLower(_rejectionWick)
Determines if the lower wick is a rejection wick.
Parameters:
_rejectionWick (simple float) : (float) The rejection wick percentage.
Returns: (bool) True if the lower wick is a rejection wick, otherwise false.
setupDataVolume(_data, _mult_Low, _mult_High, _mult_Ultra, _maLengthVolume, _maTypeVolume)
Sets up data for volume levels.
Parameters:
_data (map) : (map) The map to store the levels.
_mult_Low (simple float) : (float) The multiplier for low level.
_mult_High (simple float) : (float) The multiplier for high level.
_mult_Ultra (simple float) : (float) The multiplier for ultra level.
_maLengthVolume (simple int) : (int) The length for MA.
_maTypeVolume (simple string) : (string) The type for MA.
Returns: (void) Nothing.
setupDataSpread(_data, _mult_Low, _mult_High, _mult_Ultra, _maLengthSpread, _maTypeSpread)
Sets up data for spread levels.
Parameters:
_data (map) : (map) The map to store the levels.
_mult_Low (simple float) : (float) The multiplier for low level.
_mult_High (simple float) : (float) The multiplier for high level.
_mult_Ultra (simple float) : (float) The multiplier for ultra level.
_maLengthSpread (simple int) : (int) The length for MA.
_maTypeSpread (simple string) : (string) The type for MA.
Returns: (void) Nothing.
setupDataForecastVolume(_dataForecast, _mult_Low, _mult_High, _mult_Ultra, _maLengthVolume, _predictedLevelVolume, _maTypeVolume)
Sets up data for volume and spread levels for forecast.
Parameters:
_dataForecast (map)
_mult_Low (simple float) : (float) The multiplier for low level.
_mult_High (simple float) : (float) The multiplier for high level.
_mult_Ultra (simple float) : (float) The multiplier for ultra level.
_maLengthVolume (simple int) : (int) The length for MA.
_predictedLevelVolume (float) : (float) The predicted level for MA.
_maTypeVolume (simple string) : (string) The type for MA.
Returns: (void) Nothing.
setupDataForecastSpread(_dataForecast, _mult_Low, _mult_High, _mult_Ultra, _maLengthSpread, _predictedLevelSpread, _maTypeSpread)
Sets up data for spread levels for forecast.
Parameters:
_dataForecast (map)
_mult_Low (simple float) : (float) The multiplier for low level.
_mult_High (simple float) : (float) The multiplier for high level.
_mult_Ultra (simple float) : (float) The multiplier for ultra level.
_maLengthSpread (simple int) : (int) The length for MA.
_predictedLevelSpread (float) : (float) The predicted level for MA.
_maTypeSpread (simple string) : (string) The type for MA.
Returns: (void) Nothing.
isVolumeLow(_data, _barIndex)
Determines if the volume is low.
Parameters:
_data (map) : (map) The data map with volume levels.
_barIndex (int)
Returns: (bool) True if the volume is low, otherwise false.
isVolumeNormal(_data, _barIndex)
Determines if the volume is normal.
Parameters:
_data (map) : (map) The data map with volume levels.
_barIndex (int)
Returns: (bool) True if the volume is normal, otherwise false.
isVolumeHigh(_data, _barIndex)
Determines if the volume is high.
Parameters:
_data (map) : (map) The data map with volume levels.
_barIndex (int)
Returns: (bool) True if the volume is high, otherwise false.
isVolumeUltra(_data, _barIndex)
Determines if the volume is ultra.
Parameters:
_data (map) : (map) The data map with volume levels.
_barIndex (int)
Returns: (bool) True if the volume is ultra, otherwise false.
isSpreadLow(_data, _barIndex)
Determines if the spread is low.
Parameters:
_data (map) : (map) The data map with spread levels.
_barIndex (int)
Returns: (bool) True if the spread is low, otherwise false.
isSpreadNormal(_data, _barIndex)
Determines if the spread is normal.
Parameters:
_data (map) : (map) The data map with spread levels.
_barIndex (int)
Returns: (bool) True if the spread is normal, otherwise false.
isSpreadHigh(_data, _barIndex)
Determines if the spread is high.
Parameters:
_data (map) : (map) The data map with spread levels.
_barIndex (int)
Returns: (bool) True if the spread is high, otherwise false.
isSpreadUltra(_data, _barIndex)
Determines if the spread is ultra.
Parameters:
_data (map) : (map) The data map with spread levels.
_barIndex (int)
Returns: (bool) True if the spread is ultra, otherwise false.
isVolumeText(_data)
Determines text string representing the volume area level.
Parameters:
_data (map) : (map) The data map with volume levels.
Returns: (string) Text string of Low, Normal, High, or Ultra.
isSpreadText(_data)
Determines text string representing the spread area level.
Parameters:
_data (map) : (map) The data map with spread levels.
Returns: (string) Text string of Low, Normal, High, or Ultra.
calcBarColor(_value, _level)
Calculates the color based level.
Parameters:
_value (float) : (float) The value to check.
_level (float) : (float) The value level for comparison.
Returns: (color) The color for the bar.
bullPinBar(_maxBodyPercent, _minWickPercent)
Determines if the bar is a bull pin bar.
Parameters:
_maxBodyPercent (simple float) : (float) The maximum body percentage.
_minWickPercent (simple float) : (float) The minimum wick percentage.
Returns: (bool) True if the bar is a bull pin bar, otherwise false.
bearPinBar(_maxBodyPercent, _minWickPercent)
Determines if the bar is a bear pin bar.
Parameters:
_maxBodyPercent (simple float) : (float) The maximum body percentage.
_minWickPercent (simple float) : (float) The minimum wick percentage.
Returns: (bool) True if the bar is a bear pin bar, otherwise false.
dojiBar(_maxBodyPercent)
Determines if the bar is a doji.
Parameters:
_maxBodyPercent (simple float) : (float) The maximum body percentage.
Returns: (bool) True if the bar is a doji, otherwise false.
spinningTopBar(_minWicksPercent, _emaLength)
Determines if the bar is a spinning top.
Parameters:
_minWicksPercent (simple float) : (float) The minimum wicks percentage.
_emaLength (simple int) : (int) The length for EMA calculation.
Returns: (bool) True if the bar is a spinning top, otherwise false.
highWaveBar(_minBodyPercent, _minWickPercent, _bars)
Determines if the bar is a high wave bar.
Parameters:
_minBodyPercent (simple float) : (float) The minimum body percentage.
_minWickPercent (simple float) : (float) The minimum wick percentage.
_bars (simple int) : (int) The number of bars for comparison.
Returns: (bool) True if the bar is a high wave bar, otherwise false.
consolidationBar(_data, _spread, _bars)
Determines if the bars are in consolidation.
Parameters:
_data (map) : (map) The data map with spread levels.
_spread (simple float) : (float) The spread percentage for comparison.
_bars (simple int) : (int) The number of bars for comparison.
Returns: (bool) True if the bars are in consolidation, otherwise false.
S_DownThrust(_data, _bullPinBarMaxBody, _bullPinBarMinWick)
Determines if there is a sign of strength (DownThrust).
Parameters:
_data (map) : (map) The data map with volume and spread levels.
_bullPinBarMaxBody (simple float) : (float) The maximum body percentage for bull pin bar.
_bullPinBarMinWick (simple float) : (float) The minimum wick percentage for bull pin bar.
Returns: (bool) True if there is a sign of strength (DownThrust), otherwise false.
S_SellingClimax(_data, _rejectionWick)
Determines if there is a sign of strength (Selling Climax).
Parameters:
_data (map) : (map) The data map with volume and spread levels.
_rejectionWick (simple float) : (float) The rejection wick percentage.
Returns: (bool) True if there is a sign of strength (Selling Climax), otherwise false.
S_NoEffortBearishResult()
Determines if there is a sign of strength (No Effort Bearish Result).
Returns: (bool) True if there is a sign of strength (No Effort Bearish Result), otherwise false.
S_BearishEffortNoResult()
Determines if there is a sign of strength (Bearish Effort No Result).
Returns: (bool) True if there is a sign of strength (Bearish Effort No Result), otherwise false.
S_InverseDownThrust(_data, _bearPinBarMaxBody, _bearPinBarMinWick)
Determines if there is a sign of strength (Inverse DownThrust).
Parameters:
_data (map) : (map) The data map with volume and spread levels.
_bearPinBarMaxBody (simple float) : (float) The maximum body percentage for bear pin bar.
_bearPinBarMinWick (simple float) : (float) The minimum wick percentage for bear pin bar.
Returns: (bool) True if there is a sign of strength (Inverse DownThrust), otherwise false.
S_FailedSellingClimax()
Determines if there is a sign of strength (Failed Selling Climax).
Returns: (bool) True if there is a sign of strength (Failed Selling Climax), otherwise false.
S_BullOutsideReversal(_data)
Determines if there is a sign of strength (Bull Outside Reversal).
Parameters:
_data (map) : (map) The data map with volume and spread levels.
Returns: (bool) True if there is a sign of strength (Bull Outside Reversal), otherwise false.
S_EndOfFallingMarket(_data)
Determines if there is a sign of strength (End of Falling Market).
Parameters:
_data (map) : (map) The data map with volume and spread levels.
Returns: (bool) True if there is a sign of strength (End of Falling Market), otherwise false.
S_PseudoDownThrust(_bullPinBarMaxBody, _bullPinBarMinWick)
Determines if there is a sign of strength (Pseudo DownThrust).
Parameters:
_bullPinBarMaxBody (simple float) : (float) The maximum body percentage for bull pin bar.
_bullPinBarMinWick (simple float) : (float) The minimum wick percentage for bull pin bar.
Returns: (bool) True if there is a sign of strength (Pseudo DownThrust), otherwise false.
S_NoSupply(_bullPinBarMaxBody, _bullPinBarMinWick)
Determines if there is a sign of strength (No Supply).
Parameters:
_bullPinBarMaxBody (simple float) : (float) The maximum body percentage for bull pin bar.
_bullPinBarMinWick (simple float) : (float) The minimum wick percentage for bull pin bar.
Returns: (bool) True if there is a sign of strength (No Supply), otherwise false.
W_UpThrust(_data, _bearPinBarMaxBody, _bearPinBarMinWick)
Determines if there is a sign of weakness (UpThrust).
Parameters:
_data (map) : (map) The data map with volume and spread levels.
_bearPinBarMaxBody (simple float) : (float) The maximum body percentage for bear pin bar.
_bearPinBarMinWick (simple float) : (float) The minimum wick percentage for bear pin bar.
Returns: (bool) True if there is a sign of weakness (UpThrust), otherwise false.
W_BuyingClimax(_data, _rejectionWick)
Determines if there is a sign of weakness (Buying Climax).
Parameters:
_data (map) : (map) The data map with volume and spread levels.
_rejectionWick (simple float) : (float) The rejection wick percentage.
Returns: (bool) True if there is a sign of weakness (Buying Climax), otherwise false.
W_NoEffortBullishResult()
Determines if there is a sign of weakness (No Effort Bullish Result).
Returns: (bool) True if there is a sign of weakness (No Effort Bullish Result), otherwise false.
W_BullishEffortNoResult()
Determines if there is a sign of weakness (Bullish Effort No Result).
Returns: (bool) True if there is a sign of weakness (Bullish Effort No Result), otherwise false.
W_InverseUpThrust(_data, _bullPinBarMaxBody, _bullPinBarMinWick)
Determines if there is a sign of weakness (Inverse UpThrust).
Parameters:
_data (map) : (map) The data map with volume and spread levels.
_bullPinBarMaxBody (simple float) : (float) The maximum body percentage for bull pin bar.
_bullPinBarMinWick (simple float) : (float) The minimum wick percentage for bull pin bar.
Returns: (bool) True if there is a sign of weakness (Inverse UpThrust), otherwise false.
W_FailedBuyingClimax()
Determines if there is a sign of weakness (Failed Buying Climax).
Returns: (bool) True if there is a sign of weakness (Failed Buying Climax), otherwise false.
W_BearOutsideReversal(_data)
Determines if there is a sign of weakness (Bear Outside Reversal).
Parameters:
_data (map) : (map) The data map with volume and spread levels.
Returns: (bool) True if there is a sign of weakness (Bear Outside Reversal), otherwise false.
W_EndOfRisingMarket(_data)
Determines if there is a sign of weakness (End of Rising Market).
Parameters:
_data (map) : (map) The data map with volume and spread levels.
Returns: (bool) True if there is a sign of weakness (End of Rising Market), otherwise false.
W_PseudoUpThrust(_bearPinBarMaxBody, _bearPinBarMinWick)
Determines if there is a sign of weakness (Pseudo UpThrust).
Parameters:
_bearPinBarMaxBody (simple float) : (float) The maximum body percentage for bear pin bar.
_bearPinBarMinWick (simple float) : (float) The minimum wick percentage for bear pin bar.
Returns: (bool) True if there is a sign of weakness (Pseudo UpThrust), otherwise false.
W_NoDemand(_bearPinBarMaxBody, _bearPinBarMinWick)
Determines if there is a sign of weakness (No Demand).
Parameters:
_bearPinBarMaxBody (simple float) : (float) The maximum body percentage for bear pin bar.
_bearPinBarMinWick (simple float) : (float) The minimum wick percentage for bear pin bar.
Returns: (bool) True if there is a sign of weakness (No Demand), otherwise false.
N_QuietDoji(_dojiBarMaxBody)
Determines if there is a neutral signal (Quiet Doji).
Parameters:
_dojiBarMaxBody (simple float) : (float) The maximum body percentage for doji bar.
Returns: (bool) True if there is a neutral signal (Quiet Doji), otherwise false.
N_BalancedDoji(_data, _dojiBarMaxBody)
Determines if there is a neutral signal (Balanced Doji).
Parameters:
_data (map) : (map) The data map with volume and spread levels.
_dojiBarMaxBody (simple float) : (float) The maximum body percentage for doji bar.
Returns: (bool) True if there is a neutral signal (Balanced Doji), otherwise false.
N_StrongDoji(_dojiBarMaxBody)
Determines if there is a neutral signal (Strong Doji).
Parameters:
_dojiBarMaxBody (simple float) : (float) The maximum body percentage for doji bar.
Returns: (bool) True if there is a neutral signal (Strong Doji), otherwise false.
N_QuietSpinningTop(_spinningTopBarMinWicks, _spinningTopBarEmaLength)
Determines if there is a neutral signal (Quiet Spinning Top).
Parameters:
_spinningTopBarMinWicks (simple float) : (float) The minimum wicks percentage for spinning top bar.
_spinningTopBarEmaLength (simple int) : (int) The length for EMA calculation.
Returns: (bool) True if there is a neutral signal (Quiet Spinning Top), otherwise false.
N_BalancedSpinningTop(_data, _spinningTopBarMinWicks, _spinningTopBarEmaLength)
Determines if there is a neutral signal (Balanced Spinning Top).
Parameters:
_data (map) : (map) The data map with volume and spread levels.
_spinningTopBarMinWicks (simple float) : (float) The minimum wicks percentage for spinning top bar.
_spinningTopBarEmaLength (simple int) : (int) The length for EMA calculation.
Returns: (bool) True if there is a neutral signal (Balanced Spinning Top), otherwise false.
N_StrongSpinningTop(_spinningTopBarMinWicks, _spinningTopBarEmaLength)
Determines if there is a neutral signal (Strong Spinning Top).
Parameters:
_spinningTopBarMinWicks (simple float) : (float) The minimum wicks percentage for spinning top bar.
_spinningTopBarEmaLength (simple int) : (int) The length for EMA calculation.
Returns: (bool) True if there is a neutral signal (Strong Spinning Top), otherwise false.
N_QuietHighWave(_highWaveBarMinBody, _highWaveBarMinWick, _highWaveBarBars)
Determines if there is a neutral signal (Quiet High Wave).
Parameters:
_highWaveBarMinBody (simple float) : (float) The minimum body percentage for high wave bar.
_highWaveBarMinWick (simple float) : (float) The minimum wick percentage for high wave bar.
_highWaveBarBars (simple int) : (int) The number of bars for comparison.
Returns: (bool) True if there is a neutral signal (Quiet High Wave), otherwise false.
N_BalancedHighWave(_data, _highWaveBarMinBody, _highWaveBarMinWick, _highWaveBarBars)
Determines if there is a neutral signal (Balanced High Wave).
Parameters:
_data (map) : (map) The data map with volume and spread levels.
_highWaveBarMinBody (simple float) : (float) The minimum body percentage for high wave bar.
_highWaveBarMinWick (simple float) : (float) The minimum wick percentage for high wave bar.
_highWaveBarBars (simple int) : (int) The number of bars for comparison.
Returns: (bool) True if there is a neutral signal (Balanced High Wave), otherwise false.
N_StrongHighWave(_highWaveBarMinBody, _highWaveBarMinWick, _highWaveBarBars)
Determines if there is a neutral signal (Strong High Wave).
Parameters:
_highWaveBarMinBody (simple float) : (float) The minimum body percentage for high wave bar.
_highWaveBarMinWick (simple float) : (float) The minimum wick percentage for high wave bar.
_highWaveBarBars (simple int) : (int) The number of bars for comparison.
Returns: (bool) True if there is a neutral signal (Strong High Wave), otherwise false.
N_Consolidation(_data, _consolidationBarSpread, _consolidationBarBars)
Determines if there is a neutral signal (Consolidation).
Parameters:
_data (map) : (map) The data map with volume and spread levels.
_consolidationBarSpread (simple float) : (float) The spread percentage for consolidation bar.
_consolidationBarBars (simple int) : (int) The number of bars for comparison.
Returns: (bool) True if there is a neutral signal (Consolidation), otherwise false.

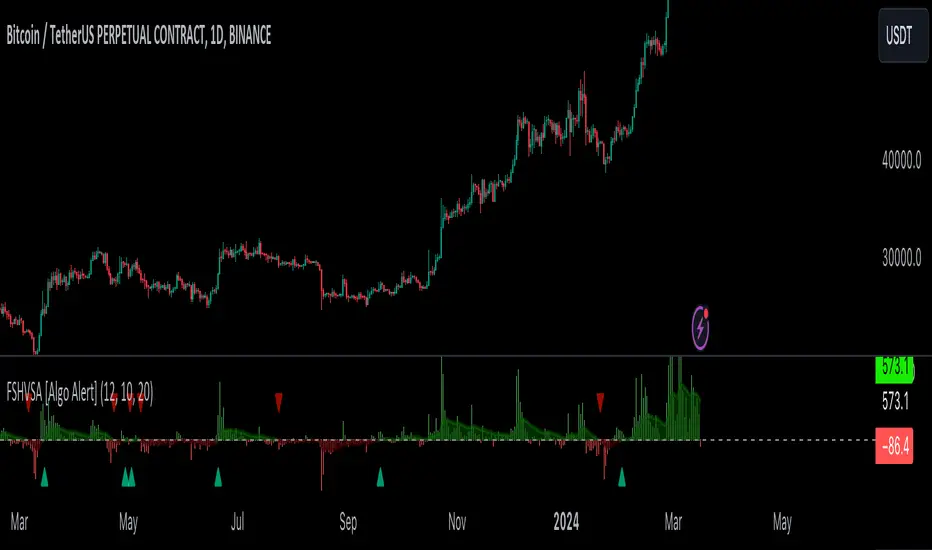
Fourier Smoothed Hybrid Volume Spread AnalysisIndicator id:
USER;91bdff47320b4284a375f428f683b21e
(only relevant to those that use API requests)
MEANINGFUL DESCRIPTION:
The Fourier Smoothed Hybrid Volume Spread Analysis (FSHVSA) indicator is an innovative trading tool designed to fuse volume analysis with trend detection capabilities, offering traders a comprehensive view of market dynamics.
This indicator stands apart by integrating the principles of the Discrete Fourier Transform (DFT) and volume spread analysis, enhanced with a layer of Fourier smoothing to distill market noise and highlight trend directions with unprecedented clarity.
This smoothing process allows traders to discern the true underlying patterns in volume and price action, stripped of the distractions of short-term fluctuations and noise.
The core functionality of the FSHVSA revolves around the innovative combination of volume change analysis, spread determination (calculated from the open and close price difference), and the strategic use of the EMA (default 10) to fine-tune the analysis of spread by incorporating volume changes.
Trend direction is validated through a moving average (MA) of the histogram, which acts analogously to the Volume MA found in traditional volume indicators. This MA serves as a pivotal reference point, enabling traders to confidently engage with the market when the histogram's movement concurs with the trend direction, particularly when it crosses the Trend MA line, signalling optimal entry points.
It returns 0 when MA of the histogram and EMA of the Price Spread are not align.
HOW TO USE THE INDICATOR:
The FSHVSA plots a positive trend when a positive Volume smoothed Spread and EMA of Volume smoothed price is above 0, and a negative when negative Volume smoothed Spread and EMA of Volume smoothed price is below 0. When this conditions are not met it plots 0.
ORIGINALITY & USEFULNESS:
The FSHVSA is unique because it applies DFT for data smoothing, effectively filtering out the minor fluctuations and leaving traders with a clear picture of the market's true movements. The DFT's ability to break down market signals into constituent frequencies offers a granular view of market dynamics, highlighting the amplitude and phase of each frequency component. This, combined with the strategic application of Ehler's Universal Oscillator principles via a histogram, furnishes traders with a nuanced understanding of market volatility and noise levels, thereby facilitating more informed trading decisions.
DETAILED DESCRIPTION:
My detailed description of the indicator and use cases which I find very valuable.
What is the meaning of price spread?
In finance, a spread refers to the difference between two prices, rates, or yields. One of the most common types is the bid-ask spread, which refers to the gap between the bid (from buyers) and the ask (from sellers) prices of a security or asset.
We are going to use Open-Close spread.
What is Volume spread analysis?
Volume spread analysis (VSA) is a method of technical analysis that compares the volume per candle, range spread, and closing price to determine price direction.
What does this mean?
We need to have a positive Volume Price Spread and a positive Moving average of Volume price spread for a positive trend. OR via versa a negative Volume Price Spread and a negative Moving average of Volume price spread for a negative trend.
What if we have a positive Volume Price Spread and a negative Moving average of Volume Price Spread ?
It results in a neutral, not trending price action.
Thus the indicator returns 0.
In the next Image you can see that trend is negative on 4h, neutral on 12h and neutral on 1D. That means trend is negative .
I am sorry, the chart is a bit messy. The idea is to use the indicator over more than 1 Timeframe.
What is approximation and smoothing?
They are mathematical concepts for making a discrete set of numbers a
continuous curved line.
Fourier and Euler approximation of a spread are taken from aprox library.
Key Features:
Noise Reduction leverages Euler's White noise capabilities for effective Volume smoothing, providing a cleaner and more accurate representation of market dynamics.
Choose between the innovative Double Discrete Fourier Transform (DTF32) and Regular Open & Close price series.
Mathematical equations presented in Pinescript:
Fourier of the real (x axis) discrete:
x_0 = array.get(x, 0) + array.get(x, 1) + array.get(x, 2)
x_1 = array.get(x, 0) + array.get(x, 1) * math.cos( -2 * math.pi * _dir / 3 ) - array.get(y, 1) * math.sin( -2 * math.pi * _dir / 3 ) + array.get(x, 2) * math.cos( -4 * math.pi * _dir / 3 ) - array.get(y, 2) * math.sin( -4 * math.pi * _dir / 3 )
x_2 = array.get(x, 0) + array.get(x, 1) * math.cos( -4 * math.pi * _dir / 3 ) - array.get(y, 1) * math.sin( -4 * math.pi * _dir / 3 ) + array.get(x, 2) * math.cos( -8 * math.pi * _dir / 3 ) - array.get(y, 2) * math.sin( -8 * math.pi * _dir / 3 )
Fourier of the imaginary (y axis) discrete:
y_0 = array.get(x, 0) + array.get(x, 1) + array.get(x, 2)
y_1 = array.get(x, 0) + array.get(x, 1) * math.sin( -2 * math.pi * _dir / 3 ) + array.get(y, 1) * math.cos( -2 * math.pi * _dir / 3 ) + array.get(x, 2) * math.sin( -4 * math.pi * _dir / 3 ) + array.get(y, 2) * math.cos( -4 * math.pi * _dir / 3 )
y_2 = array.get(x, 0) + array.get(x, 1) * math.sin( -4 * math.pi * _dir / 3 ) + array.get(y, 1) * math.cos( -4 * math.pi * _dir / 3 ) + array.get(x, 2) * math.sin( -8 * math.pi * _dir / 3 ) + array.get(y, 2) * math.cos( -8 * math.pi * _dir / 3 )
Euler's Smooth with Discrete Furrier approximated Volume.
a = math.sqrt(2) * math.pi / _devided
b = math.cos(math.sqrt(2) * 180 / _devided)
c2 = 2 * math.pow(a, 2) * b
c3 = math.pow(a, 4)
c1 = 1 - 2 * math.pow(a, 2) * math.cos(b) + math.pow(a, 4)
filt := na(filt ) ? 0 : c1 * (w + nz(w )) / 2.0 + c2 * nz(filt ) + c3 * nz(filt )
Usecase:
First option:
Leverage the script to identify Bullish and Bearish trends, shown with green and red triangle.
Combine Different Timeframes to accurately determine market trend.
Second option:
Pull the data with API sockets to automate your trading journey.
plot(close, title="ClosePrice", display=display.status_line)
plot(open, title="OpenPrice", display=display.status_line)
plot(greencon ? 1 : redcon ? -1 : 0, title="position", display=display.status_line)
Use ClosePrice, OpenPrice and "position" titles to easily read and backtest your strategy utilising more than 1 Time Frame.
Indicator id:
USER;91bdff47320b4284a375f428f683b21e
(only relevant to those that use API requests)
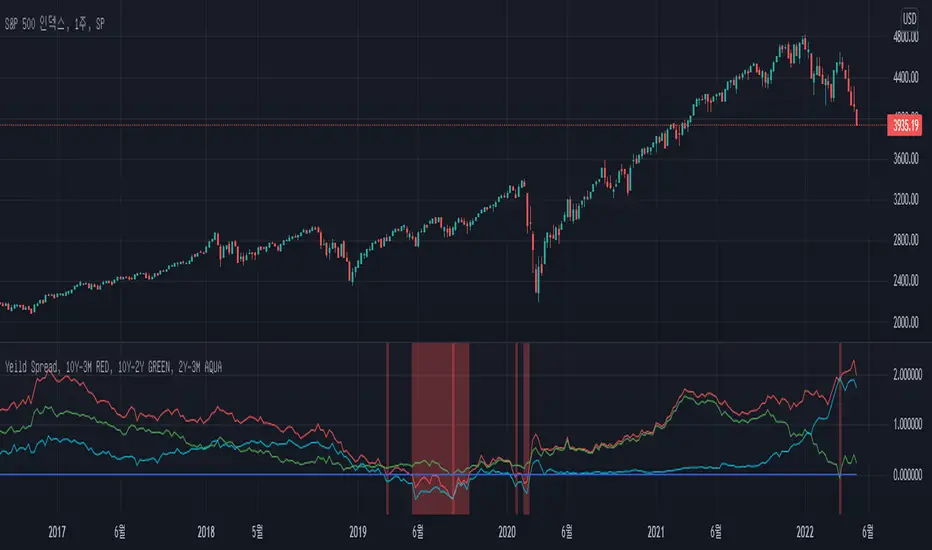
Crypto MVRV ZScore - Strategy [PresentTrading]█ Introduction and How it is Different
The "Crypto Valuation Extremes: MVRV ZScore - Strategy " represents a cutting-edge approach to cryptocurrency trading, leveraging the Market Value to Realized Value (MVRV) Z-Score. This metric is pivotal for identifying overvalued or undervalued conditions in the crypto market, particularly Bitcoin. It assesses the current market valuation against the realized capitalization, providing insights that are not apparent through conventional analysis.
BTCUSD 6h Long/Short Performance
Local
█ Strategy, How It Works: Detailed Explanation
The strategy leverages the Market Value to Realized Value (MVRV) Z-Score, specifically designed for cryptocurrencies, with a focus on Bitcoin. This metric is crucial for determining whether Bitcoin is currently undervalued or overvalued compared to its historical 'realized' price. Below is an in-depth explanation of the strategy's components and calculations.
🔶Conceptual Foundation
- Market Capitalization (MC): This represents the total dollar market value of Bitcoin's circulating supply. It is calculated as the current price of Bitcoin multiplied by the number of coins in circulation.
- Realized Capitalization (RC): Unlike MC, which values all coins at the current market price, RC is computed by valuing each coin at the price it was last moved or traded. Essentially, it is a summation of the value of all bitcoins, priced at the time they were last transacted.
- MVRV Ratio: This ratio is derived by dividing the Market Capitalization by the Realized Capitalization (The ratio of MC to RC (MVRV Ratio = MC / RC)). A ratio greater than 1 indicates that the current price is higher than the average price at which all bitcoins were purchased, suggesting potential overvaluation. Conversely, a ratio below 1 suggests undervaluation.
🔶 MVRV Z-Score Calculation
The Z-Score is a statistical measure that indicates the number of standard deviations an element is from the mean. For this strategy, the MVRV Z-Score is calculated as follows:
MVRV Z-Score = (MC - RC) / Standard Deviation of (MC - RC)
This formula quantifies Bitcoin's deviation from its 'normal' valuation range, offering insights into market sentiment and potential price reversals.
🔶 Spread Z-Score for Trading Signals
The strategy refines this approach by calculating a 'spread Z-Score', which adjusts the MVRV Z-Score over a specific period (default: 252 days). This is done to smooth out short-term market volatility and focus on longer-term valuation trends. The spread Z-Score is calculated as follows:
Spread Z-Score = (Market Z-Score - MVVR Ratio - SMA of Spread) / Standard Deviation of Spread
Where:
- SMA of Spread is the simple moving average of the spread over the specified period.
- Spread refers to the difference between the Market Z-Score and the MVRV Ratio.
🔶 Trading Signals
- Long Entry Condition: A long (buy) signal is generated when the spread Z-Score crosses above the long entry threshold, indicating that Bitcoin is potentially undervalued.
- Short Entry Condition: A short (sell) signal is triggered when the spread Z-Score falls below the short entry threshold, suggesting overvaluation.
These conditions are based on the premise that extreme deviations from the mean (as indicated by the Z-Score) are likely to revert to the mean over time, presenting opportunities for strategic entry and exit points.
█ Practical Application
Traders use these signals to make informed decisions about opening or closing positions in the Bitcoin market. By quantifying market valuation extremes, the strategy aims to capitalize on the cyclical nature of price movements, identifying high-probability entry and exit points based on historical valuation norms.
█ Trade Direction
A unique feature of this strategy is its configurable trade direction. Users can specify their preference for engaging in long positions, short positions, or both. This flexibility allows traders to tailor the strategy according to their risk tolerance, market outlook, or trading style, making it adaptable to various market conditions and trader objectives.
█ Usage
To implement this strategy, traders should first adjust the input parameters to align with their trading preferences and risk management practices. These parameters include the trade direction, Z-Score calculation period, and the thresholds for long and short entries. Once configured, the strategy automatically generates trading signals based on the calculated spread Z-Score, providing clear indications for potential entry and exit points.
It is advisable for traders to backtest the strategy under different market conditions to validate its effectiveness and adjust the settings as necessary. Continuous monitoring and adjustment are crucial, as market dynamics evolve over time.
█ Default Settings
- Trade Direction: Both (Allows for both long and short positions)
- Z-Score Calculation Period: 252 days (Approximately one trading year, capturing a comprehensive market cycle)
- Long Entry Threshold: 0.382 (Indicative of moderate undervaluation)
- Short Entry Threshold: -0.382 (Signifies moderate overvaluation)
These default settings are designed to balance sensitivity to market valuation extremes with a pragmatic approach to trade execution. They aim to filter out noise and focus on significant market movements, providing a solid foundation for both new and experienced traders looking to exploit the unique insights offered by the MVRV Z-Score in the cryptocurrency market.

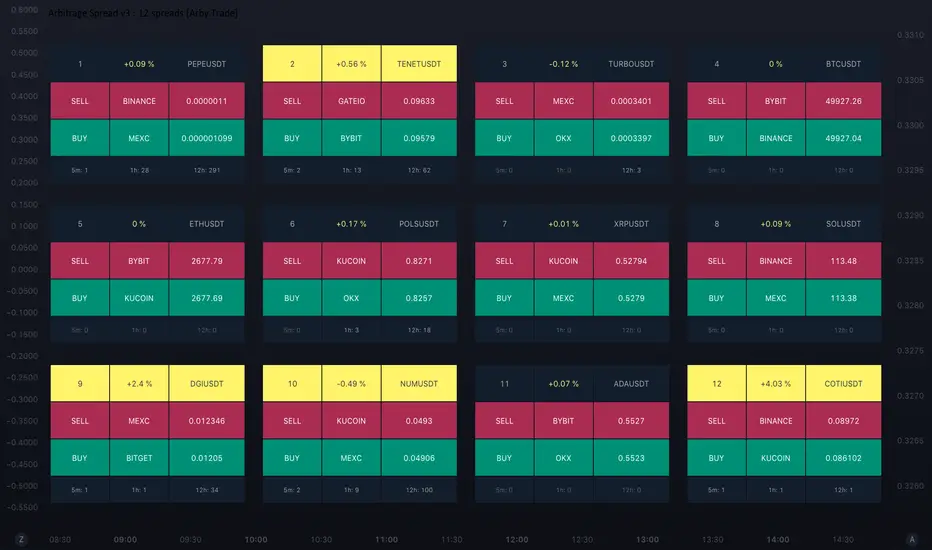
Arbitrage Spread v3 : 12 spreads dashboard [Arby.Trade]This indicator allows you to track in real time the change in the spread (the difference in the exchange rate) between two assets simultaneously for 12 trading pairs.
⚙️ How does the indicator work?
In the indicator settings menu, the user selects two trading pairs, for example BTCUSDT on the Binance exchange and BTCUSDT on the Bybit exchange, after which the script will receive prices from both exchanges and compare them with each other, calculating the percentage deviation between prices (spread). The script will do this work with all 12 trading pairs added to the script settings menu. The script can only work with those assets and exchanges that are on board TradingView, and this is not a small thing.
⚡️ How to use it?
At times when the spread value is negative, this means that the price of the asset on the first exchange is less than on the second. That is, by buying an asset on the first exchange and selling it on the second one, you can earn money (of course, it is important to take into account the commissions of the exchanges for these transactions). When the spread is above zero, the opposite is true. The exchanges and the prices at which to buy are displayed in the green Buy row. Prices and exchanges for sale are in the Sell row and highlighted in red. When the spread is zero, the prices on both exchanges are the same and there is no arbitrage situation.
To improve the accuracy of the indicator, try to use the minimum timeframe available for your TradingView subscription – minute or second.
🕒 Counter of arbitration situations
For each trading pair, the table below the Buy row shows the number of arbitrage situations that have been on the asset for a certain period of time. In this case, an arbitrage situation is understood as the moment when the spread value exceeded the Signal Threshold Level set by the user. Each time the spread value of the Signal Threshold Level is exceeded, the counter will add one. The counter takes into account only those arbitrage situations that were on the market during the time period back from the current moment. For example, for a 1-hour period (1h) of the counter, the number of arbitration situations for the last hour will be displayed. For each asset you can simultaneously track the number of arbitrage situations during three selected time periods from 5 minutes to a day.
The counter will allow you to evaluate the prospects of arbitrage of selected trading pairs. For example, if the number of arbitrage situations on a trading pair was 1-2 within an hour, then it is obvious that it is better not to waste time waiting for another such situation on this pair and look for the next one.
🔔 Setting up Alerts
In the script settings, you can set the threshold value of the spread – Spread Signal Threshold. When this level is reached, the table related to the asset whose spread has reached this level will be highlighted. Also, this level is a signal level for setting up alerts from the indicator.
To set up alerts, open the Alerts tab in the TradingView menu on the right. Click the "Create Alert" button. Then, in the window that opens, select this indicator in the "Condition" line. After that, you can set a name for this alert and complete the notification setup by clicking the "Create" button.
We, the authors of this script, have been engaged in cryptocurrency arbitrage for a long time and, first of all, created it for ourselves and our daily arbitrage trading, but this does not prevent you from using it at your discretion for any types of assets and in any markets.
We have a lighter version of the indicator that allows you to track the spread for only one trading pair or three at the same time. In these versions you can also view the chart of the spread itself, which can be useful for assessing the nature of the spread movement in the history. If this indicator seems too heavy for you and your device, you can use these lighter versions:
🧩 Arbitrage Spread v1 : 1 pair + 1 chart
🧩 Arbitrage Spread v2 : 3 pairs + 3 charts
If, on the contrary, the capabilities of your hardware allow, do not forget that you can always add several indicators to your screen – for example, use the version with 12 pairs as a dashboard with many pairs, and in addition to it one of the versions with a spread chart and look at a more detailed picture of one or three instruments separately.
--
Данный индикатор позволяет отслеживать в реальном времени изменение спреда (разницы в курсе) между двумя активами одновременно для 12 торговых пар.
⚙️ Как устроен индикатор?
В меню настроек индикатора пользователь выбирает две торговые пары, например BTCUSDT на бирже Binance и BTCUSDT на бирже Bybit, после чего скрипт получит цены с обеих бирж и сравнит их между собой, рассчитав процентное отклонение между ценами (спред). Такую работу скрипт проделает со всеми 12 торговыми парами добавленными в меню настроек скрипта. Скрипт может работать только с теми активами и биржами, которые есть на борту TradingView, и это не мало.
⚡️ Как пользоваться?
В моменты, когда значение спреда отрицательное, это означает, что цена на актив на первой бирже меньше, чем на второй. То есть, купив актив на первой бирже и продав его на второй можно заработать (конечно при этом важно учитывать комиссии бирж на совершение данных сделок). Когда спред выше нуля - наоборот. Биржи и цены, по которым надо покупать отображаются в зеленой строке Buy. Цены и биржи для продажи – в строке Sell и выделены красным цветом. Когда спред равен нулю – цены на обеих биржах одинаковы и арбитражная ситуация отсутствует.
Для повышения точности работы индикатора старайтесь использовать минимально доступный для вашей подписки TradingView таймфрейм – минутный или секундный.
🕒 Счетчик арбитражных ситуаций
По каждой торговой паре в таблице под строкой Buy отображается количество арбитражных ситуаций, которые были на инструменте в течение определенного промежутка времени. В данном случае под арбитражной ситуацией понимается момент, когда значение спреда превысило установленный пользователем сигнальный уровень спреда Signal Threshold Level. При каждом превышении значения спреда уровня Signal Threshold Level счетчик будет прибавлять единицу. Счетчик учитывает только те арбитражные ситуации, которые были на рынке в течение временного периода назад от текущего момента. К примеру, для 1-часового периода (1h) счетчика будет отображаться количество арбитражных ситуаций за последний час. По каждому инструменту одновременно можно отслеживать количество арбитражных ситуаций в течение трех выбранных временных периода от 5 минут до суток.
Счетчик позволит оценить перспективность арбитража выбранных торговых пар. К примеру, если количество арбитражных ситуаций на торговой паре в течение часа было 1-2, то очевидно, что лучше не тратить время на ожидание очередной такой ситуации на данной паре и поискать следующую.
🔔 Настройка оповещений
В настройках скрипта можно настроить пороговое значение спреда – Spread Signal Threshold. При достижении этого уровня будет подсвечена таблица относящаяся к активу, спред которого достиг этого уровня. Так же, этот уровень является сигнальным для настройки оповещений от индикатора.
Для настройки оповещений откройте вкладку «Оповещения» в меню TradingView справа. Нажмите кнопку «Создать оповещение». Затем в открывшемся окне в строке «Условие» выберете данный индикатор. После чего вы можете задать название данному оповещению и завершить настройку оповещения, нажав кнопку «Создать».
Мы, авторы данного скрипта, давно занимаемся арбитражем криптовалюты и, в первую очередь, создавали его для себя и своей каждодневной арбитражной торговли, но это не мешает вам использовать его по своему усмотрению для любых видов активов и на любых рынках.
У нас есть более легкая версия индикатора, позволяющая отслеживать спред только по одной торговой паре или одновременно по трем. В этих версиях также можно просматривать график самого спреда, что может быть полезным для оценки характера движения спреда в истории. Если данный индикатор покажется для вас и вашего устройства слишком тяжелым вы можете воспользоваться этими более легкими версиями:
🧩 Arbitrage Spread v1 : 1 pair + 1 chart
🧩 Arbitrage Spread v2 : 3 pairs + 3 charts
Если, наоборот, возможности вашего железа позволяют, не забывайте, что вы всегда можете добавить себе на экран несколько индикаторов – например, версию с 12 парами использовать как дашборд с множеством пар, а в дополнение к ней одну из версий с графиком спреда и смотреть более детальную картину по одному или трем инструментам отдельно.
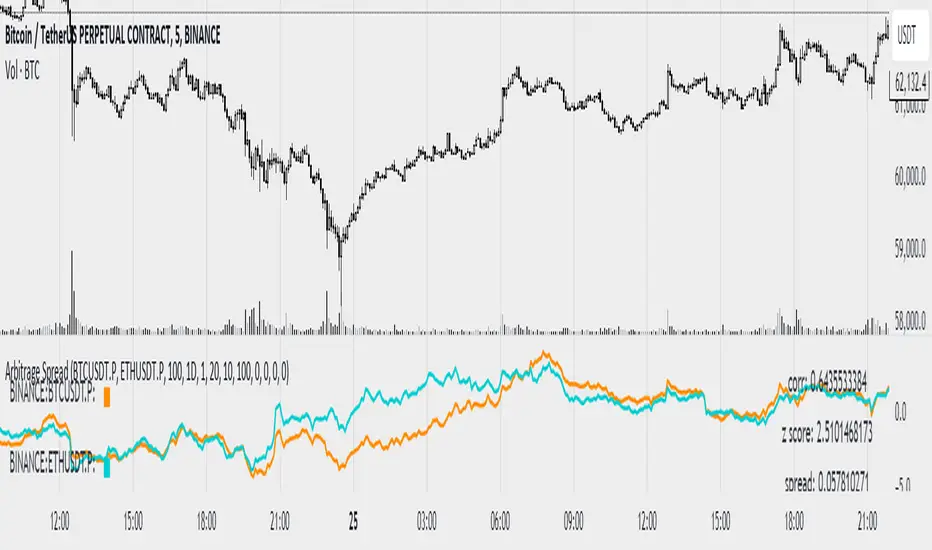
Arbitrage Spread v2 : 3 pairs + 3 charts [Arby.Trade]
This indicator allows you to track in real time the change in the spread (the difference in the exchange rate) between two assets for three trading pairs at the same time.
How does the indicator work?
In the indicator settings menu, the user selects two trading pairs, for example BTCUSDT on the Binance exchange and BTCUSDT on the Bybit exchange, after which the script will receive prices from both exchanges and compare them with each other, calculating the percentage deviation between prices (spread). This setting can be made for three trading pairs. Keep in mind that the script can only work with those assets and exchanges that are on board TradingView, and this is quite a lot.
According to the calculated value of spreads, the spread lines for three trading pairs are displayed on the screen. The spread lines move between values above zero and below. When the spread line is below zero, it means that the price of the asset on the first exchange is less than on the second. That is, by buying an asset on the first exchange and selling it on the second one, you can earn money (of course, it is important to take into account the commissions of the exchanges for these transactions). When the spread line is above zero, the opposite is true. When the spread is zero, the prices on both exchanges are the same and there is no arbitrage situation.
Indicator settings.
For a better visual representation of the current spread value, the indicator has the ability to set two threshold spread levels. The first threshold level is the level below which the spread is not interesting to the trader and he will not consider arbitrage deals. The second threshold level is the level of a particularly high spread. When the spread value exceeds the second threshold level, the spread values will be signed above the spread line, and the extreme values for the user-defined period of bars back will be additionally highlighted in a brighter color. Both threshold levels are displayed on the chart and the user can change their values in the indicator settings menu.
The script allows you to leave only one spread line on the chart for one of the three trading pairs, while maintaining the display of indicator tables for three trading pairs. The script also allows you to completely disable the display of unnecessary trading pairs.
If the volatility of the spread lines is too high and the spread lines from different trading pairs overlap each other, use the "Distance between charts" setting and increase its value until the display of all three charts becomes comfortable.
Alerts.
Additionally, you can set the threshold value of the spread, at which the script will send notifications from TradingView. We called it the Spread Signal Threshold. This threshold level has nothing to do with the visual thresholds described above. You can set a signal level exceeding the second visual threshold or make it lower, but it is important to understand that TradingView alerts will only be triggered if the Spread Signal Threshold is exceeded. This threshold level is common to all trading pairs, so notifications will be sent when this spread level is reached for any of the three trading pairs.
To set up alerts, open the "Alerts" tab in the TradingView menu on the right. Click the "Create Alert" button. Then, in the window that opens, select this indicator in the "Condition" line. After that, you can set a name for this alert and complete the notification setup by clicking the "Create" button.
We, the authors of this script, have been engaged in cryptocurrency arbitrage for a long time and, first of all, created it for ourselves and our daily arbitrage trading, but this does not prevent you from using it at your discretion for any types of assets and in any markets.
We have a lighter version of the indicator that allows you to track the spread for only one trading pair. If this indicator seems too heavy for you and your device, you can use a lighter version .
If, on the contrary, the capabilities of your hardware allow, do not forget that you can always add several copies of this indicator to your screen and simultaneously track not 3, but 6-9-12 and so on arbitrage pairs at the same time. ;)
--
Данный индикатор позволяет отслеживать в реальном времени изменение спреда (разницы в курсе) между двумя активами по трем торговым парам.
Как устроен индикатор?
В меню настроек индикатора пользователь выбирает две торговые пары, например BTCUSDT на бирже Binance и BTCUSDT на бирже Bybit, после чего скрипт получит цены с обеих бирж и сравнит их между собой, рассчитав процентное отклонение между ценами (спред). Такую настройку можно произвести для трех торговых пар. Учитывайте, что скрипт может работать только с теми активами и биржами, которые есть на борту TradingView, и это не мало.
По рассчитанному значению спредов на экран выводится линии спредов по трем торговым парам. Линии спредов двигаются между значениями то выше нуля, то ниже. Когда линия спреда ниже нуля это значит что цена на актив на первой бирже меньше, чем на второй. То есть, купив актив на первой бирже и продав его на второй можно заработать (конечно при этом важно учитывать комиссии бирж на совершение данных сделок). Когда линия спреда выше нуля - наоборот. Когда спред равен нулю - цены на обеих биржах одинаковы и арбитражная ситуация отсутствует.
Настройки индикатора.
Для лучшего визуального представления о текущем значении спреда индикатор имеет возможность задать два пороговых уровня спреда. Первый пороговый уровень – это уровень, ниже которого спред не интересен трейдеру и он не будет рассматривать арбитражные сделки. Второй пороговый уровень – это уровень особенно повышенного спреда. Когда значение спреда превышает второй пороговый уровень над линией спреда будут подписаны значения спреда, а экстремальные значения за заданный пользователем период баров назад будут дополнительно выделены более ярким цветом. Оба пороговых уровня отображаются на графике и пользователь может менять их значения в меню настроек индикатора.
Скрипт позволяет оставить на графике только одну линию спреда по одной из трех торговых пар, при этом сохранив отображение индикаторных таблиц по трем торговым парам. Также скрипт позволяет полностью отключить отображение ненужных торговых пар.
Если волатильность линий спреда слишком высока и линии спреда от разных торговых пар накладываются друг на друга воспользуйтесь настройкой «Distance between charts» и увеличивайте ее значение до тех пор пока отображение всех трех графиков не станет комфортным.
Уведомления.
Дополнительно можно настроить пороговое значение спреда, при достижении которого скрипт будет отправлять уведомления от TradingView. Мы назвали это Spread Signal Threshold. Этот пороговый уровень никак не связан с визуальными пороговыми уровнями, описанными выше. Вы можете задать сигнальный уровень превышающий второй визуальный пороговый уровень или сделать его ниже, но важно понимать, что оповещения TradingView будут срабатывать только от превышения именно Spread Signal Threshold. Этот пороговый уровень является общим для всех торговых пар, поэтому уведомления будут приходить при достижении этого уровня спреда по любой из трех торговых пар.
Для настройки оповещений откройте вкладку «Оповещения» в меню TradingView справа. Нажмите кнопку «Создать оповещение». Затем в открывшемся окне в строке «Условие» выберете данный индикатор. После чего вы можете задать название данному оповещению и завершить настройку оповещения, нажав кнопку «Создать».
Мы, авторы данного скрипта, давно занимаемся арбитражем криптовалюты и, в первую очередь, создавали его для себя и своей каждодневной арбитражной торговли, но это не мешает вам использовать его по своему усмотрению для любых видов активов и на любых рынках.
У нас есть более легкая версия индикатора, позволяющая отслеживать спред только по одной торговой паре. Если данный индикатор покажется для вас и вашего устройства слишком тяжелым вы можете воспользоваться более легкой версией .
Если, наоборот, возможности вашего железа позволяют, не забывайте, что вы всегда можете добавить себе на экран несколько копий этого индикатора и отслеживать одновременно не 3, а 6-9-12 и тд арбитражных пар одновременно. ;)

Arbitrage Spread v1 : 1 pair + 1 chart [Arby.Trade]This indicator allows you to track in real time the change in the spread (the difference in the exchange rate) between two assets.
How does the indicator work?
In the indicator settings menu, the user selects two trading pairs, for example BTCUSDT on the Binance exchange and BTCUSDT on the Bybit exchange, after which the script will receive prices from both exchanges and compare them with each other, calculating the percentage deviation between prices (spread). The script can only work with those assets and exchanges that are on board TradingView.
According to the calculated spread value, the spread line is displayed on the screen. This line moves between values above zero and below. When the spread line is below zero, it means that the price of the asset on the first exchange is less than on the second. That is, by buying an asset on the first exchange and selling it on the second one, you can earn money (of course, it is important to take into account the commissions of the exchanges for these transactions). When the spread line is above zero, the opposite is true. When the spread is zero, the prices on both exchanges are the same and there is no arbitrage situation.
Indicator settings.
For a better visual representation of the current spread value, the indicator has the ability to set two threshold spread levels. The first threshold level is the level below which the spread is not interesting to the trader and he will not consider arbitrage deals. The second threshold level is the level of a particularly high spread. When the spread value exceeds the second threshold level, the spread values will be signed above the spread line, and the extreme values for the user-defined period of bars back will be additionally highlighted in a brighter color. Both threshold levels are displayed on the chart and the user can change their values in the indicator settings menu.
Alerts.
Additionally, you can set the threshold value of the spread, at which the script will send notifications from TradingView. We called it the Spread Signal Threshold. This threshold level has nothing to do with the visual thresholds described above. You can set a signal level exceeding the second visual threshold or make it lower, but it is important to understand that TradingView alerts will only be triggered if the Spread Signal Threshold is exceeded.
To set up alerts, open the "Alerts" tab in the TradingView menu on the right. Click the "Create Alert" button. Then, in the window that opens, select this indicator in the "Condition" line. After that, you can set a name for this alert and complete the notification setup by clicking the "Create" button.
We, the authors of this script, have been engaged in cryptocurrency arbitrage for a long time and, first of all, created it for ourselves and our daily arbitrage trading, but this does not prevent you from using it at your discretion for any types of assets and in any markets.
--
Данный индикатор позволяет отслеживать в реальном времени изменение спреда (разницы в курсе) между двумя активами.
Как устроен индикатор?
В меню настроек индикатора пользователь выбирает две торговые пары, например BTCUSDT на бирже Binance и BTCUSDT на бирже Bybit, после чего скрипт получит цены с обеих бирж и сравнит их между собой, рассчитав процентное отклонение между ценами (спред). Скрипт может работать только с теми активами и биржами, которые есть на борту TradingView, и это не мало.
По рассчитанному значению спреда на экран выводится линия спреда. Данная линия двигается между значениями то выше нуля, то ниже. Когда линия спреда ниже нуля это значит что цена на актив на первой бирже меньше, чем на второй. То есть, купив актив на первой бирже и продав его на второй можно заработать (конечно при этом важно учитывать комиссии бирж на совершение данных сделок). Когда линия спреда выше нуля - наоборот. Когда спред равен нулю - цены на обеих биржах одинаковы и арбитражная ситуация отсутствует.
Настройки индикатора.
Для лучшего визуального представления о текущем значении спреда индикатор имеет возможность задать два пороговых уровня спреда. Первый пороговый уровень – это уровень, ниже которого спред не интересен трейдеру и он не будет рассматривать арбитражные сделки. Второй пороговый уровень – это уровень особенно повышенного спреда. Когда значение спреда превышает второй пороговый уровень над линией спреда будут подписаны значения спреда, а экстремальные значения за заданный пользователем период баров назад будут дополнительно выделены более ярким цветом. Оба пороговых уровня отображаются на графике и пользователь может менять их значения в меню настроек индикатора.
Уведомления.
Дополнительно можно настроить пороговое значение спреда, при достижении которого скрипт будет отправлять уведомления от TradingView. Мы назвали это Spread Signal Threshold. Этот пороговый уровень никак не связан с визуальными пороговыми уровнями, описанными выше. Вы можете задать сигнальный уровень превышающий второй визуальный пороговый уровень или сделать его ниже, но важно понимать, что оповещения TradingView будут срабатывать только от превышения именно Spread Signal Threshold.
Для настройки оповещений откройте вкладку «Оповещения» в меню TradingView справа. Нажмите кнопку «Создать оповещение». Затем в открывшемся окне в строке «Условие» выберете данный индикатор. После чего вы можете задать название данному оповещению и завершить настройку оповещения, нажав кнопку «Создать».
Мы, авторы данного скрипта, давно занимаемся арбитражем криптовалюты и, в первую очередь, создавали его для себя и своей каждодневной арбитражной торговли, но это не мешает вам использовать его по своему усмотрению для любых видов активов и на любых рынках.

Divergence AnalyzerUnlock the potential of your trading strategy with the Divergence Analyzer, a sophisticated indicator designed to identify divergence patterns between two financial instruments. Whether you're a seasoned trader or just starting, this tool provides valuable insights into market trends and potential trading opportunities.
Key Features:
1. Versatility in Symbol Selection:
- Choose from a wide range of symbols for comparison, including popular indices like XAUUSD and SPX.
- Seamlessly toggle between symbols to analyze divergences and make informed trading decisions.
2. Flexible Calculation Options:
- Customizable options allow you to use a different symbol for calculation instead of the chart symbol.
- Fine-tune your analysis by selecting specific symbols for comparison based on your trading preferences.
3. Logarithmic Scale Analysis:
- Utilizes logarithmic scales for accurate representation of price movements.
- Linear regression coefficients are calculated on the logarithmic scale, providing a comprehensive view of trend strength.
4. Dynamic Length and Smoothing:
- Adjust the length parameter to adapt the indicator to different market conditions.
- Smoothed linear regression with exponential moving averages enhances clarity and reduces noise.
5. Standard Deviation Normalization:
- Normalizes standard deviations over 200 periods, offering a standardized view of price volatility.
- Easily compare volatility levels across different symbols for effective divergence analysis.
6. Color-Coded Divergence Visualization:
- Clearly distinguish positive and negative divergences with customizable color options.
- Visualize divergence deltas with an intuitive color scheme for quick and effective interpretation.
7. Symbol Information Table:
- An included table provides at-a-glance information about the selected symbols.
- Identify Symbol 1 and Symbol 2, along with their corresponding positive and negative divergence colors.
How to Use:
1. Select symbols for analysis using the user-friendly inputs.
2. Customize calculation options based on your preferences.
3. Analyze the divergence delta plot for clear visual indications.
4. Refer to the symbol information table for a quick overview of selected instruments.
Empower your trading strategy with the Divergence Analyzer and gain a competitive edge in the dynamic world of financial markets. Start making more informed decisions today!

Arbitrage SpreadThis indicator helps to find spreads between cryptocurrencies, assess their correlation, spread, z score and atr z score.
The graphs are plotted as a percentage. Because of the limitation in pine tradingview for 5000 bars a period was introduced (after which a new starting point of the graph construction will be started), if you want it can be disabled
The multiplier parameter affects only the construction of the joint diagram on which z score and atr z score are calculated (construction of the diagram is done by dividing one pair by another and multiplying by the multiplier parameter) is shown with a red line
To create a notification you have to specify the data for parameters other than zero which you want to monitor. For parameters z score and atr z score data are counted in both directions
The data can be tracked via the data window
Link to image of the data window prnt.sc
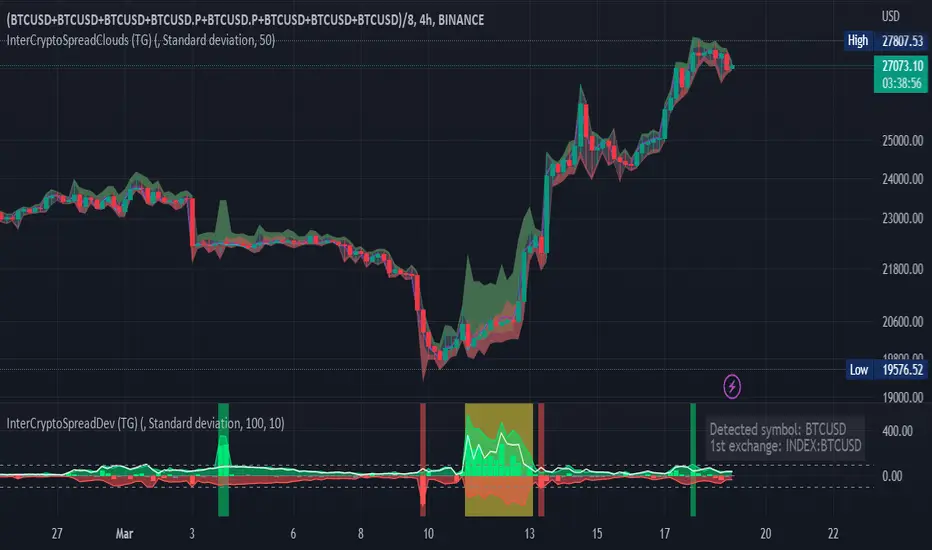
Inter-Exchanges Crypto Price Spread Clouds (Tartigradia)Display variations in min-max and median values of high, low and close across exchanges. It's a kind of realized volatility indicator, as the idea is that in times of high volatility (high emotions, fear, uncertainty), it's more likely that market inefficiencies will appear for the same asset between different market makers, ie, the price can temporarily differ a lot. This indicator will catch these instants of high differences between exchanges, even if they lasted only an instant (because we use high and low values).
Compared with my other "Inter-Exchanges Crypto Price Spread Deviation" indicator, this one overlays directly on the chart, and offers a different take based on the same premisses. Instead of summarizing volatility via standard deviation, here we display clouds of the range of values that were observed.
A big advantage of this approach is that it can also be used to determine safe stop loss levels, especially the values of percentile rank (i.e., what are the high values that were observed in at least 50% of exchanges?).
Indeed, all price levels are displayed in the indicator's status bar:
green for high values,
red for low values,
aqua for median,
purple for average,
The first two values are max and min values of high across exchanges (in green).
The next two values are max and min of low across exchanges (in red).
The next two values are median (aqua) and average (purple).
The last two values are percentile rank values for high (green) and low (red) respectively.
Another advantage is that the high (green) vs low (red) clouds can be seen as representing the buying or selling pressure respectively across exchanges, and this may in itself provide a signal to know whether one side is winning.
Link to my other complementary indicator:
Compared to other inter-exchanges spread indicators, this one offers two major features:
The symbol automatically adapts to the symbol currently selected in user's chart. Hence, switching between tickers does not require the user to modify any option, everything is dynamically updated behind the scenes.
It's easy to add more exchanges (requires some code editing because PineScript v5 does not allow dynamical request.security() calls).
Limitations/things to know:
History is limited to what the ticker itself display. Ie, even if the exchanges specified in this indicator have more data than the ticker currently displayed in the user's chart, the indicator will show only a timeperiod as long as the chart.
The indicator can manage multiple exchanges of different historical length (ie, some exchanges having more data going way earlier in the past than others), in which case they will simply be ignored from calculations when far back in the past. Hence, you should be aware that the further you go in the past, the less exchanges will have such data, and hence the less accurate the measures will be (because the deviation will be calculated from less sources than more recent bars). This is thanks to how the array.* math functions behave in case of na values, they simply skip them from calculations, contrary to math.* functions.

Inter-Exchanges Crypto Price Spread Deviation (Tartigradia)Measures the deviation of price metrics between various exchanges. It's a kind of realized volatility indicator, as the idea is that in times of high volatility (high emotions, fear, uncertainty), it's more likely that market inefficiencies will appear for the same asset between different market makers, ie, the price can temporarily differ a lot. This indicator will catch these instants of high differences between exchanges, even if they lasted only an instant (because we use high and low values).
Both standard deviation and median absolute deviation (more robust to outliers, ie, exchanges with a very different price from others won't influence the median absolute deviation, but the standard deviation yes).
Compared to other inter-exchanges spread indicators, this one offers two major features:
* The symbol automatically adapts to the symbol currently selected in user's chart. Hence, switching between tickers does not require the user to modify any option, everything is dynamically updated behind the scenes.
* It's easy to add more exchanges (requires some code editing because PineScript v5 does not allow dynamical request.security() calls).
Limitations/things to know:
* History is limited to what the ticker itself display. Ie, even if the exchanges specified in this indicator have more data than the ticker currently displayed in the user's chart, the indicator will show only a timeperiod as long as the chart.
* The indicator can manage multiple exchanges of different historical length (ie, some exchanges having more data going way earlier in the past than others), in which case they will simply be ignored from calculations when far back in the past. Hence, you should be aware that the further you go in the past, the less exchanges will have such data, and hence the less accurate the measures will be (because the deviation will be calculated from less sources than more recent bars). This is thanks to how the array.* math functions behave in case of na values, they simply skip them from calculations, contrary to math.* functions.
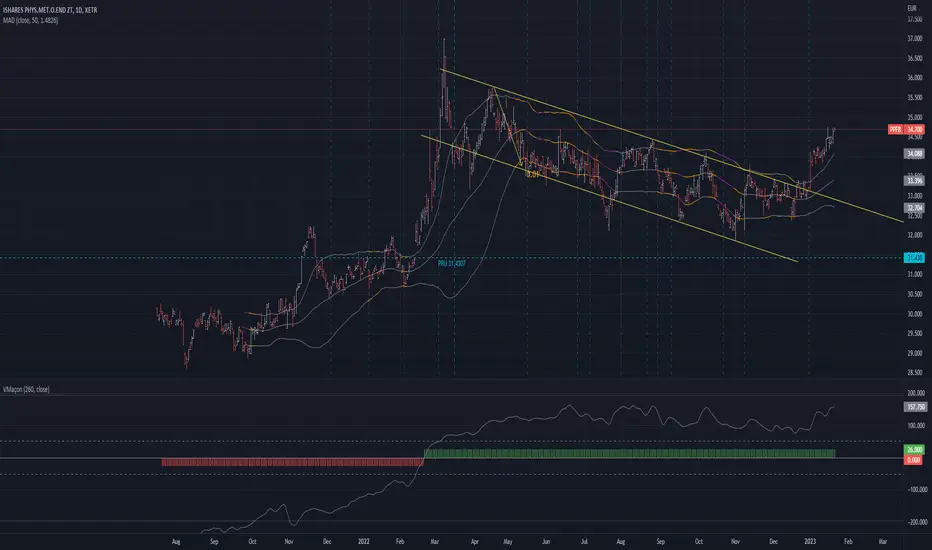
MAD - Mean Absolute Deviation purpose :implementation of MAD Mean Absolute Deviation in pinescript
implementation by : patmaba
type : measures of spread
Mean absolute deviation
The mean absolute deviation of a dataset is the average distance between each data point and the mean. It gives us an idea about the variability in a dataset.
Here's how to calculate the median absolute deviation.
Step 1: Calculate the mean.
Step 2: Calculate how far away each data point is from the mean using positive distances. These are called absolute deviations.
Step 3: Add those deviations together.
Step 4: Divide the sum by the number of data points.
Source of MAD:
www.khanacademy.org
Formula :
MAD = ( ∑ |xi−µ| ) / n
where
xi = the value of a data point
|xi − µ| = absolute deviation
µ = mean
n = sample size
Spread ChartThis script lets you chart a spread of a maximum of 3 tickers (one of them being the ticker in the main chart).
Y axis is the currency amount of the spread, that is calculated by this formula:
Y = PnL = quantity * price * handleValue
Y is calculated for each ticker specified, and the sum of Ys obtained is plotted.
this way it is possible to view the PnL of the spread directly.
It is necessary to specify the handle value (point value) in the script inputs (not for the main chart ticker).
A table summarizes the spread configuration, containing all inputs.

two_leg_spread_diffThis script helps you discern the relative change of each leg in a two-legged spread over a given period. The main plot is a difference in log return over the number of bars identified by the "lag" parameter. E.g. if "lag" is 10 and leg one has increased 3% over the past ten bars, while leg two has only increased 1%, the plot value is 2%. The main plot is also colored blue when leg one increases while leg two decreases on a given bar, and red if the opposite is true. This feature identifies periods where the correlation between the two legs diminishes. The one and two standard deviation of the main plot is also plotted in faint background lines. Additionally, a table indicates the percentage in which the main plot is within one standard deviation (acc 1) and two standard deviations (acc 2). Note that the standard deviation updates on each bar, so the current standard deviation is not the one used to calculate the accuracy. Rather, if there are N bars, N different standard deviation readings have been used to compute the accuracy statistics.
The inputs are:
- timeframe: the timeframe of the chart
- leg1_sym: the symbol of the first leg
- leg2_sym: the symbol of the second leg
- lag: the number of bars back to reference for computing the log return of each leg
- anchor_to_session_start: for intraday charts only, this overwrites the "lag" input so that the "lag" always sets the point of comparison to the session start. This setting is used to compute the relative change over a single session.

MYX Future Market Watchlist Generator█ OVERVIEW
This indicator listed all Future market in Malaysia and categorize them into Contract Month, Spread, Current Contract and Continuous Contract.
The indicator was developed to make user easier to make watchlist, suitable for beginners and experts in Malaysia Future Market.
This cover all Malaysia Future Markets as follows :
1. Commodity - FCPO, FPKO, FGLD, FTIN, FPOL and FUPO
2. Equity - FKLI and FM70
3. SSF - FCIM, FDRB, FGAM, FHAR, FINA, FMEG, FGEM, FGEN, FTEL and FTOP
4. Financial - FKB3, FMG3, FMG5 and FMGA
█ INSPIRATIONS
This indicator got inspirations from the previous indicators which I developed :
MYX Malaysia Bursa Futures Derivatives Auto Detect
FCPO Contract Month Table
█ CREDITS
I dedicated to known members in this industry especially who actively involved in Malaysia Future Market.
BURSATRENDBANDCHART
zhafrihandsome
XMODEUS
HAIDOJO_trading
datuksri
wrtech2020
FaizHebat
█ FEATURES
1. As mentioned in overview, main ability to categorize and export into watchlist.
2. Dark or light theme table including table position.
█ IMPORTANT NOTES
1. This indicator is one time usage only to generate watchlist through alert.
2. Use live chart to generate alert.
3. Set Alert Frequency to All.
4. Remove Alert once watchlist is done.
5. Usage method is similar to this video . (Sorry no audio provided)
█ EXAMPLE OF USAGE
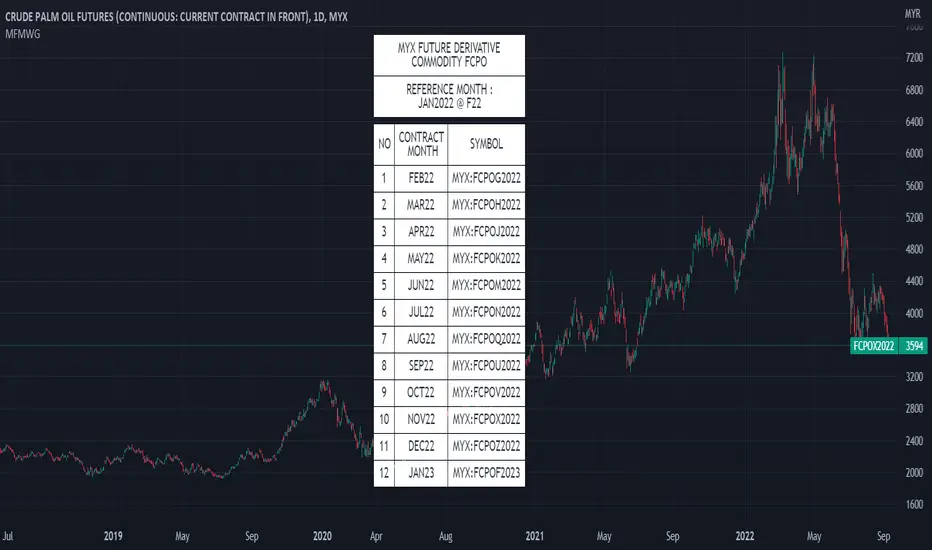
two_leg_spread_returns_zscoreThis script helps assess the relative returns of each leg in a two-legged spread. It shows the z-score of each period's returns, along with a moving average of the difference between the two returns. A negative moving average implies that the second leg is strengthening, on a relative return basis, against the first leg, and vice versa. The inputs are:
- timeframe: the timeframe for the calculations. the default is five minutes.
- leg1_sym: the symbol for the first leg
- leg2_sym: the symbol for the second leg
- ma_length: the length of the moving average. by default it is 48, or the previous four hours, given the default timeframe.
The default symbols are RB and HO, simply as an example of an intercommodity spread.

Range Gap/Open to Close/Close to CloseThis indicator shows the percentage variation of:
gap
close to close (day including gap)
open to close (without gap)
The green bars represent the days when the variation did not reach the selected range. The red bars show the days when the variation was higher than the selected range.
Best timeframe : DAY

10-Year Bond Yields (Interest Rate Differential)With this little script, I have attempted to incorporate fundamental data (in this case, 10-year bond yields) into technical analysis . When pairing two currencies, the one with a higher bond interest rate usually appreciates when the interest rate differential widens, or, to use a simple example: in a currency pair A vs. B, with A showing a higher bond yield than B, a widening interest rate gap is likely to help A and create a buying opportunity (shown as a blue square at the bottom of the chart), while the opposite is true when the gap tightens (sell signal, red square).
While long-term investors know about and make use of the importance of bond yield fluctuations, most short-term traders tend to dismiss the idea of using fundamental data, mostly for lack of quantifiability and limited impact in an intraday environment. After extensive backtesting on daily and intraday charts (6-12 hours), however, I realized this indicator still managed to produce useful results (less useful than on monthly and yearly charts, to be fair, but still useful enough), especially when paired with simple price-driven indicators, such as Heikin Ashi or linear regression .
My personal (and thus subjective) thoughts: worth a try. Buy and sell signals frequently contradicted both more popular indicators and my gut feeling and managed to take out losing trades that I had considered trades with a high winning probability. In other words, when the market lures traders into seemingly promising trading decisions, this indicator might give you an early warning, especially when you manage to adjust period and continuity parameters to your trading strategy.
Currency pairs used in this script are all possible combinations of the eight majors. Each security has been assigned a name ("inst01" to "inst08" in the code) and a broker; if you make changes to the code, be sure not to mess with currency and broker names as this would render the entire script useless. Good luck trading, and feel free to suggest improvements!
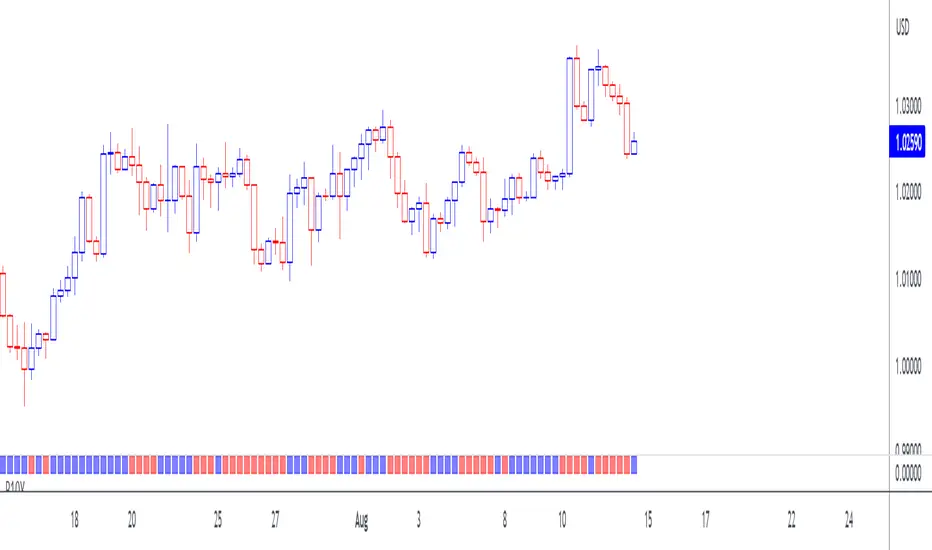
Future's spread with base contract (MOEX)English:
Indicator calculates spread between future and it's theoretical price baased on base contract, number of days to expiration and central bank key rate.
I didn't find any means of getting base contract of security on chart so I hardcoded futures and corresponding base contracts.
Hardcoded futures are MOEX (Moscow Exchange) only and key rate used in script is Russian Central Bank's key rate from 2013, but I believe you can easily adapt it to any other key rate history. I can share source code of tiny C++20 utility for easy generation of get_rate(time) function from more human-readable date format rather then UNIX timestamp used in PineScript.
Only quarterly futures are supported. Only in "SIU2022" like notation. "SI1!" like aliases are not supported.
Русский:
Индикатор отображает спред фьючерса к его теоретической цене с учётом усыхания на каждый день.
Не нашёл, как определить базовый актив фьючерса средствами TradingView - поэтому это соответствие захардкожено вручную.
Поддерживаются только квартальные фьючерсы, только MOEX, только хардкор.
Поддерживается история ключевой ставки ЦБ РФ с 2013 года.
Используйте коды фьючерсов вида "SIU2022".
Не поддерживаются альясы вроде "SI1!", "EU1!".
Historical US Bond Yield CurvePreface: I'm just the bartender serving today's freshly blended concoction; I'd like to send a massive THANK YOU to all the coders and PineWizards for the locally-sourced ingredients. I am simply a code editor, not a code author. Many thanks to these original authors!
Source 1 (Aug 8, 2019):
Source 2 (Aug 11, 2019):
About the Indicator: The term yield curve refers to the yields of U.S. treasury bills, notes, and bonds in order from shortest to longest maturity date. The yield curve describes the shapes of the term structures of interest rates and their respective terms to maturity in years. The slope of the yield curve tells us how the bond market expects short-term interest rates to move in the future based on bond traders' expectations about economic activity and inflation. The best use of the yield curve is to get a sense of the economy's direction rather than to try to make an exact prediction. This indicator plots the U.S. yield curve as maturity (x-axis/time) vs yield (y-axis/price) in addition to historical yield curves and advanced data tickers . The visual array of historical yield curves helps investors visualize shifts in the yield curve that are useful when identifying & forecasting economic conditions. The bond market can help predict the direction of the economy which can be useful in crafting your investment strategy. An inverted 10y/2y yield curve for durations longer than 5 consecutive trading days signals an almost certain recession on the horizon. An inversion happens when short-term bonds pay better than longer-term bonds. There is Federal Reserve Board data that suggests the 10y3m may be a better predictor of recessions.
Features: Advanced dual data ticker that performs curve & important spread analysis, plus additional hover info. Advanced yield curve data labels with additional hover info. Customizable historical curves and color theme.
‼ IMPORTANT: Hover over labels/tables for advanced information. Chart asset and timeframe may affect the yield curve results; I have found consistently accurate results using BINANCE:BTCUSDT on 1d timeframe. Historical curve lookbacks will have an effect on whether the curve analysis says the curve is bull/bear steepening/flattening, so please use appropriate lookbacks.
⚠ DISCLAIMER: Not financial advice. Not a trading system. DYOR. I am not affiliated with the original authors, TradingView, Binance, or the Federal Reserve Board.
About the Editor: I am a former FINRA Registered Representative, inventor/patent holder, futures trader, and hobby PineScripter.

Volume Spread for VSA CustomHey everyone, I have been using volume a lot more lately as price action can sometimes get manipulated but volume shows us the truth!
Anyways, I have enjoyed the Volume Spread for VSA indicator but wished I had the code to change a few settings. This volume indicator includes spread analysis with the ability to customize input values and I'm making it open source so you can do with it as you please.
I have made notes all throughout the code to give suggestions on a few changes or why I have written it in such a way. I have also tried to section everything off to make it easier to see where each piece of the code is used. Overall I think it is a good example of how to code cleanly and how to add useful notes when you are learning Pine for yourself :D
The indicator on the price chart is my Donchian Channel indicator, which you can also find on my profile. This is the one I use every day.
Binance Futures Swap-Spot Basis LabelNote: This script will only work with Binance Futures Symbols
This script calculates the basis between the Binance Future and Binance Spot market for the coin you are currently viewing and paints a label on the chart which displays the percentage difference between future and spot. If the future is trading below the spot market the text will be red indicating backwardation and if the future is trading above spot, it will be green indicating contango. Please note this script will only work on Binance perps against Binance spot. The script will change based on what perp you are looking at, no inputs are required.

US Yeild Spread, 10Y-3M RED, 10Y-2Y GREEN, 2Y-3M AQUAUS Yeild Spread
Red line, 10Y-3M spread
Green line, 10Y-2Y spread
Aqua line, 2Y-3M spread
Red zone, Negative spread between long and short term yeilds.