VIX Strategy : Risk-ON, Risk-OFF
VRatio is the ratio of VIX3M and VIX. This ratio rises above 1.1; in a bear market, it decreases and goes below 1. VRatio=VIX3M/VIX. More details in Part 2.
VRatio > 1: Risk-On signal
Contango is the ratio of VX2 (first back-month contract) and VX1 (front-month contract) minus one. In a bull market, this indicator rises above 5%’ in a downtrend market, this indicator goes below -5%. More details in Part 2.
Contango > -5%: Risk-On signal
Contango Roll is the ratio of VX2 first back-month contract) and the VIX minus one. In a bull market, this indicator rises above 10%’ in a downtrend market, this indicator goes below -10%. More details in Part 2.
Contango Roll > 10%: Risk-On signal
Volatility Risk Premium (VRP) compares the implied volatility to the recent realized volatility; it attempts to quantify how much “extra” premium (in volatility term) S&P500 option sellers are charging investors for the protection of their portfolio. It can be seen as an insurance premium. A simple way to compute the VRP is VRP= VIX -HV10 where HV10 is the 10-day historical volatility of S&P500. Some people also look at the 5-day moving average of the VRP to smooth this indicator.
VRP > 0: Risk-On signal
Fast Volatility Risk Premium (FVRP) is a variant of the VRP. FVRP=EMA(VIX,7)-HV5 where HV5 the 5-day historical volatility of S&P500.
FVRP > 0: Risk-On signal
Volatility Momentum compares today’s VIX to last 50 days. It has, therefore, quite a bit of lag but it is a useful measure when combined with other indicators. Volatility Momentum=SMA(VIX,50) -VIX.
Volatility Momentum > 0: Risk-On signal
VIX Mean Reversion looks at today’s VIX compared to certain thresholds. We avoid investing in the S&P500 when the VIX is too high (above 20) or too low (below 12).
VIX Mean Reversion > 12 and VIX Mean Reversion < 20: Risk-On signal
VIX3M Mean Reversion works the same way as VIX Mean Reversion.
VIX3M Mean Reversion > 12 and VIX3M Mean Reversion < 20: Risk-On signal
S&P 500 (SPX500)

S&P 500 Earnings Yield SpreadThis indicator compares the attractiveness of equities relative to the risk-free rate of return, by comparing the earnings yields of S&P 500 companies to the 10Y treasury yields. "Earnings yield" refers to the net income attributable to shareholders divided by the stock's price - effectively the inverse of the PE ratio. The tangible meaning of this metric is "the annual income received by (attributable to) shareholders as a percent of the price paid to receive said income." Therefore, earnings yield is comparable to bond yields, which are "the annual income received by bond holders as a percent of the price paid to receive said income."
This indicator subtracts the earnings yield of S&P 500 companies from the current 10-year treasury bond yield, creating a "spread" between the yields that determines whether equities are currently an attractive investment relative to bonds. That is, if the S&P 500 earnings yield exceeds the 10Y treasury yield, then equity investors are receiving more attributable income per dollar paid than bondholders, which could be an indication that equities are an attractive purchase relative to the risk-free rate. The same applies vice-versa; if the 10Y treasury yield exceeds that of the S&P 500 earnings yield, then equities may not be an attractive investment relative to the risk-free rate.
Since data on S&P 500 companies' earnings yields are pulled on a monthly basis, this indicator should be used on a monthly timeframe or longer. Historical data has shown that the critical zones for the indicator are at -4% and +3%, i.e. when equities are trading with a 4% greater yield than 10Y T-bonds and when equities are trading with a 3% lower yield than 10Y T-bonds, respectively. In the "Oversold" case (-4%), equities are trading at a steep discount to the risk-free rate and has often represented a strong buying opportunity. In the "Overbought" case (+3%), equities are trading at a premium to the risk-free rate, which may be an indication that caution should be exercised within the stock market. When the indicator first crosses into "Oversold" territory, this has historically been near a the bottom of a crash on the S&P 500. When the indicator first crosses into the "Overbought" territory, this has often precipitated a correction of 15% on the S&P 500.
Some notable "misses," crashes that this indicator missed, include the 1973 stock market crash and the 2008 global recession. However, both of these cases were largely precipitated by unprecedented economic events, as opposed to stocks simply being "Overbought" relative to treasury yields. Nonetheless, this indicator should form only a small portion of your fundamental analysis, as there are many macroeconomic factors that could lead to major corrections besides the impact of treasury yields. Furthermore, it should also be noted that since markets are "forward looking," future earnings growth or interest rate hikes may become "priced into" both the stock and bond markets, affecting the outputs of this indicator. However, since both the stock and bond markets should account for these factors simultaneously, the impact has historically been minimized.
I hope you find this indicator to be beneficial to your strategies. Stay safe, and happy trading.

DIX Short Sale VolumeThis indicator combines all the short sale volumes from NASDAQ, NYSE and BATS exchanges and calculates Short Vol % to Total Volume across these 3 exchanges. Use it on Daily Timeframe as shown in the above chart.
For more information on Short Sale Volumes refer to www.finra.org
Usage
When short sale volume data is rising rapidly, it indicates bullishness in the underlying as market makers do not have the shares to sell which results in short sale
When a stock gets dumped by institutions, short sale %age is normally very low and trend is downwards

Commitment of Traders ~ INDEXESMy intention was to create 1 script for the Commitment of Traders report but I wasn't not aware there is a limit on how many instrument calls can be made in PineScript so I had no choice but to divide the script into instrument categories. So far I have created 4 of them: Forex, Metals/ Commodities, Treasuries & Indexes which is the one presented here. If you are interested in the other ones, feel free to do a search.
Available Instruments: Mini S&P, VIX, Mini NASDAQ, Mini RUSSELL, EAFE Index (Global Developed Markets & EMRG Index (Global Emerging Markets)
The script calculates and plots the ZScore of both Net Long (Money Managers / Asset Managers) and Net Long (Dealers / Swap). In some instrument categories you will also see Open Interest. It depends on whether I was maxed out or not on making security calls.
If you are not familiar with ZScore, it basically calculates the distance of price from a mean average in units of Standard Deviation. In theory when price reaches +2 it signifies overbought while if it reaches -2 is oversold. However just because it's hitting an extreme in one particular average doesn't necessarily mean it will reverse as the position of price in relation with the next longer average might not be so out of range.
Must be attached to weekly chart.
If you have any questions/suggestions, feel free to add them in the comments below

Market Breadth EMAs V2Second version of Market Breadth EMAs for $SPY. Getting a little more complicated than V1 but removed noise.
Key:
Green line = % of stocks above their 20-period moving average, the "twitch line"
Red line = % of stocks above their 200-period moving average, the "long term trend"
White line = weighted average of the % of stocks above the 20/50/100/200 averages, the "general trend." Captures bursts that the 200 misses, and is more trustworthy than the 20.
Background colors = limits of the red/green/white where reversals have happened historically. The darker the color, the stronger the signal.
Histogram = the change in the white line over time, for different time periods: 1/4/10/20, the "trend strength/confidence." i.e. If the white line "General Trend" has been drifting lower for a month but started increasing the past 2 days, you might have 3 red histograms and 1 green one.
Techniques:
If the green, red, or white line is above 50%, then more than half the stocks are above that average. So, if they're in the top half, bullish market. Bottom half, bearish market.
If the green line is above the red, market has rising/bullish momentum. If red is above green, market has falling/bearish momentum.
If the white line is rising, bullish momentum. If it's falling, bearish momentum.
If the histograms are all green, there is strong momentum in that direction. The % of stocks above their important averages has been increasing each day for both the short term and long term.
If the histograms go from all green to a mix of green and red, be on the lookout for a reversal from one of the background levels. Usually initiates from the 20 (green line) first.
If price dips without the histogram changing, HODL.

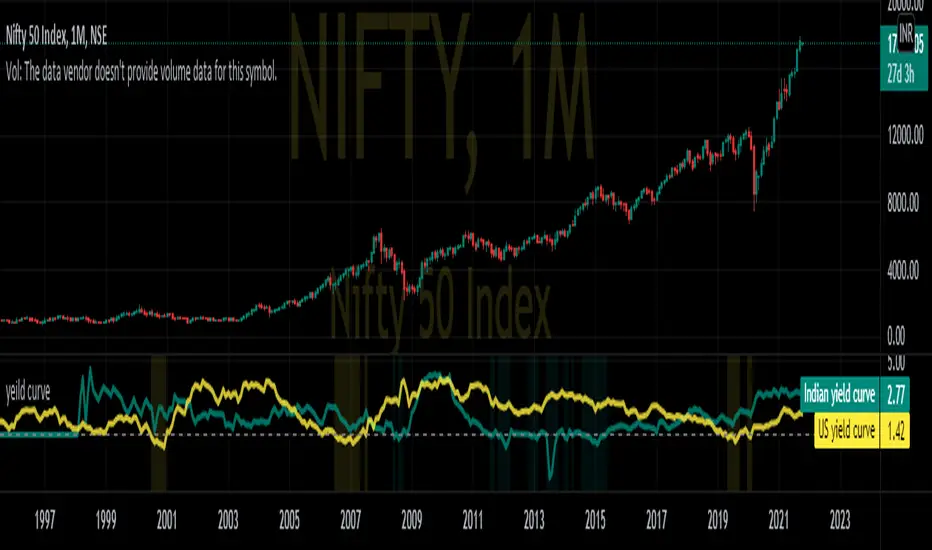
Nifty yield curveREAL-CASE SCENARIO:-
IN10Y(10yr yield t- bill) are govt. backed bonds provide basic interest or coupon rate. If the coupon rate falls below (yield =(1/price) the coupon rates of 3 month bond IN03MY(3m yield t- bill), investors are pessimistic about future growth of the economy.
This pessimistic behavior can be seen in the graph when change in background color.
While optimistic behavior scenario when investors no longer interested in long-term bonds and dumping 10Y T-bills causing yields to raise above short term 3m T-bill .
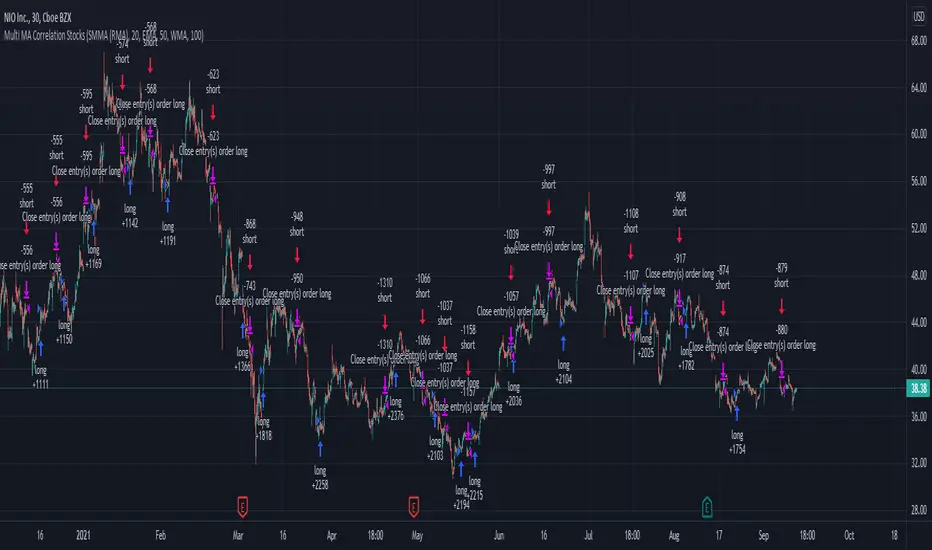
Swing Stock Market Multi MA Correlation This is a swing strategy adapted to stock market using correlation with either SP500 or Nasdaq, so its best to trade stocks from this region.
Its components are
Correlation Candle
Fast moving average to choose from SMA , EMA , SMMA (RMA), WMA and VWMA
Medium moving Average to choose from SMA , EMA , SMMA (RMA), WMA and VWMA
Slow moving average to choose from SMA , EMA , SMMA (RMA), WMA and VWMA
Rules for entry
Long: fast ma > medium ma and medium ma > slow ma
Short: fast ma< medium ma and medium ma < slow ma.
Rules for exit
We exit when we receive an inverse condition.
Caution:
This strategy use no risk management inside, so be careful with it .
If you have any questions, let me know !
Arms Index TRIN [DM]Hello colleagues""
Here I share today Arms Index!!!
-Avalilables settings and options:
- Switcheable Index NASDAQ and S&P
- Switcheable Alerts "crossover, crossunder, change and main ones"
-Fill Color Customizables
-Signal Color Customizables
-Signal Smooth Customizable
Enjoy!!!
Arms Index (TRIN)
The Arms Index (TRIN) is a market breadth oscillator that was developed by Richard Arms. It is also known as the Trading Index, hence the abbreviation TRIN. It relates advancing and declining stocks to their respective volume flows by dividing the Advance/Decline Ratio by the volume ratio. When it rises the market is said to be weak and vice versa. The value 1 is key and crossing it generates a signal. A value above 1 indicates declining stocks have the upperhand in the volume flow and vice versa. The indicator can be used to spot overbought and oversold situations and is best used in combination with other analysis techniques.

Trend System Oscillator Averages RatingThis is a trend system made with multiple oscillator averages designed especially for trending markets such as stocks or crypto.
It can be used with any timeframe.
Its made of multiple moving oscillators such as
RSI
Stochastic
ADX
CCI
AO
MACD
MOM
STOCH RSI
WPR
BP
UO
Avg of all oscillators
It has also a rating, making an avg from all of the oscillators , going from -100 (all ma's are telling to go short ) to 100 ( all ma are telling to go long).
If you have any questions let me know !

Improved Bollinger Swing Strategy Stock NasdaqThis is an improved bollinger band strategy adapted to Nasdaq Index/Stocks.
The new update include a multiple logic calculation BB adapted for long and short, together with a risk management using movement in %.
Rules for entry
For long we have a crossover between the close and the lower band from the bb
For long we have a crossover between the close and the upper band from the bb
Rules for exit
We exit when we either find a reverse condition, or if we hit the take profit/stop loss levels.
If you have any questions, let me know !

Ticker Dashboard For Better Stock SelectionHey, this indicator will help you with your stock selection. The goal is to focus on stocks that move (higher ADR) and provide enough liquidity which means less risk.
ADR - Average Daily Range in % (measured from High to Low - does not include gaps like ATR does / Threshold color can be adjusted from input)
%Change - Current % change from prior close price
Vol- Todays Volume in MIO
ADV- Average Daily Volume in MIO - default set to 1 month (20 days, can be changed from input - Colored red if < 1 MIO)
$VOL- Dollar Volume - Average Daily Volume multiplied with the last daily close price. Important for liquidity issues.
Stock trending strategy This is a long only strategy designed maily for stock markets and futures. In general it works best with 1h, however it can be optimized with other timeframes as well.
Components:
VWAP
MACD histogram
EMA 9
Rules for entry
Long :
For VWAP: close is above the vwap daily
EMA: close is above the moving average
MACD histogram is above 0
Short:
For VWAP: close is belowthe vwap daily
EMA: close is below the moving average
MACD histogram is below 0
Rules for exit
This strategy does not have any risk management inside. Instead it exits whenver it receives an opposite signal form the original one used for entry.
If you have any questions let me know !

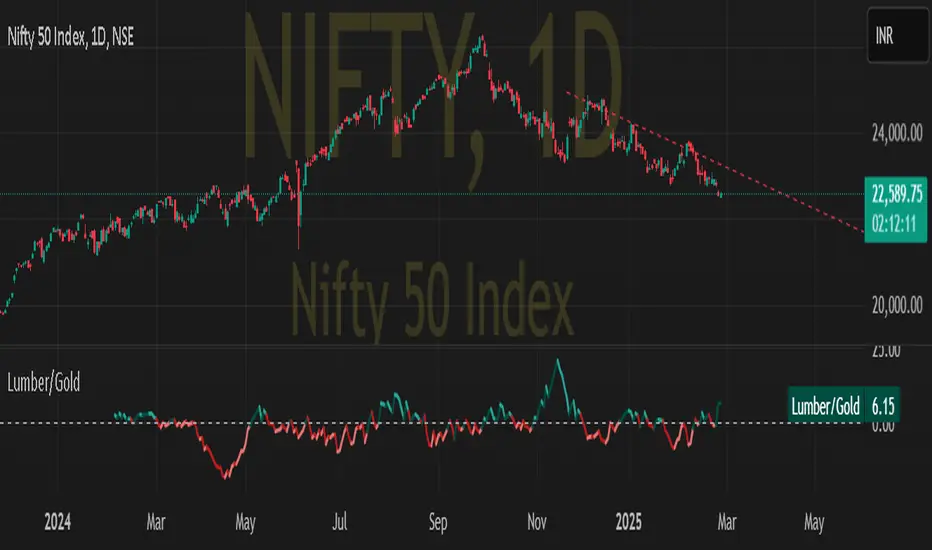
Lumber to Gold ratioDISCRIPTION:-
Lumber to gold ratio helps to predict up upcomming market correction as investors are flocking towards safe heaven.
USE CASE SCENARIO:-
If the ratio is above the zero horizontal line it is a risk of scenario
If the ratio plunge below zero it might show imminent market correction.
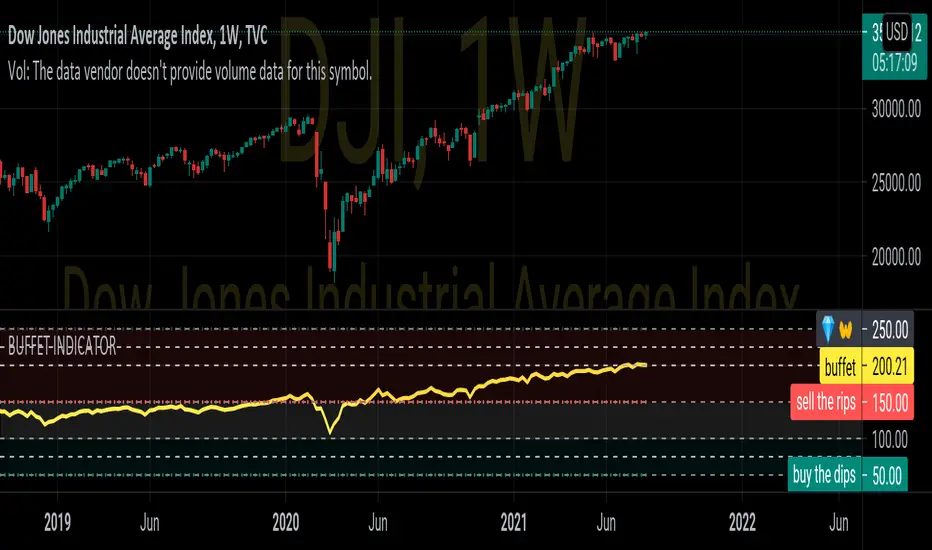
BUFFET INDICATORDISCRIPTION
The stock market cap to GDP ratio has become known as the Buffett Indicator in recent years, as Warren Buffett commented that he believes it is “probably the best single measure of where valuations stand at any given moment.”
CALCULATION
100*VALUE OF ALL STOCKS IN COUNTRY/GDP OF COUNTRY
100*wilshire5000/gdp
SMART4TRADER-INDEX PATTERN BREAKOUT MULTIThis indicator is designed to analyze the breakdown of previous values of the candles, not only on the selected tool, but also on others. The indicator is well used on the indices of the stock market. In the default indicator, recommended indexes are configured.
The indicator summarizes the results of the analysis of all tools and shows in the form of columns that are above and \ or below the zero line. Additionally, the indicator has two horizontal lines above zero (green) and two horizontal lines below zero (red). The breakdown of these nearest to zero lines signals the possible beginning of the move towards which the column is directed. If the column reached the left line, this means that a very strong trend is noticeable on all the tools selected in the settings.
Additionally, the indicator has a blue line that shows the average value of the columns both above and below the zero line. And also added Hull Moving Average Period (9).
BUY signal:
HIGH > HIGH(1) и LOW > LOW(1)
SELL signal:
HIGH < HIGH(1) и LOW < LOW(1) и LOW < LOW(2)
--------------------------------------------------------
Этот индикатор предназначен для анализа пробития предыдущих значений свечей, не только на выбранном инструменте, но и на других. Индикатор хорошо использовать на индексах фондового рынка. В индикаторе по умолчанию настроены рекомендуемые индексы для анализа.
Индикатор суммирует результаты анализа всех инструментов и показывает в виде столбиков, которые находиться выше и\или ниже нулевой линии. Дополнительно на индикаторе есть две горизонтальные линии выше нуля (зеленый) и две горизонтальные линии ниже нуля (красный). Пробитие этих ближайших к нулю линий сигнализирует о возможном начале движения в сторону, в которую направлен столбик. Если столбик достиг крайней линии, то это значит, что очень сильный тренд заметен на всех инструментах выбранных в настройках.
Дополнительно в индикаторе есть синяя линия, которая показывает среднее значение столбиков как выше, так и ниже нулевой линии. А также добавлена HULL MOVING AVERAGE период (9).
Сигнал на покупку:
HIGH > HIGH(1) и LOW > LOW(1)
Сигнал на продажу:
HIGH < HIGH(1) и LOW < LOW(1) и LOW < LOW(2)

Compare Price Momentum Oscillator [CC]The Compare Price Momentum Oscillator was created by Vitali Apirine (Stocks and Commodities Aug 2020 pg 16) and this is a handy indicator to compare the momentum of the current symbol you are looking at to the s&p to determine the relative strength of the underlying security. Buy when the line turns green and sell when it turns red.
Let me know if there are any other scripts you would like to see me publish!
Momentum Rotation Indicator [CC]I have developed this custom indicator very loosely based on the Sector Rotation Model (Giorgos E. Siligardos. Technical Analysis of Stocks & Commodities, August 2012) and I called it the MRI because this is essentially a brain scan of any particular stock. This will not only tell you when a stock is breaking out over the market at large but also how the stock is doing compared to its own history. Buy when the line turns green and sell when the line turns red.
Let me know if there are any other indicators you would like to see me publish!
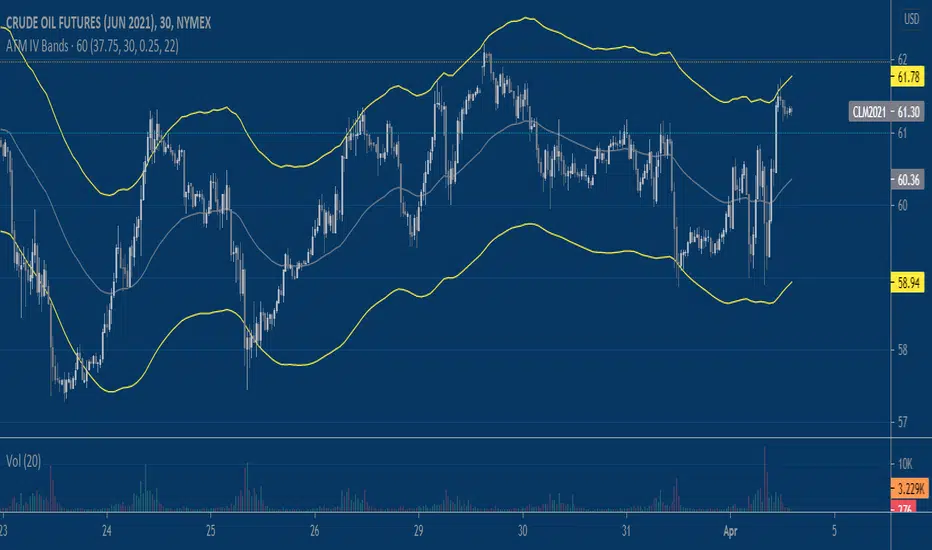
Implied Volatility BandsThis script produces price bands around an EMA based on a manually inputted Implied Volatility. The idea builds on my previous "Implied Move" script which helps visualize the distribution of prices that the market is 'pricing in' via options/implied volatility. It's up to the user to determine the implied volatility level they use, I like using the free version of QuikStrike that you can access via the CME Group website and then update the script's input daily. Another way to use the script is to input the implied volatility based on a forecast that you produce independently. Say implied volatility on June 2021 Crude Oil is 30% and you think it's rich by 2%, you can input 28% into the script to tweak the bands for a declining vol regime.
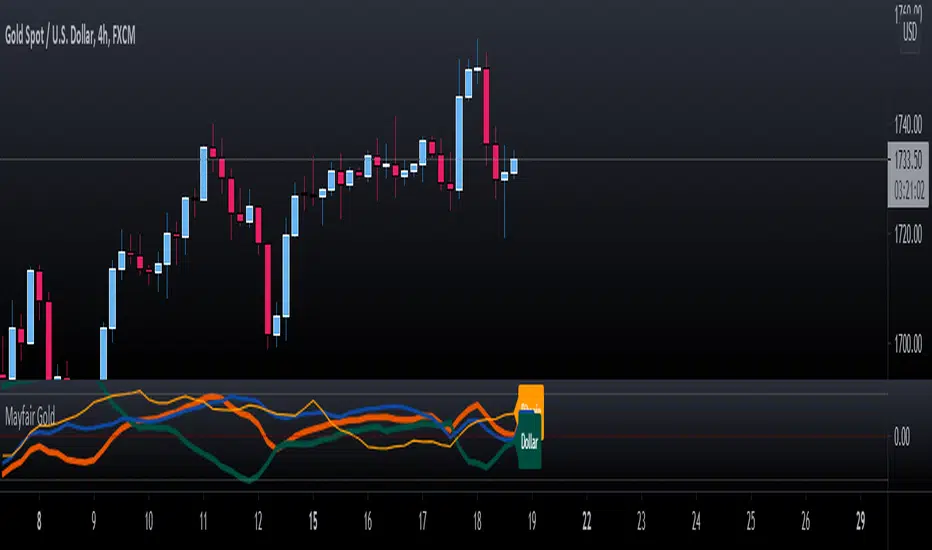
Mayfair GoldGold Oscillator using SPX & DXY to measure the moving average cross of the 3.
Gold in Orange
DXY in Green
SPX in Blue
To use this indicator, you need to see the strength (Orange above the 50%) line, use your own configurations and settings for the two MA's as a cross.
The idea is not to enter trades but to know when either SPX or/and DXY is getting stronger or weaker to help with profit-taking of gold positions.
As per any Oscillator - look for patterns, cross-overs and momentum shifts. (Treat like a MACD, RSI or Stochastic).
V2_Major_Trend_FinderThis script is a major trend following script. The calculations use Keltner Channels, moving averages and RSI.
The indicator is simple to follow:
Green Candlesticks indicate more bullish momentum expected
Red Candlesticks indicate more bearish momentum expected
blue dots are possible long ideas due to RSI oversold
Orange dots are possible short ideas due to RSI overbought
olive line is a one year moving average
The script is open for those looking for deeper understanding of the script.
Many Regards
Sulaiman

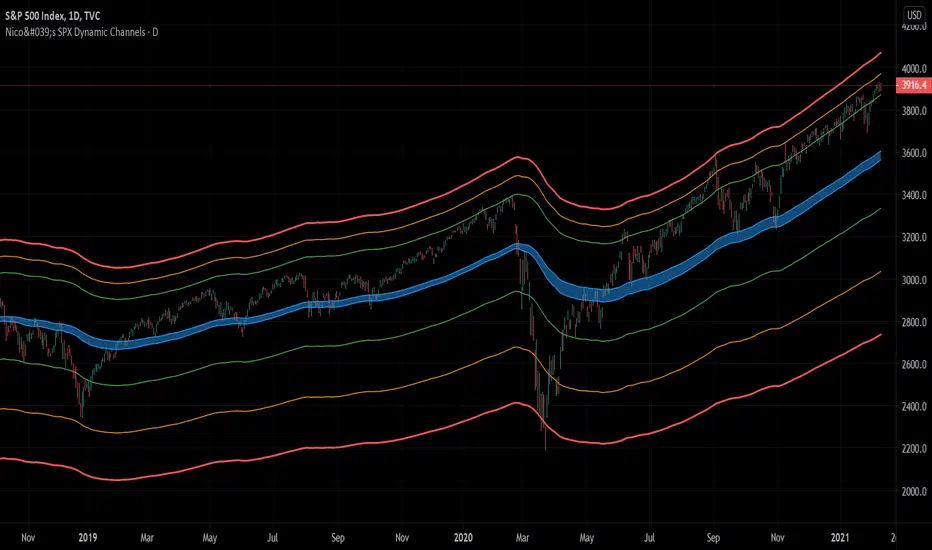
Nico's SPX Dynamic ChannelsTest of dynamic channels and some statistics made by hand.
This indicator was done specifically for the S&P500 index.
As you can see, below the 125 EMA there's a lot more volatility than in the upside. I've made some kind of a dynamic linear regression of the lows and the highs.
I've chosen the MA that best fits the SPX, and then calculated in Excel the percental mean and SDs of most important peaks and valleys that I've chosen in comparison to the 125 MA. This lead to the green, orange and red zones. BUT, I've calculated the peaks and valleys separately, as I assumed that a bear market and crashes have way more volatility than bull markets. That's why the difference between the upper and the lower channels.
The neutral blue zone is composed by an upper EMA of the highs and lower EMA of the lows. No MA in this script uses the close price as a source.
This MA makes sense because it represents a semester of trading, for this particular asset.
Backtest results
It's also interesting to try it here too, as it has a little bit more of data:
SPCFD:SPX
As it's not a trading system, I have no batting average nor ratios for this.
Still, the measures of the peaks and valleys are very accurate and repeat themselves over and over again. The results were:
3rd resistance: 12.88%
2nd resistance: 10.12%
1st resistance: 7.36%
1st support: -6.42%
2nd support: -14.8%
3rd support: -23.18%
All referred to the mean, which is the 125 EMA zone.
After the 1950's works like magic, but not before. You will see that it doesn't work in the great depression and it's crash.
How to use this indicator
Green = First grade support/resistance .
Orange = Second grade support/resistance . Caution.
Red = Third grade support/resistance . High chances of mean reversal.
Blue zone = This is the neutral zone, where the prices are not cheap nor expensive.
Often in a trending market, the price will have the blue zone as it's main support and when trending the price will stick to the green MA.
When the price touches the orange MA, the most probable is that it will return to the green MA.
If the price touches the red zone, there's a high chance that this is a big turning point and it will reverse to the mean (green or blue zone).
Imagine you've bought each time the price touched the red support, check that and you'll start liking this indicator. I think it is a great entry point for investors. The red resistance is good too, but of course it works for a short period of time.
I've backtested this indicator since the beginning of the dataset and it works like magic, but ONLY for the SPX index (spot price).
Leave a comment or some coins if you like it!!!
(I've posted it before like an analysis, not as a script, my bad)
Yield CurveThis script tracks the U.S. 2Yr/10Yr Spread and uses inversions of the curve to predict recessions. Whenever a red arrow appear on the yield curve, expect a recession to begin within the next 2 years. Use this signal to either exit the market, or hedge current positions. Whenever a green arrow appears on the yield curve, expect a recession to have nearly ended. Use this signal to enter the market, or cut current hedges against a recession. (I may update this script in the future to better incorporate the effective federal funds rate into exit points, but for now I am satisfied with the results).

Equity Index Extended HoursHighlights the extended hours/Globex session for US Equity Index Futures.
