Squeeze Momentum Indicator Strategy [LazyBear + PineIndicators]The Squeeze Momentum Indicator Strategy (SQZMOM_LB Strategy) is an automated trading strategy based on the Squeeze Momentum Indicator developed by LazyBear, which itself is a modification of John Carter's "TTM Squeeze" concept from his book Mastering the Trade (Chapter 11). This strategy is designed to identify low-volatility phases in the market, which often precede explosive price movements, and to enter trades in the direction of the prevailing momentum.
Concept & Indicator Breakdown
The strategy employs a combination of Bollinger Bands (BB) and Keltner Channels (KC) to detect market squeezes:
Squeeze Condition:
When Bollinger Bands are inside the Keltner Channels (Black Crosses), volatility is low, signaling a potential upcoming price breakout.
When Bollinger Bands move outside Keltner Channels (Gray Crosses), the squeeze is released, indicating an expansion in volatility.
Momentum Calculation:
A linear regression-based momentum value is used instead of traditional momentum indicators.
The momentum histogram is color-coded to show strength and direction:
Lime/Green: Increasing bullish momentum
Red/Maroon: Increasing bearish momentum
Signal Colors:
Black: Market is in a squeeze (low volatility).
Gray: Squeeze is released, and volatility is expanding.
Blue: No squeeze condition is present.
Strategy Logic
The script uses historical volatility conditions and momentum trends to generate buy/sell signals and manage positions.
1. Entry Conditions
Long Position (Buy)
The squeeze just released (Gray Cross after Black Cross).
The momentum value is increasing and positive.
The momentum is at a local low compared to the past 100 bars.
The price is above the 100-period EMA.
The closing price is higher than the previous close.
Short Position (Sell)
The squeeze just released (Gray Cross after Black Cross).
The momentum value is decreasing and negative.
The momentum is at a local high compared to the past 100 bars.
The price is below the 100-period EMA.
The closing price is lower than the previous close.
2. Exit Conditions
Long Exit:
The momentum value starts decreasing (momentum lower than previous bar).
Short Exit:
The momentum value starts increasing (momentum higher than previous bar).
Position Sizing
Position size is dynamically adjusted based on 8% of strategy equity, divided by the current closing price, ensuring risk-adjusted trade sizes.
How to Use This Strategy
Apply on Suitable Markets:
Best for stocks, indices, and forex pairs with momentum-driven price action.
Works on multiple timeframes but is most effective on higher timeframes (1H, 4H, Daily).
Confirm Entries with Additional Indicators:
The author recommends ADX or WaveTrend to refine entries and avoid false signals.
Risk Management:
Since the strategy dynamically sizes positions, it's advised to use stop-losses or risk-based exits to avoid excessive drawdowns.
Final Thoughts
The Squeeze Momentum Indicator Strategy provides a systematic approach to trading volatility expansions, leveraging the classic TTM Squeeze principles with a unique linear regression-based momentum calculation. Originally inspired by John Carter’s method, LazyBear's version and this strategy offer a refined, adaptable tool for traders looking to capitalize on market momentum shifts.
Squeeze

Squeeze Momentum Strategy [LazyBear] Buy Sell TP SL Alerts-Modified version of Squeeze Momentum Indicator by @LazyBear.
-Converted to version 5,
-Taken inspiration from @KivancOzbilgic for its buy sell calculations,
-Used @Bunghole strategy template with Take Profit, Stop Loss and Enable/Disable Toggles
-Added Custom Date Backtesting Module
------------------------------------------------------------------------------------------------------------------------
All credit goes to above
Problem with original version:
The original Squeeze Momentum Strategy did not have buy sell signals and there was alot of confusion as to when to enter and exit.
There was no proper strategy that would allow backtesting on which further analysis could be carried out.
There are 3 aspects this strategy:
1 ) Strategy Logic (easily toggleable from the dropdown menu from strategy settings)
- LazyBear (I have made this simple by using Kivanc technique of Momentums Moving Average Crossover, BUY when MA cross above signal line, SELL when crossdown signal line)
- Zero Crossover Line (BUY signal when crossover zero line, and SELL crossdown zero line)
2) Long Short TP and SL
- In strategies there is usually only 1 SL and 1 TP, and it is assumed that if a 2% SL giving a good profit %, then it would be best for both long and short. However this is not the case for many. Many markets/pairs, go down with much more speed then they go up with. Hence once we have a profitable backtesting setting, then we should start optimizing Long and Short SL's seperately. Once that is done, we should start optimizing for Long and Short TP's separately, starting with Longs first in both cases.
3) Enable and Disable Toggles of Long and Short Trades
- Many markets dont allow short trades, or are not suitable for short trades. In this case it would be much more feasible to disable "Short" Trading and see results of Long Only as a built in graphic view of backtestor provides a more easy to understand data feed as compared to the performance summary in which you have to review long and short profitability separately.
4) Custom Data Backtesting
- One of most crucial aspects while optimizing for backtesting is to check a strategies performance on uptrends, downtrend and sideways markets seperately as to understand the weak points of strategy.
- Once you enable custom date backtesting, you will see lines on the chart which can be dragged left right based on where you want to start and end the backtesting from and to.
Note:
- Not a financial advise
- Open to feedback, questions, improvements, errors etc.
- More info on how the squeeze momentum works visit LazyBear indicator link:
Happy Trading!
Cheers
M Tahreem Alam @mtahreemalam

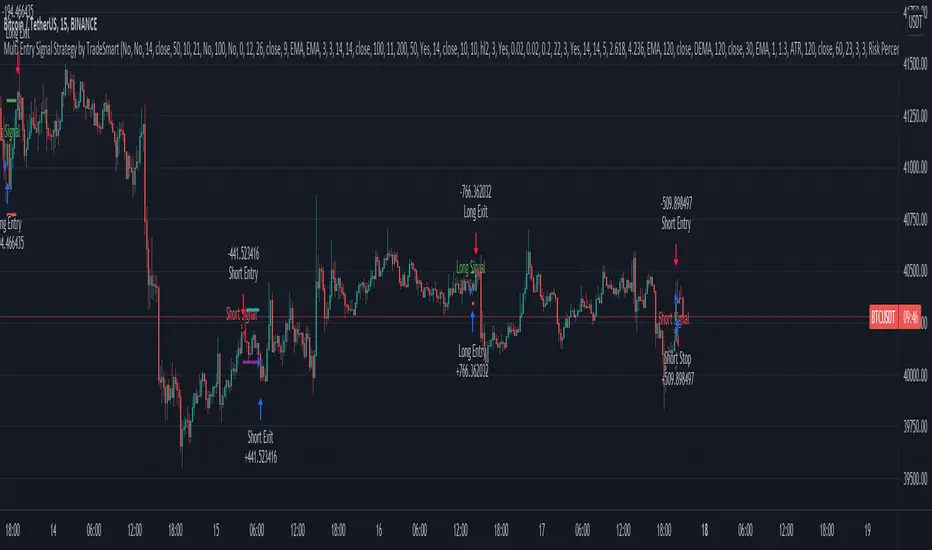
Multi Entry Signal Strategy by TradeSmartThis strategy is intended to test different entry signals. You can use 13 different entry signals in the strategy.
Available signals with all their settings:
Heikin Ashi
RSI + EMA
Wavetrend
MACD
Stochastic RSI
Squeeze Momentum
Kairi Relative Index
SSL
Supertrend
Parabolic SAR
Chandelier Exit
Directional Movement Index
Quantitative Qualitative Estimation
For exact rules of entries please relate to the tooltips of each entry signal. All the signals can be used together or separately in the strategy.
Additional settings that can be used:
Trend Filter (limit long or short entries based on a moving average of your choice)
Exit Strategy settings (ATR is used to determine stop loss and take profit levels)
Trailing Loss Setups (you can use 3 different types of trailing losses)
Setups (you can set Long and Short entries as well as the order size based on either Capital % or Risk %)
Date Range (you can limit trades to specific date ranges)
Trading Time (you can limit on which days to trade)
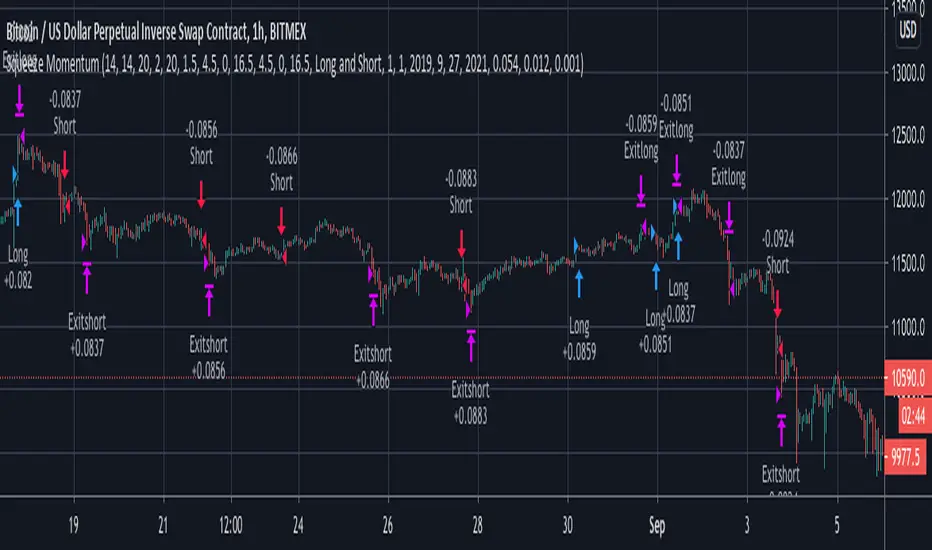
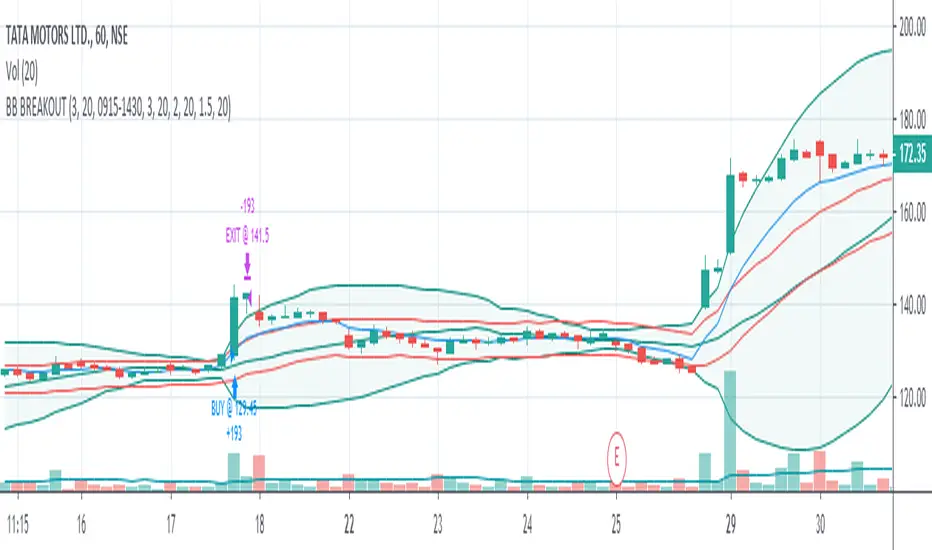
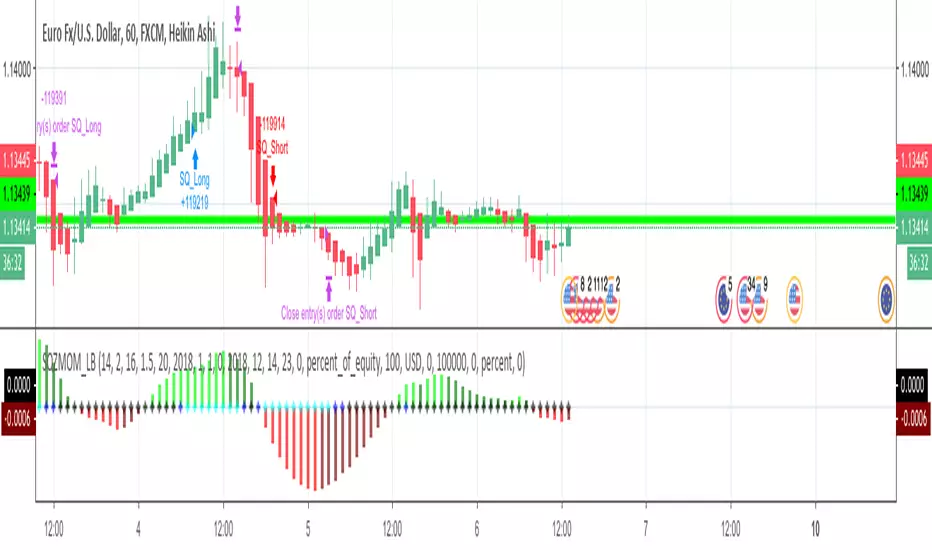
TopTenAlgo 10. SQZMOM Algorithmic Strategy with Alerts & SignalsEN: This Algorithm is a derivative of John Carter's "TTM Squeeze" volatility indicator. Many strategists have taken the indicator on Tradingview with simple moving averages and have looked at the biggest mistake only by dealing with squeeze and exit processes to squeeze. But I used the algorithm to determine where the markets would actually explode. For example, instead of using SMAs , I tested them on the Linear Regression Curve using Volume Weighted Moving Averages and Hull MAs. This gave me the opportunity to develop a more responsive algorithm and identify where the actual explosion would occur. The Gray Circles in the midline show that the market is entering a new jam (in the Bollinger Bands and Keltner Channel). This means low volatility , the market prepares itself for an explosive move (up or down). White Circles mean that it is about to get out of the jam. The Blue Circles, which no one can calculate, now inform that the exit is no longer jammed and that the explosion has taken place.
Mr. Carter recommends that you wait until the first gray after a gray cross and take a position in the momentum direction (for example, if the momentum value is above zero, relax). Exit position when the momentum changes (increase or decrease, this is indicated by a color change). In this algorithm, I tried to achieve good entry points using an additional indicator such as ADX and WaveTrend. To draw the histogram, I used a different method based on Linear Regression . Mr.Carter uses a simple momentum indicator. Strategy, alarms and signals have been added to the indicator so that you can optimize in algorithmic trading.
In summary, this algorithm is a strict algorithm in which additional 4-5 indicators are blended. Conveniences for Everyone ...
TR: Bu Algoritma John Carter'ın "TTM Squeeze" volatilite göstergesinin bir türevidir. Bir çok stratejist Tradingview' de gösterge' yi basit hareketli ortalamalarla ele almış ve en büyük hatayı sadece sıkışma ve sıkışmadan çıkış süreçlerini ele alarak bakmışlardır. Fakat ben algoritmayı piyasaların asıl patlama yapacağı yeri tespit etmek için kullandım. Örneğin SMA' ları kullanmak yerine Hacim Ağırlıklı Hareketli Ortalamaları ve Hull MA' ları kullanarak onları Linerar Regresyon Eğrisinde stress testine tabi tuttum. Buda bana daha duyarlı bir algoritma geliştirmem ve asıl patlamanın olacağı yerleri tespit etmem için fırsat verdi. Orta hattaki Gri Daireler, piyasanın yeni bir sıkışmaya girdiğini gösteriyor ( Bollinger Bantları ve Keltner Kanalı'nda). Bu, düşük volatilite anlamına gelir, piyasa kendisini patlayıcı bir harekete hazırlar (yukarı veya aşağı). Beyaz Daireler ise sıkışmadan çıkmak üzere olduğu anlamına gelir. Hiç kimsenin hesap edemediği Mavi Daireler ise artık sıkışmadan çıkıldığını ve patlamanın gerçekleştiğini haber verir.
Mr.Carter, gri bir çarpı işaretinden sonra ilk griye kadar beklemenizi ve momentum yönünde bir pozisyon almanızı önerir (örneğin, momentum değeri sıfırın üstünde ise, rahat olun). Momentum değiştiğinde pozisyondan çıkın (artırma veya azaltma, bunu o bir renk değişikliği ile belirtilir). Bu algoritmada ben, ADX ve WaveTrend gibi ek bir gösterge kullanarak iyi giriş noktalarıelde etmeye çalıştım. Histogramı çizmek için ise Linear Regresyon tabanlı farklı bir yöntem kullandım. Mr.Carter basit bir momentum göstergesi kullanır. Göstergeye algoritmik işlemlerde optimizasyon yapabilmeniz için strateji, alrmlar ve sinyaller eklenmiştir.
Özetle bu algoritma ek 4-5 göstergenin harmanlandığı sıkı bir algoritmadır. Herkese Kolaylıklar dilerim...

Momentum Strategy [MA Crossover + Squeeze Release + Alerts]This is a Strategy with associated visual indicators and Buy/Sell/Close Alerts for the Squeeze Momentum Indicator .
Development Notes
-------------------------
This is a fork of LazyBear's Squeeze Momentum Indicator histogram with an added moving average crossover for multiple trade signal confirmation. Functionality for Multi-Timeframe Resolution was also enabled and code was updated for PineScript v4 compatibility.
Strategy Description
-------------------------
Enter trade when the active crossover period (identified by background crossover indicator/zone) correlates with a squeeze release (black to gray cross along midline). BUY Long if momentum in uptrend or SELL Short if in downtrend. Close trade when momentum reverses.
Alerts configured for entering Long/Short position and to Close order.
Designed to have only one open long or short position at a time (no pyramiding) with an associated close order for each.
Indicator Visuals
--------------------
Crossover zone background (green or red) based on last crossover direction (only buy orders are triggered in a buy zone and sell orders in a sell zone)
Moving average crossover line matches trend (buy upwards on green and sell downwards on red)
Buy (green circle) and Sell (red circle) signals at the point of crossover
Buy (green cross) and Sell (red cross) signals at squeeze release on the midline
Long (green arrow) and Short (red arrow) order label when every indicator is triggered together
Close (purple arrow) and label when either trend or crossover zone changes
Recommend backtesting with the resolution set to current timeframe to avoid repainting; no other known repainting. There is a current bug or flaw in the script where all the Close and some of the Long and Short orders are not executed by the strategy (this doesn't affect the visual indicators, only the strategy).
Note that the provided backtest result is based on a position sizing of 10% equity with 100k initial capital. The 15-minute timeframe performed the best, with the 30-minute a close second, and 5/45-minute tied for third. Profit/loss went into the red when expanding out to 2-hours or beyond. I suspect this could be improved upon if you follow the Alerts on the oscillator versus rely solely on the strategy (due to the aforementioned issue with all entry and exit positions not being depicted).
Disclaimer
Past performance may not be indicative of future results. Due to various factors, including changing market conditions, the strategy may no longer perform as well as in historical backtesting. This post and the script are not intended to provide any financial advice.
Script is currently protected (due to the extensive development in the strategy) to prevent the source from being copied and sold.

Squeeze Momentum with DMI confirmation strategyThe script combines Squeeze Momentum and Directional Movement Index (DMI) confirmation. It provides long and short entry and closure daily trade signals, suitable for Spot, Marginal and Futures exchanges
The strategy components are customizable:
Change risk management settings (take profit, stop loss, trailing)
Change signals filters
Enable TrueRange or disable
Change lengths and periods of components
Advantages:
1. Deal start condition includes the following filters and requirements:
Momentum value is adjusted using a relative proportion of volume at each timeframe scale to exclude a chance of opening position at a low impulse stage
Squeeze momentum trigger condition is automatically checked before a position is opened
+DI , -DI and ADX values are taken into account to confirm the trend direction
2. Exit positions using unique risk management settings for each asset
3. Strategy allows to connect broker or automatic trading system using web hook alerts
If you want to obtain access to the strategy please send us a personal message
Squeezze 3lvl buy v3This script is designed to check the settings of squeezing bots with averaging (for automated trading) on the historical chart. As a rule, after a sharp decline in price occurs by a certain amount. To reduce risks, the purchase of the allocated amount occurs in 3 stages with an increase in the purchase amount with a decrease in the purchase price. Suitable for highly volatile instruments, in particular for the cryptocurrency market.

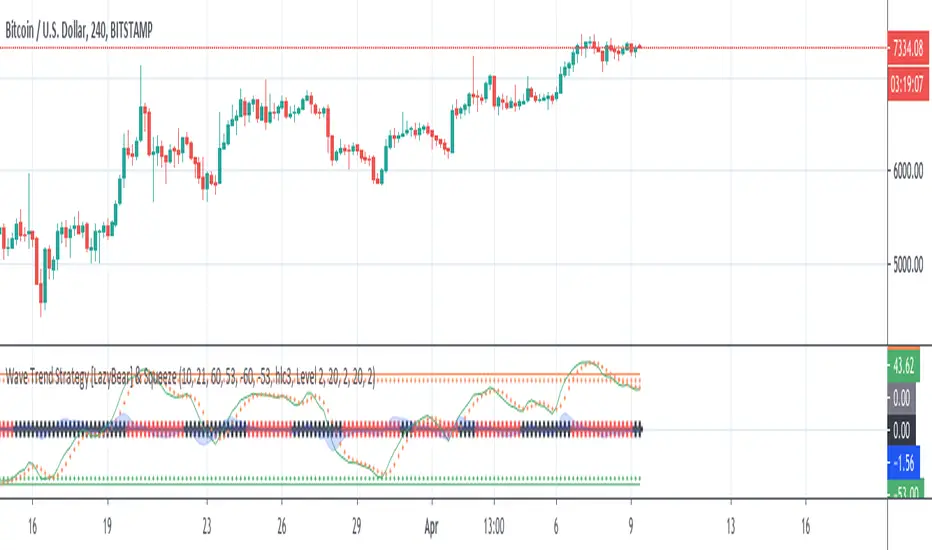
Wave Trend Strategy [LazyBear] & SqueezeThis strategy is a port of famous script Wave Trend Oscillator with a plus: squeeze indicator (LazyBear).
@author LazyBear
Original study from LazyBear
Scope of this port is to identify corrects inputs to get best results from signals that indicator gives.
The squeeze gives a further filter before orders and avoid to enter in a flat market period.
I attached it to chart with heikin ashi candles to have a better result and remove noise: results are good.
Please use comment section for any feedback.
Next improvement (only to whom is interested to this script and follows me): study with alerts on multiple tickers all at one. Leave a comment if you want to have access to study.
********************************** IMPORTANT*******************************
I have developed an expert advisor for metatrader4 (MT4): results of expert advisor form 2015-01-01 to 2018-11-25 are very good with low drawdown and good profit.
********************************************************************************
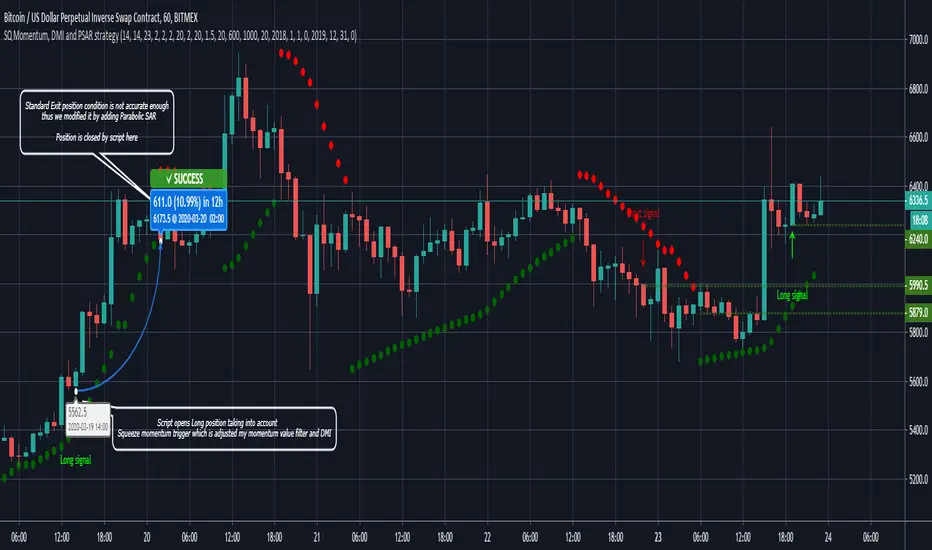
Sqeeze Momentum, DMI and Parabolic SAR strategyThe script combines Sqeeze Momentum, Directional Movement Index (DMI) and Parabolic SAR indicators in long and short scalping strategies
When conditions of long or short position from all mentioned indicators are met script opens position. Once trend changes it closes position and fixes profit
Advantages:
1. Deal start condition includes the folowing filters and requirements:
- Momentum value is adjusted using a relative proportion of volume at each timeframe scale to exclude a chance of opening position at a low impulse stage
- Squeeze momentum trigger condition is automatically checked before a position is opened
- +DI , -DI and ADX values are taken into account to confirm the trend direction
- Position size is taken into account to ensure there will not be opened any excess deals or alerts
2. Exit deal condition was modified using Parabolic SAR indicator. Hence, it is ensured positions will not be closed in a middle of a trend
3. Study is modified into strategy allowing you to use it directly through the trading panel
If you want to obtain access to the strategy please send us a personal message
M-SQUEEZEScript for Swing Trading. It use the following indicators:
- SQUEEZE MOMENTUM INDICATOR (LAZYBEAR)
- RSI VOLUME WEIGHTED (LAZYBEAR)
- PARABOLIC SAR
Settings for OANDA:SPX500USD at 2H

Emmanuel - Squeeze StrategyPlease Read
This strategy has been developed as a professional service. It was published only or testing and verification by the customer. As such, access cannot be granted to anyone else. Sorry about that!
Other open source scripts are available on the BacktestRookies profile.
Squeeze Strategy
Entry Conditions: Undisclosed
Position Sizing: % Risk of Equity when stop loss is hit
Position Management: Take off 50%
Position Management: Move to break even
Exit Conditions: Undisclosed
Strategy based on Squeeze Momentum Indicator [LazyBear]This Strategy is based on LazyBear Squeeze Momentum Indicator.
I added some custom feature and filters.
You can customize a lot of features to get a profitable strategy.
Here is a link to original study.
Please use comment section for any feedback.
Next improvement (only to whom is interested to this script and follows me): study with alerts on multiple tickers all at one. Leave a comment if you want to have access to study.
********************************** IMPORTANT*******************************
I have developed an expert advisor for metatrader4 (MT4) and for jforex platform: results of expert advisor form 2015-01-01 to 2018-11-25 are very good with low drawdown and good profit.
********************************************************************************
Squeeze Momentum on Reversal Strategy** From the original work of LazyBear ** Thanks for his Squeeze Momentum indicator
This strategy gives acceptable result on EUR/USD - 1H chart with default parameters
