Momentum Strategy [MA Crossover + Squeeze Release + Alerts]This is a Strategy with associated visual indicators and Buy/Sell/Close Alerts for the Squeeze Momentum Indicator .
Development Notes
-------------------------
This is a fork of LazyBear's Squeeze Momentum Indicator histogram with an added moving average crossover for multiple trade signal confirmation. Functionality for Multi-Timeframe Resolution was also enabled and code was updated for PineScript v4 compatibility.
Strategy Description
-------------------------
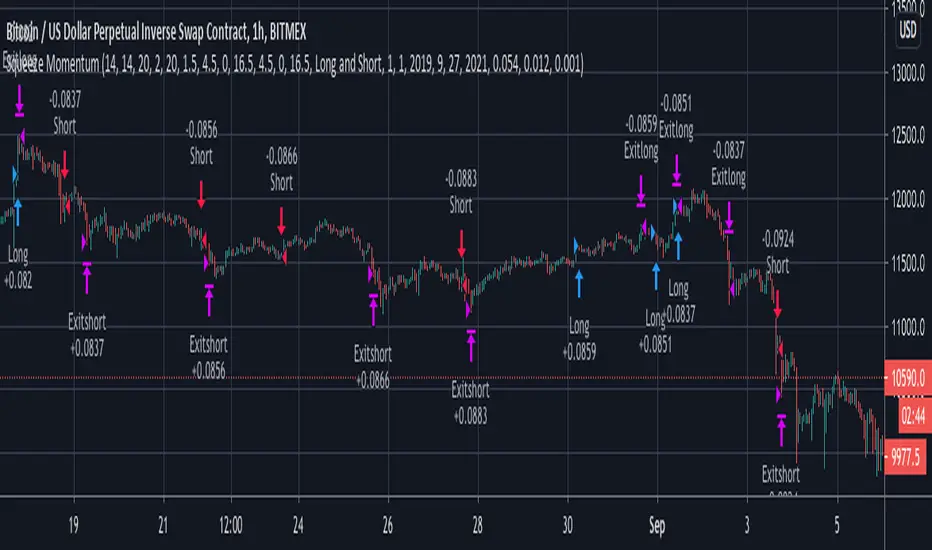
Enter trade when the active crossover period (identified by background crossover indicator/zone) correlates with a squeeze release (black to gray cross along midline). BUY Long if momentum in uptrend or SELL Short if in downtrend. Close trade when momentum reverses.
Alerts configured for entering Long/Short position and to Close order.
Designed to have only one open long or short position at a time (no pyramiding) with an associated close order for each.
Indicator Visuals
--------------------
Crossover zone background (green or red) based on last crossover direction (only buy orders are triggered in a buy zone and sell orders in a sell zone)
Moving average crossover line matches trend (buy upwards on green and sell downwards on red)
Buy (green circle) and Sell (red circle) signals at the point of crossover
Buy (green cross) and Sell (red cross) signals at squeeze release on the midline
Long (green arrow) and Short (red arrow) order label when every indicator is triggered together
Close (purple arrow) and label when either trend or crossover zone changes
Recommend backtesting with the resolution set to current timeframe to avoid repainting; no other known repainting. There is a current bug or flaw in the script where all the Close and some of the Long and Short orders are not executed by the strategy (this doesn't affect the visual indicators, only the strategy).
Note that the provided backtest result is based on a position sizing of 10% equity with 100k initial capital. The 15-minute timeframe performed the best, with the 30-minute a close second, and 5/45-minute tied for third. Profit/loss went into the red when expanding out to 2-hours or beyond. I suspect this could be improved upon if you follow the Alerts on the oscillator versus rely solely on the strategy (due to the aforementioned issue with all entry and exit positions not being depicted).
Disclaimer
Past performance may not be indicative of future results. Due to various factors, including changing market conditions, the strategy may no longer perform as well as in historical backtesting. This post and the script are not intended to provide any financial advice.
Script is currently protected (due to the extensive development in the strategy) to prevent the source from being copied and sold.
Squeeze

[Zekis]Squeeze Momentum + IchimokuHi,
This is a strategy developed by @zsone, a strategy suitable mostly for altcoins (but not necessary).
The strategy is using the following indicators: Squeeze Momentum (LazyBear), two Ichimoku Clouds (one is MTF), daily EMA21 and EMA golden cross (optionally).
Setting should be used as default.
Rules for entries (scalping):
Go Long (green line on the histogram):
- use low time frames (3m, 5m, 15m)
- candle closes above the ichimoku cloud
- squeeze momentum, first grey cross on green histogram (2 ways):
1. histogram is green and have a black cross and later it turns to grey cross
2. the histogram is red with grey cross and it goes to green with grey cross without having a black cross, just directly goes green histogram with grey cross
- price is above the daily EMA21
- price is above or inside de ichimoku cloud MTF (1h TF)
- optionally! EMA golden/death cross
Go Short (red line on the histogram):
- vice versa
Rules for exits:
- DI+ crosses down on DI- on longs
- DI- crosses up on DI+ on shorts
- or any fixed, dynamic, trailing... TP/SL (according to the market conditions)
This strategy can be used also for high time frames (12h, 1D) with a golden/death cross confirmation.
Soon I will publish a screener that scan multiple altcoins at once to find setups easier.
P.S.1 The strategy should be used with it's default settings/values (you can change them if you want), but there are 2 versions of Squeeze Momentum from Lazy Bear that you can choose from.
P.S.2 This is not a magic strategy, please do your research before using real money!
P.S.3 The strategy is free to use, just add it to the favorites and then to the chart.
Enjoy!

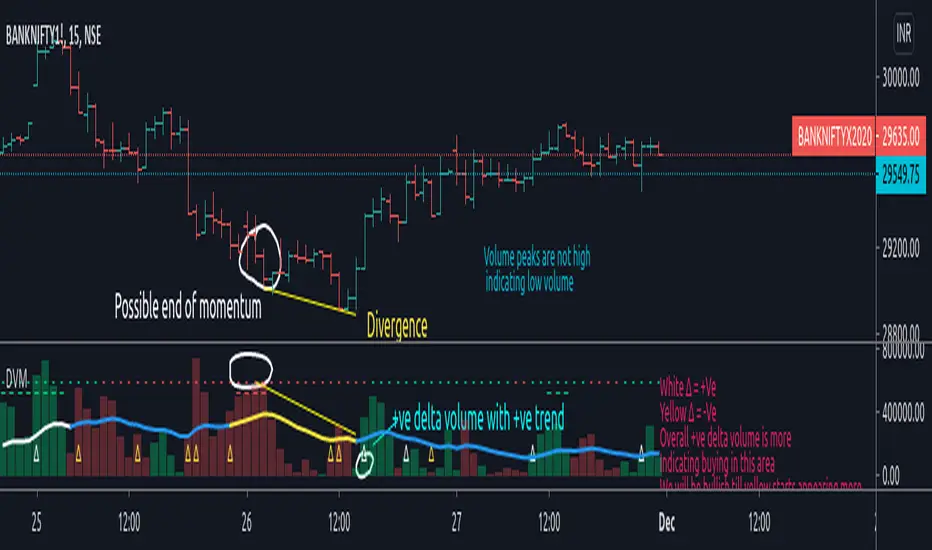
Delta Volume Moves Today I propose an indicator to measure volume trend and change in buying and selling pressure (Delta). This is a synthetic mechanism to derive delta volume and then formulate rest so its not like typical delta volume indicator either.
So what is it exactly?
Indicator first calculates the cumulative delta volume , then filters it through filters applied in the calculation to identify major volume changes/pressure change, it also keeps track of overall trend based on 20 SMA filter as basis and 2 stdv movement from it applied on cumulative delta volume . This is plotted on top side of the indicator with "-" and "_" plots. Color lime indicates bullish trend and color red indicates bearish trend .
Delta filter is dependent on the factor input which is user defined, here by default it is 1.5, which will indicate overall significant change in pressure in volume in that particular direction, please note that higher the number lower the delta plots you will have to count it, and number below 1 would be useless as it would not be measuring "increase" in delta volume but decrease. So it is advised to keep it around 1.5 to be reasonably useful measure. This is plotted with "∆" character on the volume bars.
How can we use this to our advantage?
As you can see on chart, its able to identify possible reversal or tops/bottoms of the price action, while this is the primary use it is also worth noting that in comparison to the regular volume indicator which is dependent on the candle price close with respect to its open, this is much better visual representation of the sell or buy volume .
When you apply delta filters and trend filters to an already easy to read volume indicator, it is making significant impact on indicators ability to identify major volume changes and trend changes with respect to cumulative delta volume .
Authors note:
Please note that this study is experimental and published for the educational purpose, if you decide to use it to monitor market it is advised that you put in some time to observe correlations between this and price action before you start trading it.
Also, while on chart this is showing impressive tendency to identify tops and bottoms, its a very limited view. Please keep in mind to check this across different scripts which have good qty of volume .
Author takes no responsibility of your loss or profit from this.
Past performance is no assurance of future performance.
Regards.
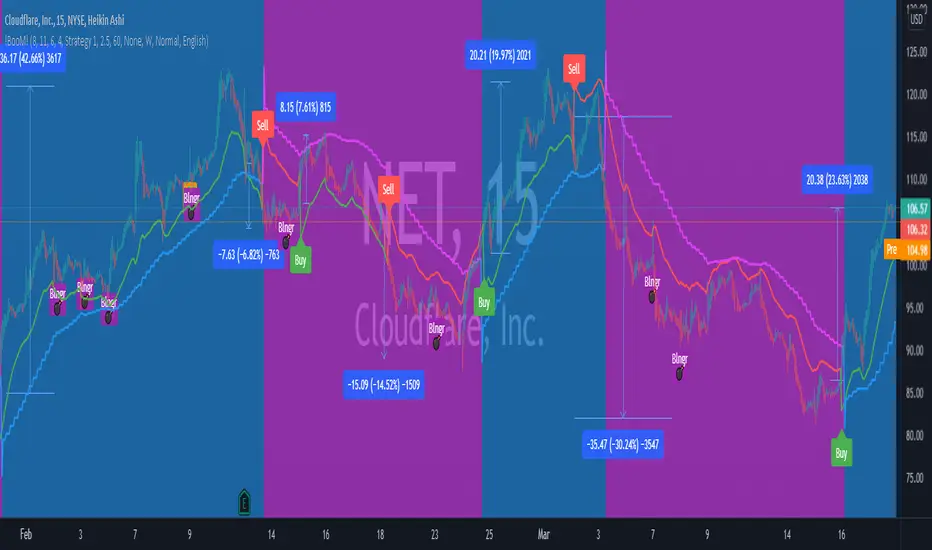
!BooM!Hello
The indicator measures the relationship between Average True Range (ATR) that shows how much an asset moves, on average, during a given time frame and Standard Deviation that measuring how widely asset prices are dispersed from the average price. If prices trade in a narrow trading range, the relationship between the ATR and SD will return a low value that indicates low volatility that will lead to potential price quick movement.
To increase the accuracy of the indicator and reduce false signals, it generates three circles, each indicate protentional price quick movement coming. For circle to print, following criteria must meet:
• Green Circle is based on low volatility and both ATR and SD are at minimum value for a short pre-defined time frame.
• Magenta Circle is based on low volatility and SD are at minimum value for a long pre-defined time frame.
• Yellow Circle is based on low volatility and SD are at minimum value for a short pre-defined time frame and Average Directional Movement Index reaching to pre-defined level.
The indicator focuses mainly on identifying potential price quick movement. However, it is equipped with two signal that is generated upon crossing the keltner channel upper or lower bands to help identifying the direction of the price movements but the user shall study the chart on big time frame to confirm the direction of the price movement.
If you would like to use it, please drop a message or find other contact under my signature.
After purchase, open the TradingView indicator library. Under the Invite-Only Scripts section, you will see it. Add it to your chart and save your chart layout.
SVIEWThis is momentum based indicator
Input
1. Two EMA
2. Stochastic
Thought process
1. Difference between fast and slow ema has a oscillating nature.
2. Stochastic %k %d crossover gives early signals
3. early entry gives low risk high reward setup
Calculation
1. A= EMA (fast) - EMA (slow)
2. B =Stochastic(%K)-Stochastic(%D)
When A is increasing and B is positive, bar is green
When A is decreasing and B is negative, bar is red
Else, bar is black
Use
This is an early entry signal system. When used with Channel trading system, it gives high probability, low risk high reward setups
Example
When price has breached below -2 Keltner channel, and impulse candle turns green, go long (or sell put options )
29 minutes ago
Release Notes:
This is combination of
1. Ema diff
2. stochastic
3. Keltner channel
4. Bollinger bands
5. bunch of EMAs
Thought process
1. Difference between fast and slow ema has a oscillating nature.
2. Stochastic %k %d crossover gives early signals
3. early entry gives low risk high reward setup
Calculation
1. A= EMA (fast) - EMA (slow)
2. B =Stochastic(%K)-Stochastic(%D)
When A is increasing and B is positive, bar is green
When A is decreasing and B is negative, bar is red
Else, bar is black
Use
This is an early entry signal system. When used with Channel trading system, it gives high probability, low risk high reward setups
Example
When price has breached below -2 Keltner channel, and impulse candle turns green, go long (or sell put options )
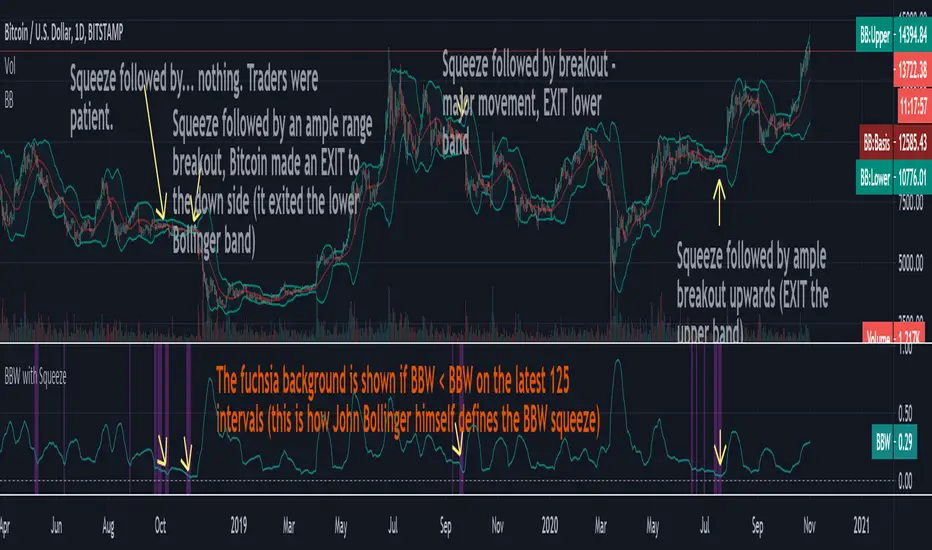
Bollinger Bands Width with Squeeze AlertThis is the standard Bollinger Bands Width (BBW) indicator with the added capability of detecting the "Bollinger Bands Squeeze" as defined by John Bollinger:
The BBW squeeze happens when BBW < all BBWs of the past 125 intervals.
Whenever a BBW squeeze occurs, this means there is low volatility.
A low volatility period is almost always followed by high volatility: a large breakout (with price performing ample movement and exiting the BBW bands) may suddenly occur.
The breakout may be preceded by a fakeout, during which price moves in the opposite direction.
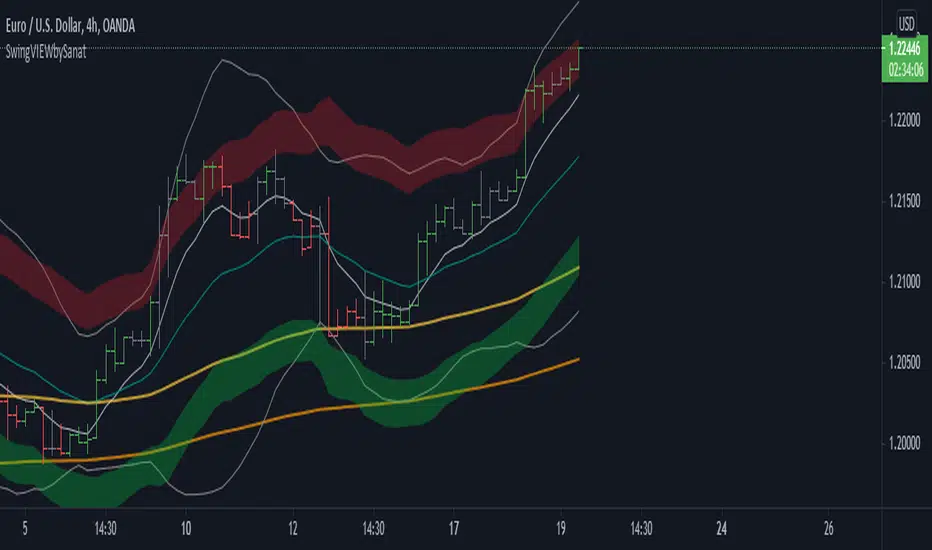
[astropark] Nova BandsDear followers,
today a new analysis and scalping tool for day trading on low timeframes (5-15 minutes) or to plan swing trades on hourly timeframes. It can be used also on high timeframes just for analysis current market trend.
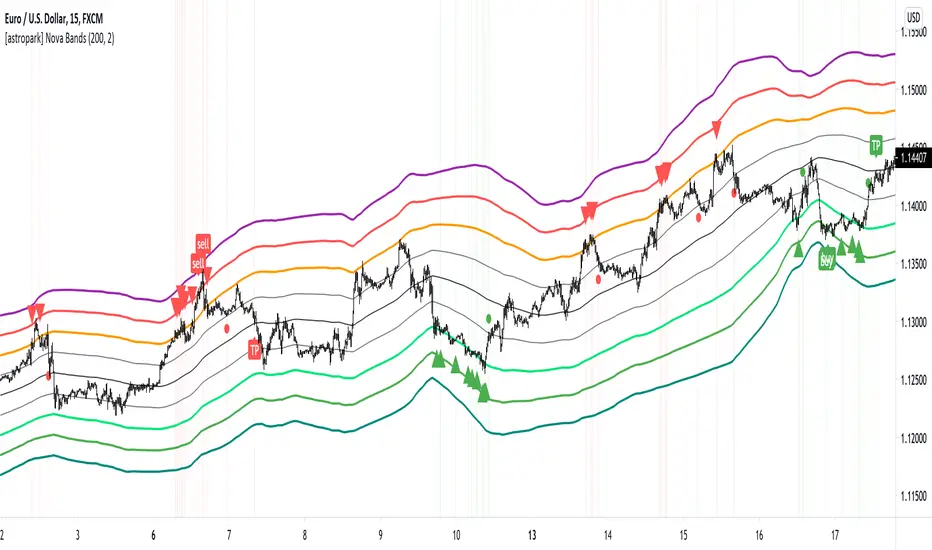
The indicator plots a series of levels which create a nice bands flow.
The slope of levels make you easily understand when price is in consolidation, in uptrend or in downtrend.
The golden rule is always the same: buy low and sell high .
This indicator plots:
3 "price is low here" levels (from dark green to light green)
3 "price is average here" levels
3 "price is high here" levels (from purple to orange)
When bands are flat, price is in consolidation and this is best condition to trade with nova bands.
When price reaches higher bands, you will open a short position with targets below levels, fully closing your position when price hits the average level (black).
Here an example on Bitcoin on 15m using 1h resolution:
The same applies when price reaches lower bands, you will open a long position with targets above levels, fully closing your position when price hits the average level (black).
When bands get nearer and nearer is called "Bands Squeeze": price is next to a main breakout move, volatility is coming!
Here an example of SPX500: after long consolidation and bands getting nearer and neared, we had the breakout, downwards in this case.
In this screenshot you can see what signals algorithm provided:
Our suggestion is to play safe these kind of scenarios, no reason to FOMO buy/sell. Just wait for price consolidation / getting back inside the bands.
For example you would have skip first three buy signals, while you would have longed the last two as price came back inside bands after the big volatility which made price went below bands.
Another example is TSLA stock on 15m with 1h resolution:
Price touched the first bullish level and made a big move upwards, breaking bands with a +90% move.
In this case, you would have skipper first 2 sell signals, while you would have accepted next two with stoploss above recent high.
Acceptable also the other two sell signals, which you may have closed when price retraced to lower levels:
You can of course run trends like this buying on price hitting bullish/lower levels after a long consolidation and sell on price hitting middle and higher levels:
A trader who wants to be a winner must understand that money and risk management are very important, so manage your position size and always have a stop loss in your trades.
Here some examples how the indicator works on different markets:
EURUSD 15m with standard settings and 1h resolution
GOLD (XAUUSD) 15m with standard settings and 1h resolution
Facebook (FB) 15m with standard settings and 1h resolution
This is a premium indicator , so send me a private message in order to get access to this script.
Multi StrategyDuring the course of a trade, we can find ourselves changing strategies depending on the market. Instead of using many different templates, I have a simple indicator that clearly says "Buy", "Sell" or "Stay Out". The great thing about this approach, is we instantly observe the majority are in agreement and that decides which way to place our trade.
This indicator includes the following strategies:
- QQE
- Ichimoku using much faster settings.
- Parabolic SAR
- Supertrend
- TTM Oscillator
- The Squeeze strategy
- The Alligator Strategy
Using this indicator is simple, if the lines are mainly green then buy, if mainly red then sell OR don't trade. So...
Green Line - This strategy is in a buy position
Orange or Black Line - This strategy is undecided
Red Line - This strategy is in a sell position
There are also some green and red circles for reference that appear showing when that bar has broken through the Ichimoku cloud.
The trader's approach is simple, when all indicators are green or red, then take the trade. As soon as one indicator changes, then re-evaluate using your normal process, such as price action, to determine whether to close the trade or continue.
I can customise this further or add other strategies, please message me.

Volatility Bands by DGTVolatility represents how large an asset's prices swing around the mean price, the degree of variation of a trading price over time, and is commonly measured with beta (β) coefficients, standard deviations (σ) of returns where tools such as Average True Range, Bollinger Bands, Keltner Channel, Squeeze Indicator, etc presents volatility concept
Volatility often refers to the amount of uncertainty or risk related to the size of changes in a security's value. The higher the volatility, the riskier the security - the price of the security can change dramatically over a short time period in either direction. A lower volatility - security's value does not fluctuate dramatically, and tends to be more steady
This study, Volatility Bands , attempts to present a way to measure and visualize volatility , using standard deviations (σ) and average true range indicator, and aims to point out areas that might indicate potential trading opportunities
I will try to explain the usage with examples,
same setup with different option selected
as you may observe from the examples different setting may have advantages and disadvantages over one another, it is recommended to verify a trading setup with different available options.
Additionally, It is recommended to use this indicator in conjunction with other technical indicators, or verify using chart/candle patterns. Below is an usage example using in conjunction with other indicator, in the given example “Neglected Volume by DGT” is selected
Similarities and Differences
Bollinger Bands depicts two standard deviations above and below a simple moving average, and Keltner Channel depicts two times average true range (ATR) above and below an exponential moving average
Volatility Bands study combines the approach of both Bollinger Bands and Keltner Channel, with different settings and different visualization
Default settings are one standard deviations and one time average true range (ATR) above and below 13 period exponential moving average. Setting can be adjusted by users but let me remind all testes are performed with the default settings.
Mathematically expressed as
Upper band area between “ema + stdev” and “ema + atr”
Lower band area between “ema – stdev” and “ema – atr”
A different display is added with the inspiration I get from one of the @quantgym ‘s study, many thanks @quantgym 😉
When difference band display is selected the study will reflect the area between “ema + stdev – atr” and “ema – stdev + atr”. As shown in the examples above
Note: standard deviation calculation can be adjusted based on price action or its moving average.
Other differentiation between BB and KC is with V-BANDS mostly we look for trade opportunities when price action move out of the bands and in most cases we assume market is consolidating when the price action is within the bands
The other indicator that presents similarities to Volatility Bands is Squeeze Indicator, which measures the relationship between Bollinger Bands and Keltner's Channels to help identify consolidations and signal when prices are likely to break out. Mainly Volatility Bands is different version of Squeeze indicator, in fact the purpose is almost same but visualization is completely different. Additionally Volatility Bands Offers trading opportunities whereas Squeeze indicator only presents market states unless a momentum indicator is adapted to Squeeze indicator.
Disclaimer:
Trading success is all about following your trading strategy and the indicators should fit within your trading strategy, and not to be traded upon solely
The script is for informational and educational purposes only. Use of the script does not constitute professional and/or financial advice. You alone have the sole responsibility of evaluating the script output and risks associated with the use of the script. In exchange for using the script, you agree not to hold dgtrd TradingView user liable for any possible claim for damages arising from any decision you make based on use of the script

Squeeze Momentum with DMI confirmation strategyThe script combines Squeeze Momentum and Directional Movement Index (DMI) confirmation. It provides long and short entry and closure daily trade signals, suitable for Spot, Marginal and Futures exchanges
The strategy components are customizable:
Change risk management settings (take profit, stop loss, trailing)
Change signals filters
Enable TrueRange or disable
Change lengths and periods of components
Advantages:
1. Deal start condition includes the following filters and requirements:
Momentum value is adjusted using a relative proportion of volume at each timeframe scale to exclude a chance of opening position at a low impulse stage
Squeeze momentum trigger condition is automatically checked before a position is opened
+DI , -DI and ADX values are taken into account to confirm the trend direction
2. Exit positions using unique risk management settings for each asset
3. Strategy allows to connect broker or automatic trading system using web hook alerts
If you want to obtain access to the strategy please send us a personal message
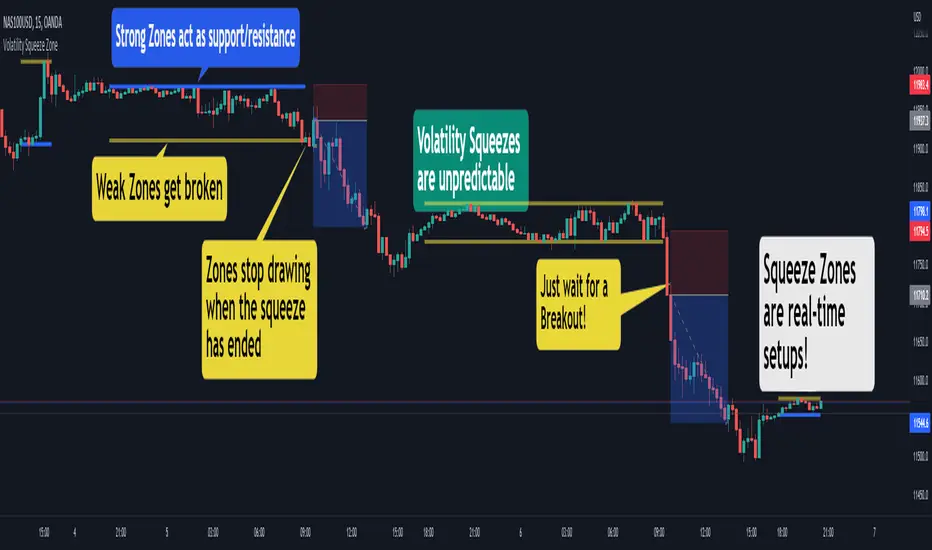
Squeeze ZoneThis script supports my previous post Empirical Suite
It automatically plots Support and Resistance levels on the chart during periods of volatility squeeze.
You have three plotting methods:
From High to Low
From Open to Close
Linear Regression (experimental)
The levels are color-coded:
Red: weak, one-sided volatility squeeze
Orange: typically strong, no volatility issue
You can have a double-red zone, where both buying and selling volatility has dropped.
Combine this with the Empirical Suite or your favorite
analysis tools for extra confirmation.
Cheers,
EFX
Empirical SuiteThis indicator removes high-frequency noise from 4 extremely useful measurements:
Volume
Volatility
Trend
Momentum
All plots are normalized after filtration to make comparisons easier.
In the chart, I step through an example trade on $TSLA, however, the indicator works well on
Currencies and Commodities too.
Comparing side-by-side to other common tools
RSI: Faster entries and exits
Stochastic: Faster exits and less false positives
Momentum: Not manipulated by low-volume spikes
TTM Squeeze: Regularly 1 bar faster on both entries and exits
MACD: Faster entries and exits
I plan on releasing updates in the future - Alerts, Entry & Exit conditions, and better performance during consolidation.

Keltner+Bollinger Squeeze [kingthies_]Keltner-Bollinger-Combo Squeeze
As you likely know, the bollinger squeeze comes from the bband indicator, a classic indicator in all forms of technical analysis, effectively measuring volatility of a given assets price movement.
There are different forms of the squeeze here on tradingview, and I've combined the Bollinger band indicator in my own strategy, to the alternative and similar appearing Keltner channels. The two work incredibly well together and I've used them in my analysis for years now as my core approach to understanding the technical side of the markets.
This tool will show users the result that i typically look for when assessing for potential volatile moves in the near future for an asset, and will highlight the chart + send an alert when the chart is something to look at and the indicator suggests incoming volatility may be in the near future.
The users will still need to assess themselves whether the squeeze they see is a bullish or bearish leaning, but the overall idea is to set it and forget it with the alert clause thats added in.
Personally i enjoy this with Heikin ashi inputs but use whichever preference you have, and all timeframes + tickers should apply here.
Cheers

Stoch X, an Indicator of Indicators by DGTStochastic refers to a randomly determined process and financial markets use stochastic models to represent the seemingly random behaviour of assets and then used by quantitative analysts to value options on asset prices
The stochastic oscillator, developed by George Lane, presents the location of the closing price of a stock in relation to the high and low range of the price of a stock over a period of time. Lane has said that the stochastic oscillator does not follow price or volume or anything similar. He indicates that the oscillator follows the speed or momentum of price.
Traditionally, readings over 80 are considered in the overbought range, and readings under 20 are considered oversold. Please note that, very strong trends can maintain overbought or oversold conditions for an extended period and traders should look to changes in the stochastic oscillator for clues about future trend shifts. It is advised to check the higher timeframe of your trading timeframe and see where you are in the “big picture”
Signal crosses , intersection of stochastic and its signal line is considered to be a signal that a reversal may be in the works
Divergence between the stochastic oscillator and trending price action is also seen as an important reversal signal
Lane also reveals in interviews that, as a rule, the momentum or speed of the price of a stock changes before the price changes itself . In this way, the stochastic oscillator can be used to foreshadow reversals when the indicator reveals bullish or bearish divergences. This signal is the first, and arguably the most important, trading signal Lane identified.
What is Stochastic X ?
Stochastic X , is essentially an indicator of an indicator, providing stochastic calculation to some of well known indicators, such as RSI, MFI, OBV, etc. This means that it is a measure of selected specific indicator relative to its own high/low range over a user defined period of time.
Features of Stoch X
1- Displays Stoch of and indicator plus a companion indicator (companion display can be disabled from user dialog box)
Available options
Stoch Source plus PM A, where Source is close price and PMA refers to Price Distance to its Moving Average (for further details you may check my study of Price Distance to its MA by DGT, and different application of distance concept available with “MACD-X, More Than MACD" And “P-MACD”)
Stoch RSI plus RSI , Stoch RSI, developed by Tushar Chande and Stanley Kroll, is a build-in indicator available on Trading View, where Stoch X adds RSI as a companion indicator to Stoch RSI
Stoch MFI and MFI , where MFI is Money Flow Index, measures buying and selling pressure through analyzing both price and volume
Stoch OBV + VO , Where OBV is On Balance Volume, is a momentum indicator that measures positive and negative volume flow. VO stands for Volume Oscillator which aims to confirm a market turnaround or trend reversal
Stoch EWO + EWO , EWO stands for Elliott Wave Oscillator
By default the threshold levels are indicated and are displayed differently for the regular Stoch or Stoch RSI. Overbought band (70-80), oversold band (20-30) and middle line (0) are emphasized
Warning : Centered Oscillators base line is moved from 0 to 50 to better suit with Stoch X, which is applied to PMA, VO and EWO
2- Can be plotted along with Stoch in the same window using the same scaling
To avoid misinterpreting the area between Stoch X and its Signal Line is highlighted automatically in case Stoch is selected to be plotted
3- Squeeze Indicator added as Add-on in the bottom of the Stoch X
During volatile market conditions the stochastic oscillator has been known to produce false signals. One way to help with this is to take the price trend as a filter, or basic chart pattern analysis can help to identify major, underlying trends and increase the Stoch X's accuracy.
This study implements Squeeze Indicator to help and add additional insight for filtering false signals. Blue diamond shapes indicates the squeeze release, that is volatility increased and according to momentum direction the buy/sell possibility can be considered. Orange ones displays consolidation periods, that is low volatility and the market is assumed to be in squeeze and no trade is recommended. in this phase.
Disclaimer: Trading success is all about following your trading strategy and the indicators should fit within your trading strategy, and not to be traded upon solely
The script is for informational and educational purposes only. Use of the script does not constitutes professional and/or financial advice. You alone the sole responsibility of evaluating the script output and risks associated with the use of the script. In exchange for using the script, you agree not to hold dgtrd TradingView user liable for any possible claim for damages arising from any decision you make based on use of the script


ST Squeeze ProThe Squeeze Pro indicator introduces high and low compression squeezes to the traditional Bollinger Band squeeze. The three types of squeezes are indicated by the colored dots on the zero line (black = low, red = mid, orange = high) while momentum is indicated by the oscillator. The Squeeze Pro is used to both find areas of consolidation (the squeeze) as well as assess the momentum and probable direction when the squeeze fires (consolidation ends).
Use the link below to obtain access to this indicator.

Squeezze 3lvl buy v3This script is designed to check the settings of squeezing bots with averaging (for automated trading) on the historical chart. As a rule, after a sharp decline in price occurs by a certain amount. To reduce risks, the purchase of the allocated amount occurs in 3 stages with an increase in the purchase amount with a decrease in the purchase price. Suitable for highly volatile instruments, in particular for the cryptocurrency market.

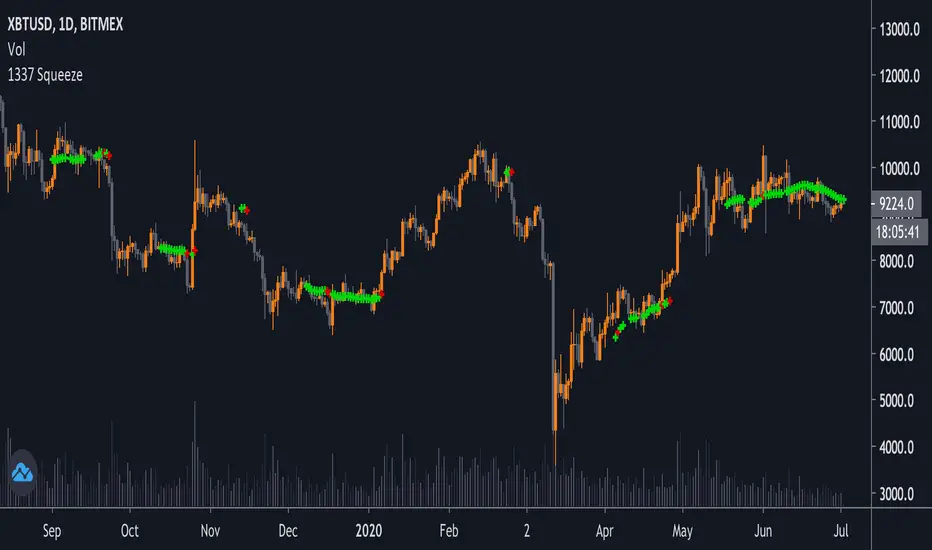
1337 SqueezeThis is a squeeze indicator plotted on the chart, with configurable values. Green crosses show when there is a squeeze (bollinger bands inside keltner channels). Red crosses show a potential release/breakout when close > bollinger bands.
You can also edit the settings of the indicator to show the bollinger bands and keltner channels (by removing the transparency).
Renko AccelerationRenko is a very useful charting method for analyzing stock movement. It does a great job of filtering out all the excess noise so that all we're left with is pure price action. But, what about time? Time is a fundamental part of chart analysis and we are only seeing part of the picture. After all, shouldn't we take a very different approach to trading signals from a block that renders in 2 seconds as opposed to a block that renders in 30 minutes?
This indicator provides the best of both worlds, enabling us to correlate the passing of time with price movement and clearly see when squeezes and breakouts occur.
As the indicator turns up to green we can see that volatility is on the move and the market is accelerating (breakout), and as it turns down to red the market is stagnating (squeeze). There is also an alternate 'Precise' view which renders the exact time per block for more granular analysis.

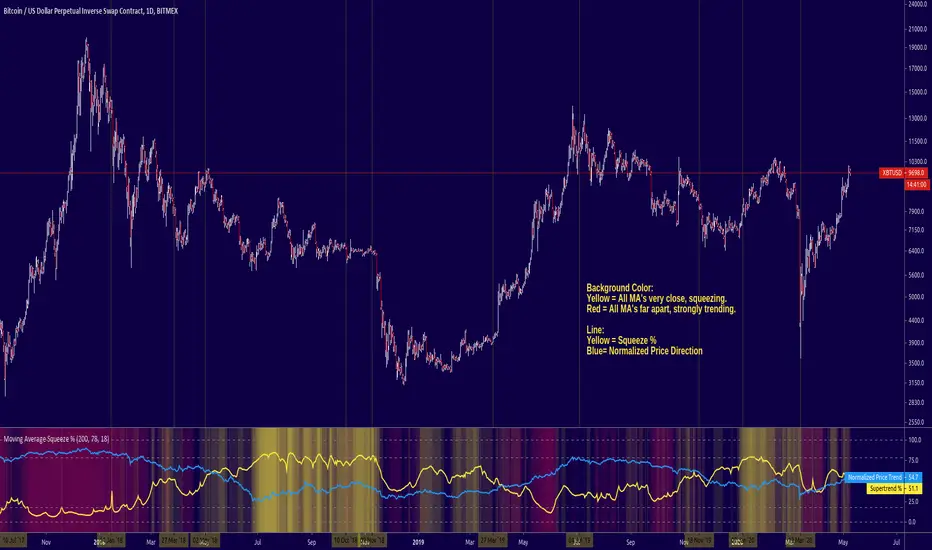
Moving Average Squeeze %A new indicator for you guys to try out, it measured the squeeze % of several MA's and combines them in a super trend-% (where 0 is low squeeze and 100% is where all MA's are crossing on same price)
You can use different period lengths and enable the composite-% for display if you want to see all the data that makes up the super trend.
The indicator uses the 10, 20, 50, 100, and 200 SMA.
Squeeze Momentum Indicator [LazyBear] vHMAThis is a remake of the famous LazyBear Indicator, the Squeeze Momentum Indicator.
All i did was take out the SMA's and replace them with HMA's. HMA is a more responsive moving average.
Hull Moving Average.
This is a derivative of John Carter's "TTM Squeeze" volatility indicator, as discussed in his book "Mastering the Trade" (chapter 11).
Black crosses on the midline show that the market just entered a squeeze ( Bollinger Bands are with in Keltner Channel). This signifies low volatility , market preparing itself for an explosive move (up or down). Gray crosses signify "Squeeze release".
Mr.Carter suggests waiting till the first gray after a black cross, and taking a position in the direction of the momentum (for ex., if momentum value is above zero, go long). Exit the position when the momentum changes (increase or decrease --- signified by a color change). My (limited) experience with this shows, an additional indicator like ADX / WaveTrend, is needed to not miss good entry points. Also, Mr.Carter uses simple momentum indicator , while I have used a different method (linreg based) to plot the histogram.
More info:
- Book: Mastering The Trade by John F Carter
Here is the original version:

GRAB or TrendStrength Bars with Highlights[Salty]GRAB or TrendStrength Bars with Propulsion Dots and Highlights for Squeeze Pro, CCI-Arrows, and SlowStoch
This indicator shows GRAB or TrendStrength candles and allows several moving averages to be displayed at the same time.
It has arrows and diamonds above or below the candles to show CCI values above 100 or below -100 with the arrow pointing in the direction of the momentum.
Diamonds indicate slightly weaker momentum than arrows, but still consider strong.
It has background coloring that is light green to show bullish trends and light red to show bearish trends that are derived from slow stochastics.
In general Darker colors are used for down moves and lighter colors are use to show up moves. Also, red indicates bearish, and green indicates bullish throughout.
It has yellow background to show squeezes with additional Squeeze Pro information shown at the bottom of the chart in the form of letters and momentum arrows.
L = Low compression squeeze, S = Normal Squeeze, and H = High Compression Squeeze.
It has a set of propulsion dots for each Moving Average. The trend is consider bullish when green colored dots print, and bearish when red dots print.
3 ATR Keltner channels are printed. The first two show the values used by the squeeze by default
2 Bolinger Bands are displayed based on the values used by the Squeeze by default.
1 VWAP line may be displayed.
TIP: overlaying the TICK symbol is great for confirming a bias where positive values are bullish and negative values are bearish.

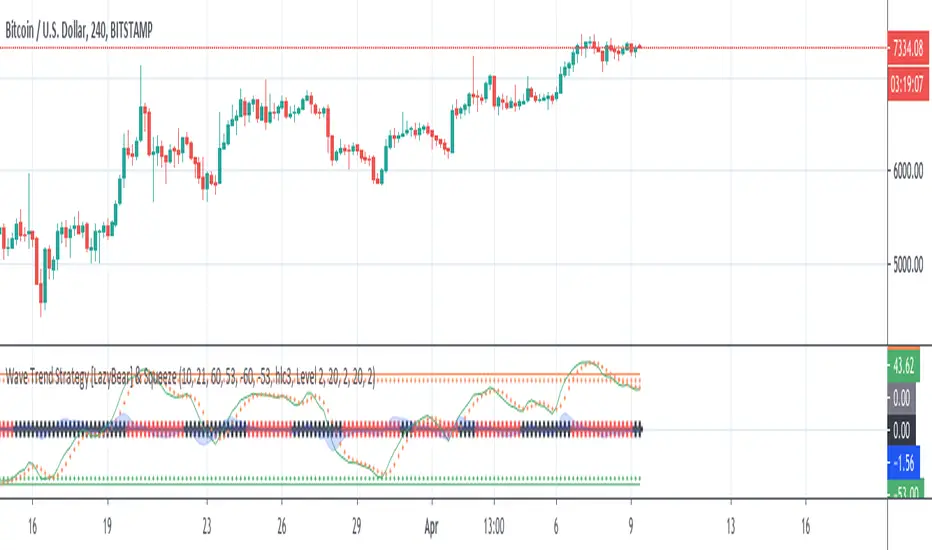
Wave Trend Strategy [LazyBear] & SqueezeThis strategy is a port of famous script Wave Trend Oscillator with a plus: squeeze indicator (LazyBear).
@author LazyBear
Original study from LazyBear
Scope of this port is to identify corrects inputs to get best results from signals that indicator gives.
The squeeze gives a further filter before orders and avoid to enter in a flat market period.
I attached it to chart with heikin ashi candles to have a better result and remove noise: results are good.
Please use comment section for any feedback.
Next improvement (only to whom is interested to this script and follows me): study with alerts on multiple tickers all at one. Leave a comment if you want to have access to study.
********************************** IMPORTANT*******************************
I have developed an expert advisor for metatrader4 (MT4): results of expert advisor form 2015-01-01 to 2018-11-25 are very good with low drawdown and good profit.
********************************************************************************