MZ SRSI Strategy V1.0Strategy Introduction
This strategy starts from selection of 1st Moving Average from one of following:
SMA
EMA
DEMA
TEMA
LRC
WMA
MF
VAMA
TMA
HMA
JMA
Kijun v2
EDSMA
McGinley
Then it calculates the RSI of selected 1st Moving Average
In the end it calculates Moving Average of previously calculated RSI and for this purpose 2nd Moving Average is also selected from above list.
Cross of RSI and its Moving Average generates Strategy Alerts
Only long trades are enabled currently
Default Settings
I've set the default selection to the perfect options for 1D and 4h timeframes. You can modify both MAs selection and their length according to your selected timeframe.
Following default settings are used:
Heiken Ashi Candles are selected by default as source
1st Moving Average selection is set to LRC (Linear Regression Curve)
Length of 1st Moving Average is set to 50
RSI length is set to 2 because it is supposed to be fast
2nd Moving Average of RSI is set to TMA (Triangular Moving Average)
Length of 1st Moving Average is set to 5
Start date is set to 2011
Backtesting can also be done selecting %age of equity
Suggestions for Usage
Mostly winning trades have no prominent drawdown so losing trades can be abolished with Stoploss. Would soon add Stoploss, MTF and Takeprofit options in next version. Also if you want an alerts version of it then just comment below and would publish it later. I’ve found this strategy useful on 1D and 4h timeframes with described default settings.
Srsi

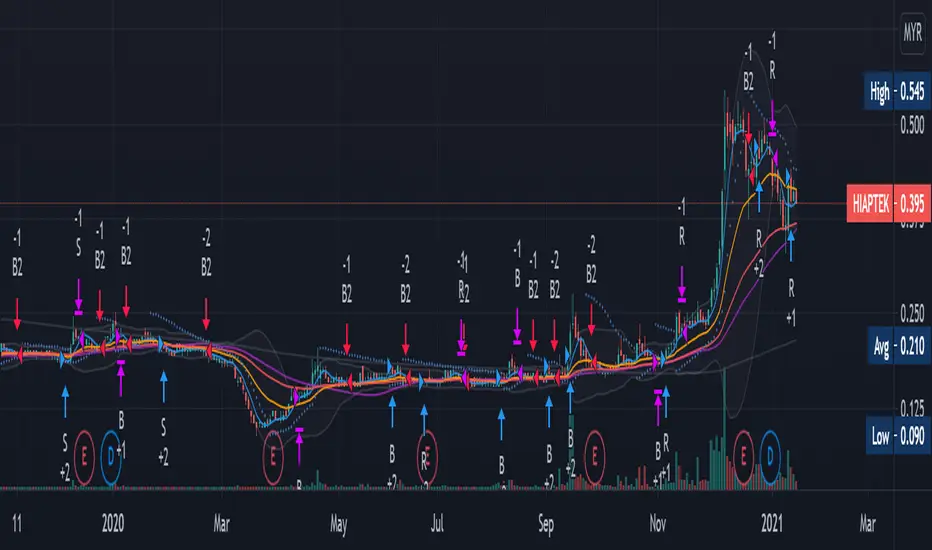
Renovation-10 (Including 10 Traditional Indicators)This idea is not rare. It is just a combination of 10 most well know and traditional Indicators to form one renovated indicator. There are Moving Average (MA), Volume (V), Bollinger Band (BB), Relative Strength Index ( RSI ), Stochastic RSI, Modified Stochastic RSI, Moving Average Convergence Divergence ( MACD ), Average directional index ( ADX ), Average True Range (ATR) and Parabolic Stop and Reverse (PSAR). These indicators most I found was just showing entering position strategic alone. I just want to know how well them work together when combination. I modified many times and thinking for the strategic enter and exist position with the choice of these 10 indicators to maximize the profitability which shows in strategic tester in every stock and conditions.
THEORY:
Fluctuation of price is like a Wave which I categorized it into four period. They are Sideway, Breakout Positive and Negative, Retracement and Consolidation. Breakout is rare to happen, either go up or go down. After a breakout usually will have small retracement, then trend will go for sideway. After long period of sideway, the wave is starting to run out of energy and there will be consolidation period.
STRATEGIC OPTION:
S: Sideway Period
B: Breakout Period
R: Retracement Period
(+): Buy
(-): Sell
PROBLEM:
1. Not performing very well at very penny stock which the graph looks like barcode.
Suggesting can change daily graph to weekly graph to avoid.
2. Be careful with Sideway entry signal because sometimes price may continue go down. You will stuck at middle if you enter without confirmation.
Confirm the price is stable at support by current low is higher or equal to past three to five day low before entry.
3.Always remember Breakout is rare, do not push for luck
Always make profit at Sideway and Retracement trend. Can Sell half only at BB when breakout buying signal is available, to avoid losing chance of chasing breakout.
4. Breakout selling signal 2 may delay
After breakout, make sure sell all when 2-3 red candle appeared or When BB is squeezing.
5. Other tools may required to confirm entry position.
These combination strategic is more to personal experiences and knowledges, it hard to adjust in coding for strategic position.
This is my first publication and I just do it for fun, having fun in reading the script and creating own ideas.
Information provided is only educational and sharing , should not be used to take action in the markets.
ALLinBull&Bear v9.0 STRATEGYEach of my Allin Custom Indicators combined, ads to your understanding where the Market could go next. Each of them have their own purpose and set of rules.
You will weight gathered information to get a better understanding of when to ENTER or EXIT a position (SHORT or LONG).
First you need to find the right Indicator Settings and the best preforming TimeFrame for chosen crypto or fiat pair. You will do that with a "STRATEGY" Indicator. I chose either 3min TF for highly liquid assets or 15min TF for assets of low liquidity but you can choose whatever you want to up to 30min TF.
Do not stop until you find 80% or more Precent Profitable result (test different setting on different TF for best results) in Strategy Tester. You can backtest your Strategy with different settings and in different TimeFames to find the very best results for that pair.
BACKTESTING past results does not guarantee your future results. BACKTESTING is used to fine-tune your indicator.
Example: with a guitar tuner (Strategy Tester in our case) you fine-tune your guitar (our Indicators in our case) so you know what tone the guitar will produce when you hit a certain note ("in-tuned" visual interpretation of the Market in our case). It is normal to get a 100% Precent Profitable result from backtesting with very little Drawdown. More than 80% and low drawdown usually means Indicators is "in-tune".
CUSTOM INDICATOR TYPE: STRATEGY
SETUP
There are five different settings. To use them efficiently you need to understand what is their purpose and meaning.
"2nd", "3rd" and "4th" FIELD
All of my custom indicators use data from 4 different TimeFrames. First TimeFrame is the one you picked in TradingView. Now you need to set up the other three TimeFrames. To do that you need to click on the "Settings" icon on this indicator and change the "2nd", "3rd" and "4th" field. The preferred setting I use to start searching for the best performing set of Settings is 2-8-32 OR 3-9-27 OR 4-16-64 OR 5-20-80. Those numbers are multiplication of chosen TimeFrame.
Example: setting 2-8-32 on a 5-minute TimeFrame means it will gather data from 5min TF, 10min TF (5minX2), 40min TF (5minX8) and 160min TF (5minX32).
Smoother FIELD
This Field is used to average down all that data indicator it is gathering from the price chart. I use integers like for example 9, 18, 27, and any number in between. It is connected to volatility. High Volatility needs Low Number and vice versa.
Threshold FIELD
This Field is used to cancel down all the mini signal confirmations that are false due to an insignificant influence on future price movements. This number is usually best at 21. When you set all other Fields and get satisfying results you can still try and fine-tune it even more and get even better results.
HOW TO USE IT
First, you have to choose your TimeFrame. I choose either 3min TF for highly liquid assets and 15min TF for assets of low liquidity but you can choose whatever you want to up to 30min TF. Example: if you chose 30min TimeFrame and you fill the "4th" Field with the number "80", one of observed TF by the indicator will be "30minX80" or "2400min" or "40h" TimeFrame, so it is HUGE.
It always depends based on the nature of the actual pair you are looking at. If it is very volatile with a lot of volume, the market beat for this pair settings is very different from another pair with for example very little volume and low volatility. So you need to find the right Indicator Settings at the right TimeFrame for each pair you are following. You are basically tuning your Indicator like you would tune your guitar so you know what to expect before hitting those "strings" of yours.
Find the best performing setting and TimeFrame with help from a TradingView feature called "Strategy Tester". Get familiar with this feature. But rule of thumb is: everything more than 80% Precent Profitable result with Max Drawdown (negative yield from the worst closed position) lower or similar to AvgTrade is considered good enough tuning of my Indicators.
You need to reevaluate your best setting whenever your last trade gets a negative result or something big (whale manipulation) happens on the market. You need to re-tune your Indicator so it will be in tune with the Market again. Check and try to find better performing (better Precent Profitable result, lower Drawdown) settings periodically every few days to find your best yielding results.
CUSTOM INDICATOR: BULL&BEAR
HOW TO READ IT
WHITE WAVY LINE AND TWO HORIZONTAL WHITE LINES
With this one just follow the existing rules when exiting an oversold or overbought area as in RSI,CCI or SRSI indicator. When combining with the signal colored lines in the background it then makes better sense if it is a false signal and it will turn back or it is the right signal and it will exit the oversold or overbought area and advance in that direction.
IN THE BACKGROUND: NINE COLORED LINES
Rule of thumb here is the more GREEN LINES you see the more LONG/BUY the Signal is and vice versa. It helps to look at those lines a few hours back to get the "feel" where the market is pushing the price. First (1), second (2) and seventh (7) line are the most important lines and they have to be aligned and prevailed in the same color to get a viable signal but it still needs to be confirmed with other Signals.
Before making any decisions based on visualisation you should refresh the page. Indicator is very data sensitive and needs that very last data for the most accurate visual representation of the Market.

ALLinOscillator v3.0 STRATEGYEach of my Allin Custom Indicators combined, ads to your understanding where the Market could go next. Each of them have their own purpose and set of rules.
You will weight gathered information to get a better understanding of when to ENTER or EXIT a position (SHORT or LONG).
First you need to find the right Indicator Settings and the best preforming TimeFrame for chosen crypto or fiat pair. You will do that with a "STRATEGY" Indicator. I chose either 3min TF for highly liquid assets or 15min TF for assets of low liquidity but you can choose whatever you want to up to 30min TF.
Do not stop until you find 80% or more Precent Profitable result (test different setting on different TF for best results) in Strategy Tester. You can backtest your Strategy with different settings and in different TimeFames to find the very best results for that pair.
BACKTESTING past results does not guarantee your future results. BACKTESTING is used to fine-tune your indicator.
Example: with a guitar tuner (Strategy Tester in our case) you fine-tune your guitar (our Indicators in our case) so you know what tone the guitar will produce when you hit a certain note ("in-tuned" visual interpretation of the Market in our case). It is normal to get a 100% Precent Profitable result from backtesting with very little Drawdown. More than 80% and low drawdown usually means Indicators is "in-tune".
CUSTOM INDICATOR TYPE: STRATEGY
SETUP
There are five different settings. To use them efficiently you need to understand what is their purpose and meaning.
"2nd", "3rd" and "4th" FIELD
All of my custom indicators use data from 4 different TimeFrames. First TimeFrame is the one you picked in TradingView. Now you need to set up the other three TimeFrames. To do that you need to click on the "Settings" icon on this indicator and change the "2nd", "3rd" and "4th" field. The preferred setting I use to start searching for the best performing set of Settings is 2-8-32 OR 3-9-27 OR 4-16-64 OR 5-20-80. Those numbers are multiplication of chosen TimeFrame.
Example: setting 2-8-32 on a 5-minute TimeFrame means it will gather data from 5min TF, 10min TF (5minX2), 40min TF (5minX8) and 160min TF (5minX32).
Smoother FIELD
This Field is used to average down all that data indicator it is gathering from the price chart. I use integers like for example 9, 18, 27, and any number in between. It is connected to volatility. High Volatility needs Low Number and vice versa.
Threshold FIELD
This Field is used to cancel down all the mini signal confirmations that are false due to an insignificant influence on future price movements. This number is usually best at 21. When you set all other Fields and get satisfying results you can still try and fine-tune it even more and get even better results.
HOW TO USE IT
First, you have to choose your TimeFrame. I choose either 3min TF for highly liquid assets and 15min TF for assets of low liquidity but you can choose whatever you want to up to 30min TF. Example: if you chose 30min TimeFrame and you fill the "4th" Field with the number "80", one of observed TF by the indicator will be "30minX80" or "2400min" or "40h" TimeFrame, so it is HUGE.
It always depends based on the nature of the actual pair you are looking at. If it is very volatile with a lot of volume, the market beat for this pair settings is very different from another pair with for example very little volume and low volatility. So you need to find the right Indicator Settings at the right TimeFrame for each pair you are following. You are basically tuning your Indicator like you would tune your guitar so you know what to expect before hitting those "strings" of yours.
Find the best performing setting and TimeFrame with help from a TradingView feature called "Strategy Tester". Get familiar with this feature. But rule of thumb is: everything more than 80% Precent Profitable result with Max Drawdown (negative yield from the worst closed position) lower or similar to AvgTrade is considered good enough tuning of my Indicators.
You need to reevaluate your best setting whenever your last trade gets a negative result or something big (whale manipulation) happens on the market. You need to re-tune your Indicator so it will be in tune with the Market again. Check and try to find better performing (better Precent Profitable result, lower Drawdown) settings periodically every few days to find your best yielding results.
CUSTOM INDICATOR: OSCILLATOR
HOW TO READ IT
GREEN AREA on the bottom and RED AREA on top are just like the oversold or overbought areas in RSI, CCI or SRSI and uses the same principle.
Example: when a WHITE wave line crosses-UP WHITE horizontal line in GREEN area it means that it is a LONG/BUY signal/confirmation. It needs to be confirmed with other confirmation signals in that same Indicator on in a "BULL&BEAR" Indicator to get better understanding that the price would not turn back down due to a false price move in UPWARDS direction.
GREEN or RED OSCILLATOR WAVE AREAS indicates the direction price is going and how strong the "force" behind the price move is.
Example: if WHITE LINE is over the RED/GREEN LINE the area turns GREEN and it is a LONG/BUY signal. When a shadow color is on the OTHER SIDE that means it is an added confirmation for a LONG/BUY position. When a SHADOW AREA is over the GREEN AREA and turns RED it usually means there are still forces pulling the price down.
Before making any decisions based on visualisation you should refresh the page. Indicator is very data sensitive and needs that very last data for the most accurate visual representation of the Market.

AllinStrategy v5.0 ::: Allin® MarketEnergy™You need two indicators for it to work: AllinTension 5.0 and AllinStrategy 5.0 and use them in synergy.
They measure and gather information and then present them in an intuitive way for better opportunity spotting and a better and quicker decision making about buy or sell entries in certain markets.
In works with crypto, stock, fiat and futures market.
I will explain how it works o a page but as a thumb rule: the more GREEN you see turning up like an energy the more LONG situation is and the more RED you see turning up like en energy the more SHORT the situation is.
The best thing about a product of mine is that it can be backtested. Results of backtesting yields up to 85% of accuracy and risk-reward ratio up to 5X or more.
Indicator - AllinTension 5.0
This indicator will enable you to actually feel the market on several levels. Exploiting informations from different timeframes and different oscillators with different setting and average them out.
With this indicator you will either confirm the sensed direction or you will skip the opportunity because signals are not properly aligned. To be able to resist FOMO is really crucial here. Opportunities are in abundance. There will be more. A lot more. Really.
How to read it and properly use it?
For more in depth understanding on how it works and proper usage of it. There is lot of information on the page.
Strategy: AllinStrategy 5.0
This strategy indicator is used as a backtesting platform for different types of various settings for a selected pair.
Backtesting means you can test each TimeFrame (best 1-9min) with various AllinTension indicator settings. You will get a result for profitability in the last period (but it is not that important anything but for maybe feeling bad you missed it), success rate in percent (anything above 70% is good enough) and you have to watch the ratio of the max dropdown and average trade size (least acceptable is -5x, better is 2x or less).
So you will learn which strategy (TF and indicator setting) has steadily preformed best while being profitable in the past and assume it will do that in the same manner with same accuracy in the future. It sometimes changes so you need to preform rutine testing after some bigger market movements.
With this you will find the best preforming TImeFrame for each window. You will adjust settings for each window differently to diversify view on the market. My personal best setting are for the first window 4-16-64, second window 3-9-27, third window 2-8-32 and forth last window 5-20-80.
So ALLinStrategy is a visual representation of the market and the most important thing, it includes a feature "Strategy Tester" to backtest chosen strategy. The results may surprise you and they can all be proven!:) So what do you do in this case? :):)
But to really understand the market and given signals from this Strategy, you will need indicator ALLinTension or you are going blindfolded guess trading.
How to read it and properly use it?
For more in depth understanding on how it works and proper usage of it There is lot of information on the page.
For strategy to work you first have to find profitable and accurate enough TF (more than 70% should do the trick)and indicator settings (there are some favourites) and apply it to your executing strategy.

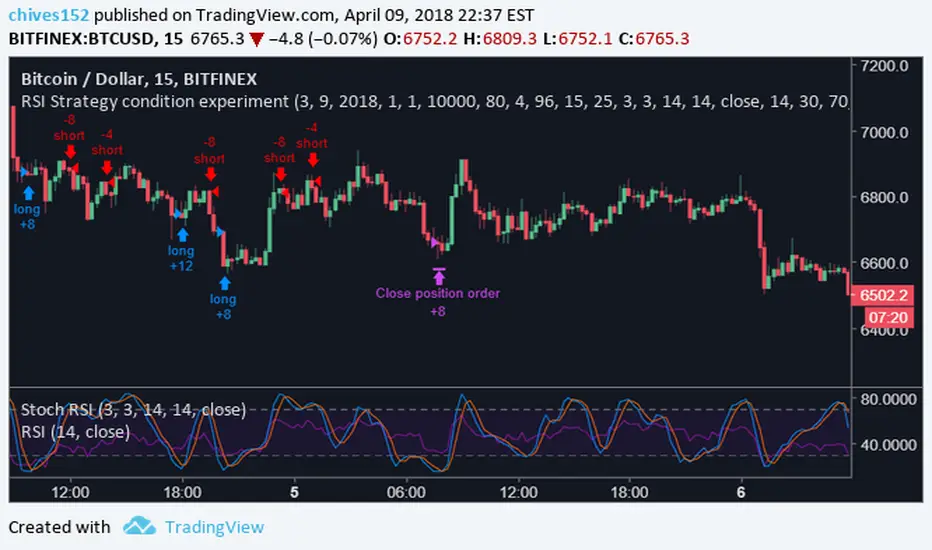
RSI Strategy condition experimentThis is a scalping indicator built for bitcoin on the 15m chart. It uses ADX and SRSI. A full indicator will be released very soon. Please comment with any questions or comments. The strategy ran below is the results if you started trading on 3/9/2018 with 10,000$ usd, and used 100% of your equity to enter positions. This is also designed to allow 2x leverage when certain conditions are met, which is the default. This feature can be turned off in settings.