GKD-C EP SSA of Normalized Price [Loxx]The Giga Kaleidoscope GKD-C EP SSA of Normalized Price is a confirmation module included in Loxx's "Giga Kaleidoscope Modularized Trading System."
█ GKD-C End Pointed SSA of Normalized Price
Caterpillar SSA is a variant of Singular Spectrum Analysis (SSA) that is specifically designed for time series with missing values. It is a non-parametric method that decomposes a time series into a set of interpretable components, each having a meaningful interpretation. These components can then be used for a variety of machine learning tasks, such as:
Forecasting: By identifying the trend and seasonality components of a time series, Caterpillar SSA can be used to forecast future values.
Anomaly detection: By identifying unusual spikes or dips in a time series, Caterpillar SSA can be used to detect anomalies.
Feature extraction: The components extracted by Caterpillar SSA can be used as features for other machine learning models, such as neural networks.
In addition to its ability to handle missing values, Caterpillar SSA is also a relatively computationally efficient method. This makes it a good choice for large and complex time series datasets.
Here are some examples of how Caterpillar SSA has been used in machine learning:
In a study of financial markets, Caterpillar SSA was used to forecast stock prices. The results showed that the method was able to improve forecasting accuracy over traditional methods.
2017 paper by Danilov, Zhigljavsky, and Nekrutkin entitled "Caterpillar SSA: A New Tool for Forecasting Financial Time Series." The paper can be found here: arxiv.org
In a study of climate data, Caterpillar SSA was used to detect anomalous weather patterns. The results showed that the method was able to identify patterns that were not visible to the naked eye.
2018 paper by Wang, Zhang, and Wang entitled "Caterpillar SSA for Anomaly Detection in Climate Data." The paper can be found here: arxiv.org
In a study of sensor data, Caterpillar SSA was used to extract features for a machine learning model that was used to classify different types of objects. The results showed that the method was able to extract features that were more informative than those extracted by traditional methods.
2019 paper by Zhang, Zhou, and Zhang entitled "Caterpillar SSA for Feature Extraction in Sensor Data." The paper can be found here: arxiv.org
Caterpillar SSA is a powerful tool that can be used for a variety of machine learning tasks. It is particularly well-suited for time series datasets with missing values.
For our purposes here, SSA is used to create a smoothed oscillator of price. This indicator requires a lot of processing power and as such this indicator is restricted to XX bars back so that it will even load on the screen.
█ Giga Kaleidoscope Modularized Trading System
Core components of an NNFX algorithmic trading strategy
The NNFX algorithm is built on the principles of trend, momentum, and volatility. There are six core components in the NNFX trading algorithm:
1. Volatility - price volatility; e.g., Average True Range, True Range Double, Close-to-Close, etc.
2. Baseline - a moving average to identify price trend
3. Confirmation 1 - a technical indicator used to identify trends
4. Confirmation 2 - a technical indicator used to identify trends
5. Continuation - a technical indicator used to identify trends
6. Volatility/Volume - a technical indicator used to identify volatility/volume breakouts/breakdown
7. Exit - a technical indicator used to determine when a trend is exhausted
8. Metamorphosis - a technical indicator that produces a compound signal from the combination of other GKD indicators*
*(not part of the NNFX algorithm)
What is Volatility in the NNFX trading system?
In the NNFX (No Nonsense Forex) trading system, ATR (Average True Range) is typically used to measure the volatility of an asset. It is used as a part of the system to help determine the appropriate stop loss and take profit levels for a trade. ATR is calculated by taking the average of the true range values over a specified period.
True range is calculated as the maximum of the following values:
-Current high minus the current low
-Absolute value of the current high minus the previous close
-Absolute value of the current low minus the previous close
ATR is a dynamic indicator that changes with changes in volatility. As volatility increases, the value of ATR increases, and as volatility decreases, the value of ATR decreases. By using ATR in NNFX system, traders can adjust their stop loss and take profit levels according to the volatility of the asset being traded. This helps to ensure that the trade is given enough room to move, while also minimizing potential losses.
Other types of volatility include True Range Double (TRD), Close-to-Close, and Garman-Klass
What is a Baseline indicator?
The baseline is essentially a moving average, and is used to determine the overall direction of the market.
The baseline in the NNFX system is used to filter out trades that are not in line with the long-term trend of the market. The baseline is plotted on the chart along with other indicators, such as the Moving Average (MA), the Relative Strength Index (RSI), and the Average True Range (ATR).
Trades are only taken when the price is in the same direction as the baseline. For example, if the baseline is sloping upwards, only long trades are taken, and if the baseline is sloping downwards, only short trades are taken. This approach helps to ensure that trades are in line with the overall trend of the market, and reduces the risk of entering trades that are likely to fail.
By using a baseline in the NNFX system, traders can have a clear reference point for determining the overall trend of the market, and can make more informed trading decisions. The baseline helps to filter out noise and false signals, and ensures that trades are taken in the direction of the long-term trend.
What is a Confirmation indicator?
Confirmation indicators are technical indicators that are used to confirm the signals generated by primary indicators. Primary indicators are the core indicators used in the NNFX system, such as the Average True Range (ATR), the Moving Average (MA), and the Relative Strength Index (RSI).
The purpose of the confirmation indicators is to reduce false signals and improve the accuracy of the trading system. They are designed to confirm the signals generated by the primary indicators by providing additional information about the strength and direction of the trend.
Some examples of confirmation indicators that may be used in the NNFX system include the Bollinger Bands, the MACD (Moving Average Convergence Divergence), and the MACD Oscillator. These indicators can provide information about the volatility, momentum, and trend strength of the market, and can be used to confirm the signals generated by the primary indicators.
In the NNFX system, confirmation indicators are used in combination with primary indicators and other filters to create a trading system that is robust and reliable. By using multiple indicators to confirm trading signals, the system aims to reduce the risk of false signals and improve the overall profitability of the trades.
What is a Continuation indicator?
In the NNFX (No Nonsense Forex) trading system, a continuation indicator is a technical indicator that is used to confirm a current trend and predict that the trend is likely to continue in the same direction. A continuation indicator is typically used in conjunction with other indicators in the system, such as a baseline indicator, to provide a comprehensive trading strategy.
What is a Volatility/Volume indicator?
Volume indicators, such as the On Balance Volume (OBV), the Chaikin Money Flow (CMF), or the Volume Price Trend (VPT), are used to measure the amount of buying and selling activity in a market. They are based on the trading volume of the market, and can provide information about the strength of the trend. In the NNFX system, volume indicators are used to confirm trading signals generated by the Moving Average and the Relative Strength Index. Volatility indicators include Average Direction Index, Waddah Attar, and Volatility Ratio. In the NNFX trading system, volatility is a proxy for volume and vice versa.
By using volume indicators as confirmation tools, the NNFX trading system aims to reduce the risk of false signals and improve the overall profitability of trades. These indicators can provide additional information about the market that is not captured by the primary indicators, and can help traders to make more informed trading decisions. In addition, volume indicators can be used to identify potential changes in market trends and to confirm the strength of price movements.
What is an Exit indicator?
The exit indicator is used in conjunction with other indicators in the system, such as the Moving Average (MA), the Relative Strength Index (RSI), and the Average True Range (ATR), to provide a comprehensive trading strategy.
The exit indicator in the NNFX system can be any technical indicator that is deemed effective at identifying optimal exit points. Examples of exit indicators that are commonly used include the Parabolic SAR, the Average Directional Index (ADX), and the Chandelier Exit.
The purpose of the exit indicator is to identify when a trend is likely to reverse or when the market conditions have changed, signaling the need to exit a trade. By using an exit indicator, traders can manage their risk and prevent significant losses.
In the NNFX system, the exit indicator is used in conjunction with a stop loss and a take profit order to maximize profits and minimize losses. The stop loss order is used to limit the amount of loss that can be incurred if the trade goes against the trader, while the take profit order is used to lock in profits when the trade is moving in the trader's favor.
Overall, the use of an exit indicator in the NNFX trading system is an important component of a comprehensive trading strategy. It allows traders to manage their risk effectively and improve the profitability of their trades by exiting at the right time.
What is an Metamorphosis indicator?
The concept of a metamorphosis indicator involves the integration of two or more GKD indicators to generate a compound signal. This is achieved by evaluating the accuracy of each indicator and selecting the signal from the indicator with the highest accuracy. As an illustration, let's consider a scenario where we calculate the accuracy of 10 indicators and choose the signal from the indicator that demonstrates the highest accuracy.
The resulting output from the metamorphosis indicator can then be utilized in a GKD-BT backtest by occupying a slot that aligns with the purpose of the metamorphosis indicator. The slot can be a GKD-B, GKD-C, or GKD-E slot, depending on the specific requirements and objectives of the indicator. This allows for seamless integration and utilization of the compound signal within the GKD-BT framework.
How does Loxx's GKD (Giga Kaleidoscope Modularized Trading System) implement the NNFX algorithm outlined above?
Loxx's GKD v2.0 system has five types of modules (indicators/strategies). These modules are:
1. GKD-BT - Backtesting module (Volatility, Number 1 in the NNFX algorithm)
2. GKD-B - Baseline module (Baseline and Volatility/Volume, Numbers 1 and 2 in the NNFX algorithm)
3. GKD-C - Confirmation 1/2 and Continuation module (Confirmation 1/2 and Continuation, Numbers 3, 4, and 5 in the NNFX algorithm)
4. GKD-V - Volatility/Volume module (Confirmation 1/2, Number 6 in the NNFX algorithm)
5. GKD-E - Exit module (Exit, Number 7 in the NNFX algorithm)
6. GKD-M - Metamorphosis module (Metamorphosis, Number 8 in the NNFX algorithm, but not part of the NNFX algorithm)
(additional module types will added in future releases)
Each module interacts with every module by passing data to A backtest module wherein the various components of the GKD system are combined to create a trading signal.
That is, the Baseline indicator passes its data to Volatility/Volume. The Volatility/Volume indicator passes its values to the Confirmation 1 indicator. The Confirmation 1 indicator passes its values to the Confirmation 2 indicator. The Confirmation 2 indicator passes its values to the Continuation indicator. The Continuation indicator passes its values to the Exit indicator, and finally, the Exit indicator passes its values to the Backtest strategy.
This chaining of indicators requires that each module conform to Loxx's GKD protocol, therefore allowing for the testing of every possible combination of technical indicators that make up the six components of the NNFX algorithm.
What does the application of the GKD trading system look like?
Example trading system:
Backtest: Multi-Ticker CC Backtest
Baseline: Hull Moving Average
Volatility/Volume: Hurst Exponent
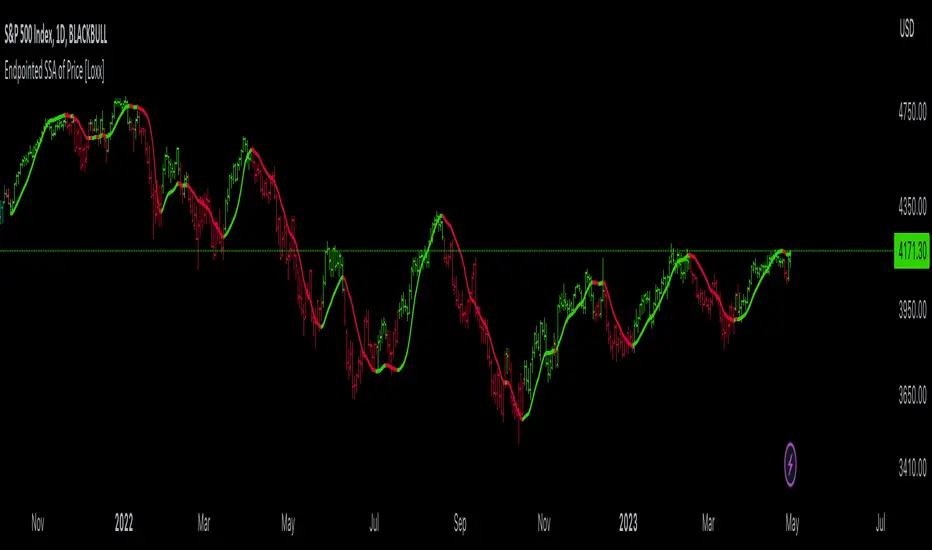
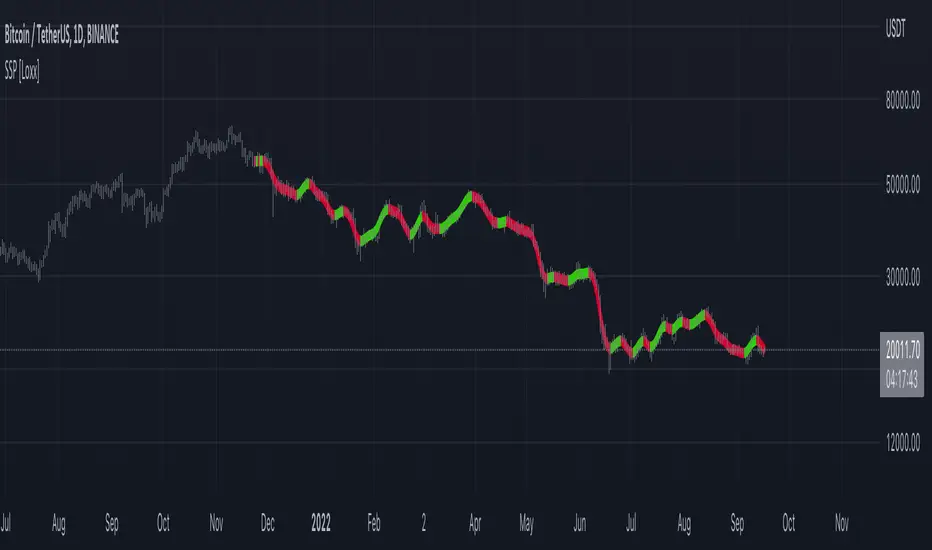
Confirmation 1: EP SSA of Normalized Price as shown on the chart above
Confirmation 2: uf2018
Continuation: Coppock Curve
Exit: Rex Oscillator
Metamorphosis: Baseline Optimizer
Each GKD indicator is denoted with a module identifier of either: GKD-BT, GKD-B, GKD-C, GKD-V, GKD-M, or GKD-E. This allows traders to understand to which module each indicator belongs and where each indicator fits into the GKD system.
█ Giga Kaleidoscope Modularized Trading System Signals
Standard Entry
1. GKD-C Confirmation gives signal
2. Baseline agrees
3. Price inside Goldie Locks Zone Minimum
4. Price inside Goldie Locks Zone Maximum
5. Confirmation 2 agrees
6. Volatility/Volume agrees
1-Candle Standard Entry
1a. GKD-C Confirmation gives signal
2a. Baseline agrees
3a. Price inside Goldie Locks Zone Minimum
4a. Price inside Goldie Locks Zone Maximum
Next Candle
1b. Price retraced
2b. Baseline agrees
3b. Confirmation 1 agrees
4b. Confirmation 2 agrees
5b. Volatility/Volume agrees
Baseline Entry
1. GKD-B Baseline gives signal
2. Confirmation 1 agrees
3. Price inside Goldie Locks Zone Minimum
4. Price inside Goldie Locks Zone Maximum
5. Confirmation 2 agrees
6. Volatility/Volume agrees
7. Confirmation 1 signal was less than 'Maximum Allowable PSBC Bars Back' prior
1-Candle Baseline Entry
1a. GKD-B Baseline gives signal
2a. Confirmation 1 agrees
3a. Price inside Goldie Locks Zone Minimum
4a. Price inside Goldie Locks Zone Maximum
5a. Confirmation 1 signal was less than 'Maximum Allowable PSBC Bars Back' prior
Next Candle
1b. Price retraced
2b. Baseline agrees
3b. Confirmation 1 agrees
4b. Confirmation 2 agrees
5b. Volatility/Volume agrees
Volatility/Volume Entry
1. GKD-V Volatility/Volume gives signal
2. Confirmation 1 agrees
3. Price inside Goldie Locks Zone Minimum
4. Price inside Goldie Locks Zone Maximum
5. Confirmation 2 agrees
6. Baseline agrees
7. Confirmation 1 signal was less than 7 candles prior
1-Candle Volatility/Volume Entry
1a. GKD-V Volatility/Volume gives signal
2a. Confirmation 1 agrees
3a. Price inside Goldie Locks Zone Minimum
4a. Price inside Goldie Locks Zone Maximum
5a. Confirmation 1 signal was less than 'Maximum Allowable PSVVC Bars Back' prior
Next Candle
1b. Price retraced
2b. Volatility/Volume agrees
3b. Confirmation 1 agrees
4b. Confirmation 2 agrees
5b. Baseline agrees
Confirmation 2 Entry
1. GKD-C Confirmation 2 gives signal
2. Confirmation 1 agrees
3. Price inside Goldie Locks Zone Minimum
4. Price inside Goldie Locks Zone Maximum
5. Volatility/Volume agrees
6. Baseline agrees
7. Confirmation 1 signal was less than 7 candles prior
1-Candle Confirmation 2 Entry
1a. GKD-C Confirmation 2 gives signal
2a. Confirmation 1 agrees
3a. Price inside Goldie Locks Zone Minimum
4a. Price inside Goldie Locks Zone Maximum
5a. Confirmation 1 signal was less than 'Maximum Allowable PSC2C Bars Back' prior
Next Candle
1b. Price retraced
2b. Confirmation 2 agrees
3b. Confirmation 1 agrees
4b. Volatility/Volume agrees
5b. Baseline agrees
PullBack Entry
1a. GKD-B Baseline gives signal
2a. Confirmation 1 agrees
3a. Price is beyond 1.0x Volatility of Baseline
Next Candle
1b. Price inside Goldie Locks Zone Minimum
2b. Price inside Goldie Locks Zone Maximum
3b. Confirmation 1 agrees
4b. Confirmation 2 agrees
5b. Volatility/Volume agrees
Continuation Entry
1. Standard Entry, 1-Candle Standard Entry, Baseline Entry, 1-Candle Baseline Entry, Volatility/Volume Entry, 1-Candle Volatility/Volume Entry, Confirmation 2 Entry, 1-Candle Confirmation 2 Entry, or Pullback entry triggered previously
2. Baseline hasn't crossed since entry signal trigger
4. Confirmation 1 agrees
5. Baseline agrees
6. Confirmation 2 agrees
SSA

Endpointed SSA of Price [Loxx]The Endpointed SSA of Price: A Comprehensive Tool for Market Analysis and Decision-Making
The financial markets present sophisticated challenges for traders and investors as they navigate the complexities of market behavior. To effectively interpret and capitalize on these complexities, it is crucial to employ powerful analytical tools that can reveal hidden patterns and trends. One such tool is the Endpointed SSA of Price, which combines the strengths of Caterpillar Singular Spectrum Analysis, a sophisticated time series decomposition method, with insights from the fields of economics, artificial intelligence, and machine learning.
The Endpointed SSA of Price has its roots in the interdisciplinary fusion of mathematical techniques, economic understanding, and advancements in artificial intelligence. This unique combination allows for a versatile and reliable tool that can aid traders and investors in making informed decisions based on comprehensive market analysis.
The Endpointed SSA of Price is not only valuable for experienced traders but also serves as a useful resource for those new to the financial markets. By providing a deeper understanding of market forces, this innovative indicator equips users with the knowledge and confidence to better assess risks and opportunities in their financial pursuits.
█ Exploring Caterpillar SSA: Applications in AI, Machine Learning, and Finance
Caterpillar SSA (Singular Spectrum Analysis) is a non-parametric method for time series analysis and signal processing. It is based on a combination of principles from classical time series analysis, multivariate statistics, and the theory of random processes. The method was initially developed in the early 1990s by a group of Russian mathematicians, including Golyandina, Nekrutkin, and Zhigljavsky.
Background Information:
SSA is an advanced technique for decomposing time series data into a sum of interpretable components, such as trend, seasonality, and noise. This decomposition allows for a better understanding of the underlying structure of the data and facilitates forecasting, smoothing, and anomaly detection. Caterpillar SSA is a particular implementation of SSA that has proven to be computationally efficient and effective for handling large datasets.
Uses in AI and Machine Learning:
In recent years, Caterpillar SSA has found applications in various fields of artificial intelligence (AI) and machine learning. Some of these applications include:
1. Feature extraction: Caterpillar SSA can be used to extract meaningful features from time series data, which can then serve as inputs for machine learning models. These features can help improve the performance of various models, such as regression, classification, and clustering algorithms.
2. Dimensionality reduction: Caterpillar SSA can be employed as a dimensionality reduction technique, similar to Principal Component Analysis (PCA). It helps identify the most significant components of a high-dimensional dataset, reducing the computational complexity and mitigating the "curse of dimensionality" in machine learning tasks.
3. Anomaly detection: The decomposition of a time series into interpretable components through Caterpillar SSA can help in identifying unusual patterns or outliers in the data. Machine learning models trained on these decomposed components can detect anomalies more effectively, as the noise component is separated from the signal.
4. Forecasting: Caterpillar SSA has been used in combination with machine learning techniques, such as neural networks, to improve forecasting accuracy. By decomposing a time series into its underlying components, machine learning models can better capture the trends and seasonality in the data, resulting in more accurate predictions.
Application in Financial Markets and Economics:
Caterpillar SSA has been employed in various domains within financial markets and economics. Some notable applications include:
1. Stock price analysis: Caterpillar SSA can be used to analyze and forecast stock prices by decomposing them into trend, seasonal, and noise components. This decomposition can help traders and investors better understand market dynamics, detect potential turning points, and make more informed decisions.
2. Economic indicators: Caterpillar SSA has been used to analyze and forecast economic indicators, such as GDP, inflation, and unemployment rates. By decomposing these time series, researchers can better understand the underlying factors driving economic fluctuations and develop more accurate forecasting models.
3. Portfolio optimization: By applying Caterpillar SSA to financial time series data, portfolio managers can better understand the relationships between different assets and make more informed decisions regarding asset allocation and risk management.
Application in the Indicator:
In the given indicator, Caterpillar SSA is applied to a financial time series (price data) to smooth the series and detect significant trends or turning points. The method is used to decompose the price data into a set number of components, which are then combined to generate a smoothed signal. This signal can help traders and investors identify potential entry and exit points for their trades.
The indicator applies the Caterpillar SSA method by first constructing the trajectory matrix using the price data, then computing the singular value decomposition (SVD) of the matrix, and finally reconstructing the time series using a selected number of components. The reconstructed series serves as a smoothed version of the original price data, highlighting significant trends and turning points. The indicator can be customized by adjusting the lag, number of computations, and number of components used in the reconstruction process. By fine-tuning these parameters, traders and investors can optimize the indicator to better match their specific trading style and risk tolerance.
Caterpillar SSA is versatile and can be applied to various types of financial instruments, such as stocks, bonds, commodities, and currencies. It can also be combined with other technical analysis tools or indicators to create a comprehensive trading system. For example, a trader might use Caterpillar SSA to identify the primary trend in a market and then employ additional indicators, such as moving averages or RSI, to confirm the trend and generate trading signals.
In summary, Caterpillar SSA is a powerful time series analysis technique that has found applications in AI and machine learning, as well as financial markets and economics. By decomposing a time series into interpretable components, Caterpillar SSA enables better understanding of the underlying structure of the data, facilitating forecasting, smoothing, and anomaly detection. In the context of financial trading, the technique is used to analyze price data, detect significant trends or turning points, and inform trading decisions.
█ Input Parameters
This indicator takes several inputs that affect its signal output. These inputs can be classified into three categories: Basic Settings, UI Options, and Computation Parameters.
Source: This input represents the source of price data, which is typically the closing price of an asset. The user can select other price data, such as opening price, high price, or low price. The selected price data is then utilized in the Caterpillar SSA calculation process.
Lag: The lag input determines the window size used for the time series decomposition. A higher lag value implies that the SSA algorithm will consider a longer range of historical data when extracting the underlying trend and components. This parameter is crucial, as it directly impacts the resulting smoothed series and the quality of extracted components.
Number of Computations: This input, denoted as 'ncomp,' specifies the number of eigencomponents to be considered in the reconstruction of the time series. A smaller value results in a smoother output signal, while a higher value retains more details in the series, potentially capturing short-term fluctuations.
SSA Period Normalization: This input is used to normalize the SSA period, which adjusts the significance of each eigencomponent to the overall signal. It helps in making the algorithm adaptive to different timeframes and market conditions.
Number of Bars: This input specifies the number of bars to be processed by the algorithm. It controls the range of data used for calculations and directly affects the computation time and the output signal.
Number of Bars to Render: This input sets the number of bars to be plotted on the chart. A higher value slows down the computation but provides a more comprehensive view of the indicator's performance over a longer period. This value controls how far back the indicator is rendered.
Color bars: This boolean input determines whether the bars should be colored according to the signal's direction. If set to true, the bars are colored using the defined colors, which visually indicate the trend direction.
Show signals: This boolean input controls the display of buy and sell signals on the chart. If set to true, the indicator plots shapes (triangles) to represent long and short trade signals.
Static Computation Parameters:
The indicator also includes several internal parameters that affect the Caterpillar SSA algorithm, such as Maxncomp, MaxLag, and MaxArrayLength. These parameters set the maximum allowed values for the number of computations, the lag, and the array length, ensuring that the calculations remain within reasonable limits and do not consume excessive computational resources.
█ A Note on Endpionted, Non-repainting Indicators
An endpointed indicator is one that does not recalculate or repaint its past values based on new incoming data. In other words, the indicator's previous signals remain the same even as new price data is added. This is an important feature because it ensures that the signals generated by the indicator are reliable and accurate, even after the fact.
When an indicator is non-repainting or endpointed, it means that the trader can have confidence in the signals being generated, knowing that they will not change as new data comes in. This allows traders to make informed decisions based on historical signals, without the fear of the signals being invalidated in the future.
In the case of the Endpointed SSA of Price, this non-repainting property is particularly valuable because it allows traders to identify trend changes and reversals with a high degree of accuracy, which can be used to inform trading decisions. This can be especially important in volatile markets where quick decisions need to be made.
End-Pointed SSA of Normalized Price Corridor [Loxx]End-Pointed SSA of Normalized Price Corridor is an end-pointed SSA of normalized input price to output a smoothed normalized oscillator of price. Corridors are added in attempt to decipher larger trend direction of price. These corridor trend lines are based on highs and lows of price. Due to the SSA algorithm, this indicator takes some time load on the chat, so be patient. You can adjust the lag parameter downward to speed up the indicator load time but this will also degrade the signal. There are many different ways to use this indicator. It is also Renko chart friendly.
An example of emerging trends (these do not repaint)
What is Singular Spectrum Analysis ( SSA )?
Singular spectrum analysis ( SSA ) is a technique of time series analysis and forecasting. It combines elements of classical time series analysis, multivariate statistics, multivariate geometry, dynamical systems and signal processing. SSA aims at decomposing the original series into a sum of a small number of interpretable components such as a slowly varying trend, oscillatory components and a ‘structureless’ noise. It is based on the singular value decomposition ( SVD ) of a specific matrix constructed upon the time series. Neither a parametric model nor stationarity-type conditions have to be assumed for the time series. This makes SSA a model-free method and hence enables SSA to have a very wide range of applicability.
For our purposes here, we are only concerned with the "Caterpillar" SSA . This methodology was developed in the former Soviet Union independently (the ‘iron curtain effect’) of the mainstream SSA . The main difference between the main-stream SSA and the "Caterpillar" SSA is not in the algorithmic details but rather in the assumptions and in the emphasis in the study of SSA properties. To apply the mainstream SSA , one often needs to assume some kind of stationarity of the time series and think in terms of the "signal plus noise" model (where the noise is often assumed to be ‘red’). In the "Caterpillar" SSA , the main methodological stress is on separability (of one component of the series from another one) and neither the assumption of stationarity nor the model in the form "signal plus noise" are required.
"Caterpillar" SSA
The basic "Caterpillar" SSA algorithm for analyzing one-dimensional time series consists of:
Transformation of the one-dimensional time series to the trajectory matrix by means of a delay procedure (this gives the name to the whole technique);
Singular Value Decomposition of the trajectory matrix;
Reconstruction of the original time series based on a number of selected eigenvectors.
This decomposition initializes forecasting procedures for both the original time series and its components. The method can be naturally extended to multidimensional time series and to image processing.
The method is a powerful and useful tool of time series analysis in meteorology, hydrology, geophysics, climatology and, according to our experience, in economics, biology, physics, medicine and other sciences; that is, where short and long, one-dimensional and multidimensional, stationary and non-stationary, almost deterministic and noisy time series are to be analyzed.
Included
Bar coloring
Signals
Alerts
Loxx's Expanded Source Types

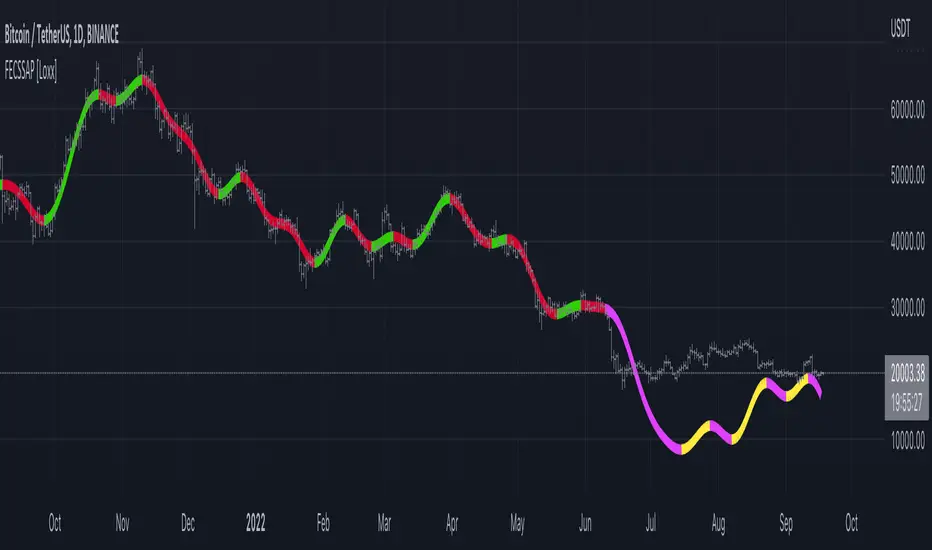
Fourier Extrapolator of 'Caterpillar' SSA of Price [Loxx]Fourier Extrapolator of 'Caterpillar' SSA of Price is a forecasting indicator that applies Singular Spectrum Analysis to input price and then injects that transformed value into the Quinn-Fernandes Fourier Transform algorithm to generate a price forecast. The indicator plots two curves: the green/red curve indicates modeled past values and the yellow/fuchsia dotted curve indicates the future extrapolated values.
What is the Fourier Transform Extrapolator of price?
Fourier Extrapolator of Price is a multi-harmonic (or multi-tone) trigonometric model of a price series xi, i=1..n, is given by:
xi = m + Sum( a*Cos(w*i) + b*Sin(w*i), h=1..H )
Where:
xi - past price at i-th bar, total n past prices;
m - bias;
a and b - scaling coefficients of harmonics;
w - frequency of a harmonic ;
h - harmonic number;
H - total number of fitted harmonics.
Fitting this model means finding m, a, b, and w that make the modeled values to be close to real values. Finding the harmonic frequencies w is the most difficult part of fitting a trigonometric model. In the case of a Fourier series, these frequencies are set at 2*pi*h/n. But, the Fourier series extrapolation means simply repeating the n past prices into the future.
Quinn-Fernandes algorithm find sthe harmonic frequencies. It fits harmonics of the trigonometric series one by one until the specified total number of harmonics H is reached. After fitting a new harmonic , the coded algorithm computes the residue between the updated model and the real values and fits a new harmonic to the residue.
see here: A Fast Efficient Technique for the Estimation of Frequency , B. G. Quinn and J. M. Fernandes, Biometrika, Vol. 78, No. 3 (Sep., 1991), pp . 489-497 (9 pages) Published By: Oxford University Press
Fourier Transform Extrapolator of Price inputs are as follows:
npast - number of past bars, to which trigonometric series is fitted;
nharm - total number of harmonics in model;
frqtol - tolerance of frequency calculations.
What is Singular Spectrum Analysis ( SSA )?
Singular spectrum analysis ( SSA ) is a technique of time series analysis and forecasting. It combines elements of classical time series analysis, multivariate statistics, multivariate geometry, dynamical systems and signal processing. SSA aims at decomposing the original series into a sum of a small number of interpretable components such as a slowly varying trend, oscillatory components and a ‘structureless’ noise. It is based on the singular value decomposition ( SVD ) of a specific matrix constructed upon the time series. Neither a parametric model nor stationarity-type conditions have to be assumed for the time series. This makes SSA a model-free method and hence enables SSA to have a very wide range of applicability.
For our purposes here, we are only concerned with the "Caterpillar" SSA . This methodology was developed in the former Soviet Union independently (the ‘iron curtain effect’) of the mainstream SSA . The main difference between the main-stream SSA and the "Caterpillar" SSA is not in the algorithmic details but rather in the assumptions and in the emphasis in the study of SSA properties. To apply the mainstream SSA , one often needs to assume some kind of stationarity of the time series and think in terms of the "signal plus noise" model (where the noise is often assumed to be ‘red’). In the "Caterpillar" SSA , the main methodological stress is on separability (of one component of the series from another one) and neither the assumption of stationarity nor the model in the form "signal plus noise" are required.
"Caterpillar" SSA
The basic "Caterpillar" SSA algorithm for analyzing one-dimensional time series consists of:
Transformation of the one-dimensional time series to the trajectory matrix by means of a delay procedure (this gives the name to the whole technique);
Singular Value Decomposition of the trajectory matrix;
Reconstruction of the original time series based on a number of selected eigenvectors.
This decomposition initializes forecasting procedures for both the original time series and its components. The method can be naturally extended to multidimensional time series and to image processing.
The method is a powerful and useful tool of time series analysis in meteorology, hydrology, geophysics, climatology and, according to our experience, in economics, biology, physics, medicine and other sciences; that is, where short and long, one-dimensional and multidimensional, stationary and non-stationary, almost deterministic and noisy time series are to be analyzed.
"Caterpillar" SSA inputs are as follows:
lag - How much lag to introduce into the SSA algorithm, the higher this number the slower the process and smoother the signal
ncomp - Number of Computations or cycles of of the SSA algorithm; the higher the slower
ssapernorm - SSA Period Normalization
numbars =- number of past bars, to which SSA is fitted
Included:
Bar coloring
Alerts
Signals
Loxx's Expanded Source Types
Related Fourier Transform Indicators
Real-Fast Fourier Transform of Price w/ Linear Regression
Fourier Extrapolator of Variety RSI w/ Bollinger Bands
Fourier Extrapolator of Price w/ Projection Forecast
Related Projection Forecast Indicators
Itakura-Saito Autoregressive Extrapolation of Price
Helme-Nikias Weighted Burg AR-SE Extra. of Price
Related SSA Indicators
End-pointed SSA of FDASMA
End-pointed SSA of Williams %R
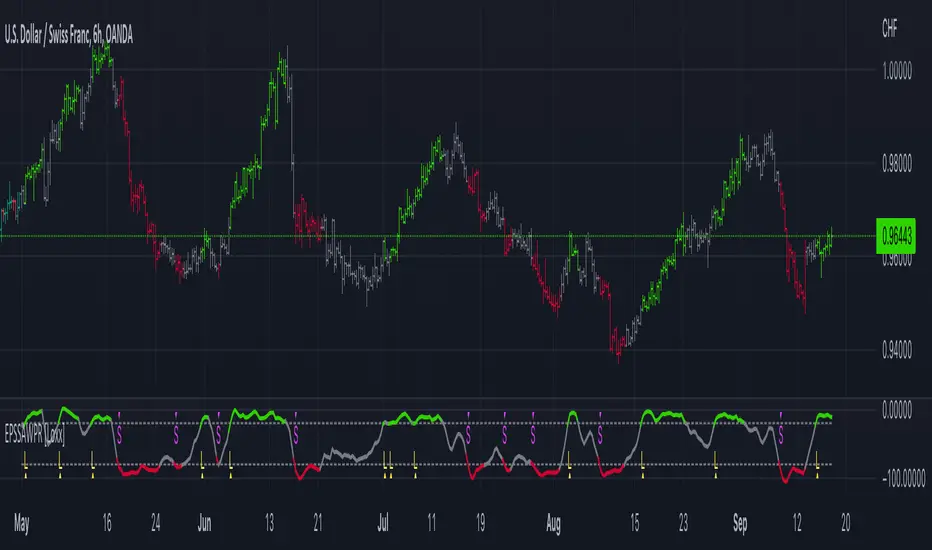
End-pointed SSA of Williams %R [Loxx]End-pointed SSA of Williams %R is an indicator that runes Williams %R SSA calculation through a Singular Spectrum Analysis (SSA) algorithm to derive a smoother final output. The reduction in noise from the traditional Williams %R is significant.
What is Williams %R?
Williams %R , also known as the Williams Percent Range, is a type of momentum indicator that moves between 0 and -100 and measures overbought and oversold levels. The Williams %R may be used to find entry and exit points in the market. The indicator is very similar to the Stochastic oscillator and is used in the same way. It was developed by Larry Williams and it compares a stock’s closing price to the high-low range over a specific period, typically 14 days or periods.
What is Singular Spectrum Analysis ( SSA )?
Singular spectrum analysis ( SSA ) is a technique of time series analysis and forecasting. It combines elements of classical time series analysis, multivariate statistics, multivariate geometry, dynamical systems and signal processing. SSA aims at decomposing the original series into a sum of a small number of interpretable components such as a slowly varying trend, oscillatory components and a ‘structureless’ noise. It is based on the singular value decomposition ( SVD ) of a specific matrix constructed upon the time series. Neither a parametric model nor stationarity-type conditions have to be assumed for the time series. This makes SSA a model-free method and hence enables SSA to have a very wide range of applicability.
For our purposes here, we are only concerned with the "Caterpillar" SSA . This methodology was developed in the former Soviet Union independently (the ‘iron curtain effect’) of the mainstream SSA . The main difference between the main-stream SSA and the "Caterpillar" SSA is not in the algorithmic details but rather in the assumptions and in the emphasis in the study of SSA properties. To apply the mainstream SSA , one often needs to assume some kind of stationarity of the time series and think in terms of the "signal plus noise" model (where the noise is often assumed to be ‘red’). In the "Caterpillar" SSA , the main methodological stress is on separability (of one component of the series from another one) and neither the assumption of stationarity nor the model in the form "signal plus noise" are required.
"Caterpillar" SSA
The basic "Caterpillar" SSA algorithm for analyzing one-dimensional time series consists of:
Transformation of the one-dimensional time series to the trajectory matrix by means of a delay procedure (this gives the name to the whole technique);
Singular Value Decomposition of the trajectory matrix;
Reconstruction of the original time series based on a number of selected eigenvectors.
This decomposition initializes forecasting procedures for both the original time series and its components. The method can be naturally extended to multidimensional time series and to image processing.
The method is a powerful and useful tool of time series analysis in meteorology, hydrology, geophysics, climatology and, according to our experience, in economics, biology, physics, medicine and other sciences; that is, where short and long, one-dimensional and multidimensional, stationary and non-stationary, almost deterministic and noisy time series are to be analyzed.
Included:
Bar coloring
[*Alerts
[*Signals
[*Loxx's Expanded Source Types
Related Williams %R Indicators
Williams %R on Chart w/ Dynamic Zones
Williams %R w/ Bollinger Bands
Intermediate Williams %R w/ Discontinued Signal Lines
Related SSA Indicators
End-pointed SSA of FDASMA
End-pointed SSA of Normalized Price Oscillator
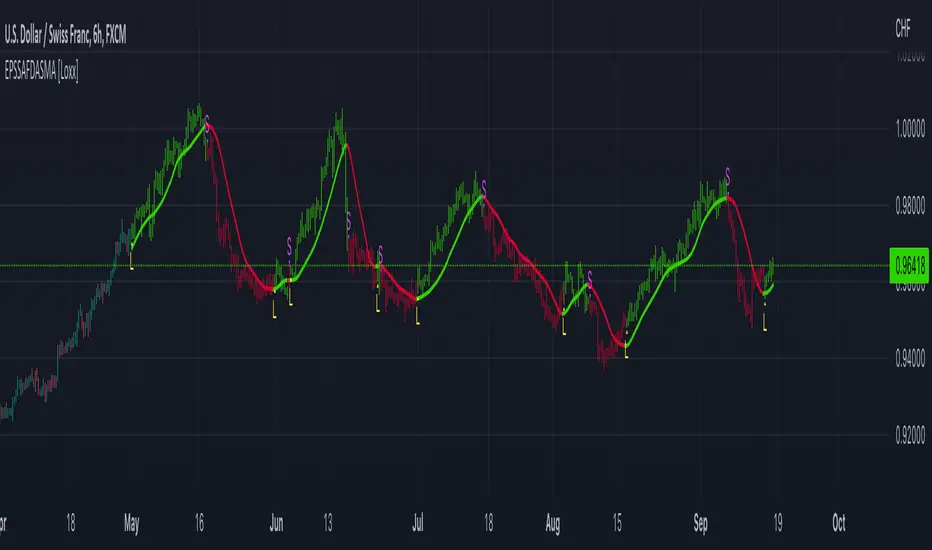
End-pointed SSA of FDASMA [Loxx]End-pointed SSA of FDASMA is a modification of Fractal-Dimension-Adaptive SMA (FDASMA) using End-Pointed Singular Spectrum Analysis. This is a multilayer adaptive indicator.
What is the Fractal Dimension Index?
The goal of the fractal dimension index is to determine whether the market is trending or in a trading range. It does not measure the direction of the trend. A value less than 1.5 indicates that the price series is persistent or that the market is trending. Lower values of the FDI indicate a stronger trend. A value greater than 1.5 indicates that the market is in a trading range and is acting in a more random fashion.
See here for more info:
Fractal-Dimension-Adaptive SMA (FDASMA) w/ DSL
What is Singular Spectrum Analysis ( SSA )?
Singular spectrum analysis ( SSA ) is a technique of time series analysis and forecasting. It combines elements of classical time series analysis, multivariate statistics, multivariate geometry, dynamical systems and signal processing. SSA aims at decomposing the original series into a sum of a small number of interpretable components such as a slowly varying trend, oscillatory components and a ‘structureless’ noise. It is based on the singular value decomposition ( SVD ) of a specific matrix constructed upon the time series. Neither a parametric model nor stationarity-type conditions have to be assumed for the time series. This makes SSA a model-free method and hence enables SSA to have a very wide range of applicability.
For our purposes here, we are only concerned with the "Caterpillar" SSA . This methodology was developed in the former Soviet Union independently (the ‘iron curtain effect’) of the mainstream SSA . The main difference between the main-stream SSA and the "Caterpillar" SSA is not in the algorithmic details but rather in the assumptions and in the emphasis in the study of SSA properties. To apply the mainstream SSA , one often needs to assume some kind of stationarity of the time series and think in terms of the "signal plus noise" model (where the noise is often assumed to be ‘red’). In the "Caterpillar" SSA , the main methodological stress is on separability (of one component of the series from another one) and neither the assumption of stationarity nor the model in the form "signal plus noise" are required.
"Caterpillar" SSA
The basic "Caterpillar" SSA algorithm for analyzing one-dimensional time series consists of:
Transformation of the one-dimensional time series to the trajectory matrix by means of a delay procedure (this gives the name to the whole technique);
Singular Value Decomposition of the trajectory matrix;
Reconstruction of the original time series based on a number of selected eigenvectors.
This decomposition initializes forecasting procedures for both the original time series and its components. The method can be naturally extended to multidimensional time series and to image processing.
The method is a powerful and useful tool of time series analysis in meteorology, hydrology, geophysics, climatology and, according to our experience, in economics, biology, physics, medicine and other sciences; that is, where short and long, one-dimensional and multidimensional, stationary and non-stationary, almost deterministic and noisy time series are to be analyzed.
Included:
Bar coloring
Alerts
Signals
Loxx's Expanded Source Types
SSA of Price [Loxx]SSA of Price ris an indicator that runs an SSA calculation on price to derive final output. This indicator also serves to introduce the concept of SSA to the Pine Coder community. The data returned from this algorithm is an array of modeled values on past X bars. Unlike the end-pointed SSA posted previously, this version pulls the modeled data from the output array and draws a line backward from the current bar. This indicator recalculates so past observations aren't very useful, but the current observation is since the current bar is index 0 of the output array which means it's the endpointed value.
What is Singular Spectrum Analysis ( SSA )?
Singular spectrum analysis ( SSA ) is a technique of time series analysis and forecasting. It combines elements of classical time series analysis, multivariate statistics, multivariate geometry, dynamical systems and signal processing. SSA aims at decomposing the original series into a sum of a small number of interpretable components such as a slowly varying trend, oscillatory components and a ‘structureless’ noise. It is based on the singular value decomposition ( SVD ) of a specific matrix constructed upon the time series. Neither a parametric model nor stationarity-type conditions have to be assumed for the time series. This makes SSA a model-free method and hence enables SSA to have a very wide range of applicability.
For our purposes here, we are only concerned with the "Caterpillar" SSA . This methodology was developed in the former Soviet Union independently (the ‘iron curtain effect’) of the mainstream SSA . The main difference between the main-stream SSA and the "Caterpillar" SSA is not in the algorithmic details but rather in the assumptions and in the emphasis in the study of SSA properties. To apply the mainstream SSA , one often needs to assume some kind of stationarity of the time series and think in terms of the "signal plus noise" model (where the noise is often assumed to be ‘red’). In the "Caterpillar" SSA , the main methodological stress is on separability (of one component of the series from another one) and neither the assumption of stationarity nor the model in the form "signal plus noise" are required.
"Caterpillar" SSA
The basic "Caterpillar" SSA algorithm for analyzing one-dimensional time series consists of:
Transformation of the one-dimensional time series to the trajectory matrix by means of a delay procedure (this gives the name to the whole technique);
Singular Value Decomposition of the trajectory matrix;
Reconstruction of the original time series based on a number of selected eigenvectors.
This decomposition initializes forecasting procedures for both the original time series and its components. The method can be naturally extended to multidimensional time series and to image processing.
The method is a powerful and useful tool of time series analysis in meteorology, hydrology, geophysics, climatology and, according to our experience, in economics, biology, physics, medicine and other sciences; that is, where short and long, one-dimensional and multidimensional, stationary and non-stationary, almost deterministic and noisy time series are to be analyzed.
Included:
Bar coloring
Alerts
Signals
Loxx's Expanded Source Types
End-pointed SSA of Normalized Price Oscillator [Loxx]End-pointed SSA of Normalized Price Oscillator is an indicator that converts source price into a normalized oscillator and runs an SSA calculation to derived a smoother final output. This indicator also serves to introduce the concept of SSA to the Pine Coder community. The data returned from this algorithm is an array of modeled values on past X bars. We could use this data but it's not useful, so instead we use the end-pointed value which is the first value of the array at index 0.
What is Singular Spectrum Analysis (SSA)?
Singular spectrum analysis (SSA) is a technique of time series analysis and forecasting. It combines elements of classical time series analysis, multivariate statistics, multivariate geometry, dynamical systems and signal processing. SSA aims at decomposing the original series into a sum of a small number of interpretable components such as a slowly varying trend, oscillatory components and a ‘structureless’ noise. It is based on the singular value decomposition (SVD) of a specific matrix constructed upon the time series. Neither a parametric model nor stationarity-type conditions have to be assumed for the time series. This makes SSA a model-free method and hence enables SSA to have a very wide range of applicability.
For our purposes here, we are only concerned with the "Caterpillar" SSA. This methodology was developed in the former Soviet Union independently (the ‘iron curtain effect’) of the mainstream SSA. The main difference between the main-stream SSA and the "Caterpillar" SSA is not in the algorithmic details but rather in the assumptions and in the emphasis in the study of SSA properties. To apply the mainstream SSA, one often needs to assume some kind of stationarity of the time series and think in terms of the "signal plus noise" model (where the noise is often assumed to be ‘red’). In the "Caterpillar" SSA, the main methodological stress is on separability (of one component of the series from another one) and neither the assumption of stationarity nor the model in the form "signal plus noise" are required.
"Caterpillar" SSA
The basic "Caterpillar" SSA algorithm for analyzing one-dimensional time series consists of:
Transformation of the one-dimensional time series to the trajectory matrix by means of a delay procedure (this gives the name to the whole technique);
Singular Value Decomposition of the trajectory matrix;
Reconstruction of the original time series based on a number of selected eigenvectors.
This decomposition initializes forecasting procedures for both the original time series and its components. The method can be naturally extended to multidimensional time series and to image processing.
The method is a powerful and useful tool of time series analysis in meteorology, hydrology, geophysics, climatology and, according to our experience, in economics, biology, physics, medicine and other sciences; that is, where short and long, one-dimensional and multidimensional, stationary and non-stationary, almost deterministic and noisy time series are to be analyzed.
Included:
Bar coloring
Alerts
Signals
Loxx's Expanded Source Types

Triple Timeframe IchimokuVi presento il Triple Timeframe Ichimoku.
Questo indicatore applica tre Ichimoku completi al vostro grafico usando fino a ben 3 timeframe diversi:
Timeframe Attuale (quello impostato sul grafico che state visualizzando)
Timeframe B (personalizzabile tra i seguenti TF : 1m, 5m, 15m, H1, H2, H4, D, W, M)
Timeframe C (personalizzabile tra i seguenti TF : 1m, 5m, 15m, H1, H2, H4, D, W, M)
Il risultato è quello di avere immediatamente sott'occhio l'andamento dei prezzi senza dover fare zapping tra i vari timeframe: tutto chiaro subito!
L'indicatore è completamente personalizzabile, potete infatti:
Decidere quanti (da 1 a 3) e quali Ichimoku visualizzare
Scegliere per ogni Ichimoku se visualizzare o meno le linee dell'indicatore (Tenkan, Kijun e Laggin)
Scegliere per ogni Ichimoku se visualizzare o meno le nuvole dell'indicatore (SSA, SSB e Kumo)
Personalizzare i colori di ogni singola linea di ogni singolo Ichimoku
L'indicatore è estremamente utile per strategie basare sull'indicatore Ichimoku che richiedono il controllo su diversi Timeframe.
Buon trading a tutti!
