Standard Deviation (fadi)The Standard Deviation indicator uses standard deviation to map out price movements. Standard deviation measures how much prices stray from their average—small values mean steady trends, large ones mean wild swings. Drawing from up to 20 years of data, it plots key levels using customizable Fibonacci lines tied to that standard deviation, giving traders a snapshot of typical price behavior.
These levels align with a bell curve: about 68% of price moves stay within 1 standard deviation, 95% within roughly 2, and 99.7% within roughly 3. When prices break past the 1 StDev line, they’re outliers—only 32% of moves go that far. Prices often snap back to these lines or the average, though the reversal might not happen the same day.
How Traders Use It
If prices surge past the 1 StDev line, traders might wait for momentum to fade, then trade the pullback to that line or the average, setting a target and stop.
If prices dip below, they might buy, anticipating a bounce—sometimes a day or two later. It’s a tool to spot overstretched prices likely to revert and/or measure the odds of continuation.
Settings
Higher Timeframe: Sets the Higher Timeframe to calculate the Standard Deviation for
Show Levels for the Last X Days: Displays levels for the specified number of days.
Based on X Period: Number of days to calculate standard deviation (e.g., 20 years ≈ 5,040 days). Larger periods smooth out daily level changes.
Mirror Levels on the Other Side: Plots symmetric positive and negative levels around the average.
Fibonacci Levels Settings: Defines which levels and line styles to show. With mirroring, negative values aren’t needed.
Background Transparency: Turn on Background color derived from the level colors with the specified transparency
Overrides: Lets advanced users input custom standard deviations for specific tickers (e.g., NQ1! at 0.01296).
Stdevchannel

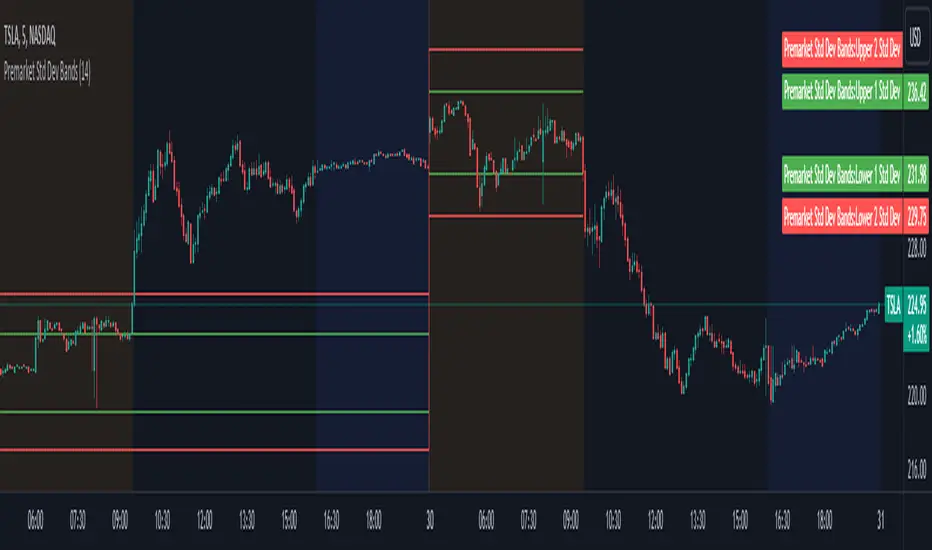
Premarket Std Dev BandsOverview
The Premarket Std Dev Bands indicator is a powerful Pine Script tool designed to help traders gain deeper insights into the premarket session's price movements. This indicator calculates and displays the standard deviation bands for premarket trading, providing valuable information on price volatility and potential support and resistance levels during the premarket hours.
Key Features
Premarket Focus: Specifically designed to analyze price movements during the premarket session, offering unique insights not available with traditional indicators.
Customizable Length: Users can adjust the averaging period for calculating the standard deviation, allowing for tailored analysis based on their trading strategy.
Standard Deviation Bands: Displays both 1 and 2 standard deviation bands, helping traders identify significant price movements and potential reversal points.
Real-Time Updates: Continuously updates the premarket open and close prices, ensuring the bands are accurate and reflective of current market conditions.
How It Works
Premarket Session Identification: The script identifies when the current bar is within the premarket session.
Track Premarket Prices: It tracks the open and close prices during the premarket session.
Calculate Premarket Moves: Once the premarket session ends, it calculates the price movement and stores it in an array.
Compute Averages and Standard Deviation: The script calculates the simple moving average (SMA) and standard deviation of the premarket moves over a specified period.
Plot Standard Deviation Bands: Based on the calculated standard deviation, it plots the 1 and 2 standard deviation bands around the premarket open price.
Usage
To utilize the Premarket Std Dev Bands indicator:
Add the script to your TradingView chart.
Adjust the Length input to set the averaging period for calculating the standard deviation.
Observe the plotted standard deviation bands during the premarket session to identify potential trading opportunities.
Benefits
Enhanced Volatility Analysis: Understand price volatility during the premarket session, which can be crucial for making informed trading decisions.
Support and Resistance Levels: Use the standard deviation bands to identify key support and resistance levels, aiding in better entry and exit points.
Customizable and Flexible: Tailor the averaging period to match your trading style and strategy, making this indicator versatile for various market conditions.
Probability Cloud BASIC [@AndorraInvestor]🔮☁️
This is the BASIC version of the PROBABILITY CLOUD indicator.
It is an evolution beyond traditional standard deviation probabilistic indicators only using bands or channels.
The new PROBABILITY CLOUD graphic representation with customizable transparent layers is based on -2 / +2 standard deviation calculated using 20 fixed predetermined time periods, and is available in several calculation MODES:
SMA , EMA , WMA , VWMA , VWMA & VAWMA
The indicator is designed to let the trader visually understand the probabilistic depth of past, present and future price action, and its evolution over time.
Looking forward to your comments and feedback to guide me on future updates!
🙏 Big THANKS @Electrified for letting me use his work on Deviation Bands/ as a starting point for my first script.
