Ehlers Fisher Stochastic Relative Vigor Index StrategyBy John Ehlers from his book "Cybernetic Analysis for Stocks and Futures".Strategi Pine Script®oleh Tr0sT33199
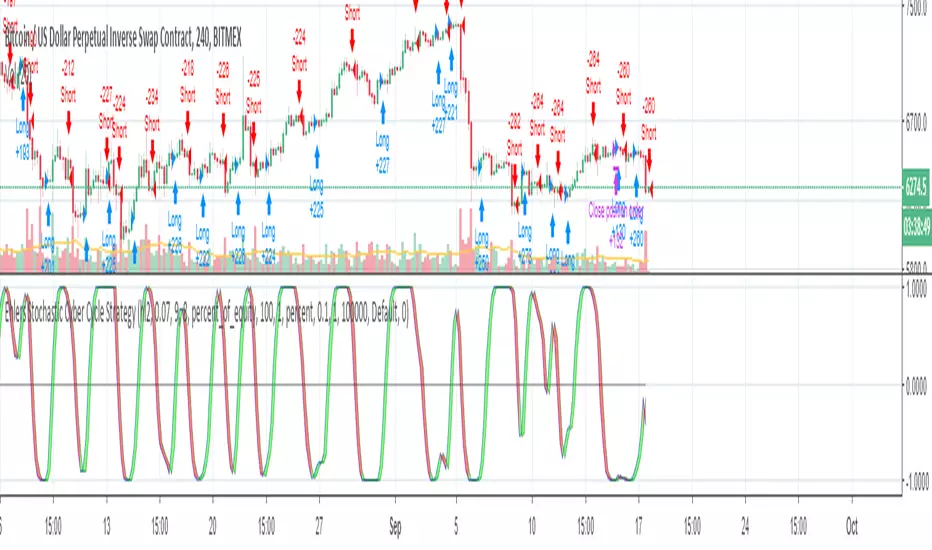
Ehlers Stochastic Cyber Cycle StrategyBy John Ehlers from his book "Cybernetic Analysis for Stocks and Futures".Strategi Pine Script®oleh Tr0sT11115
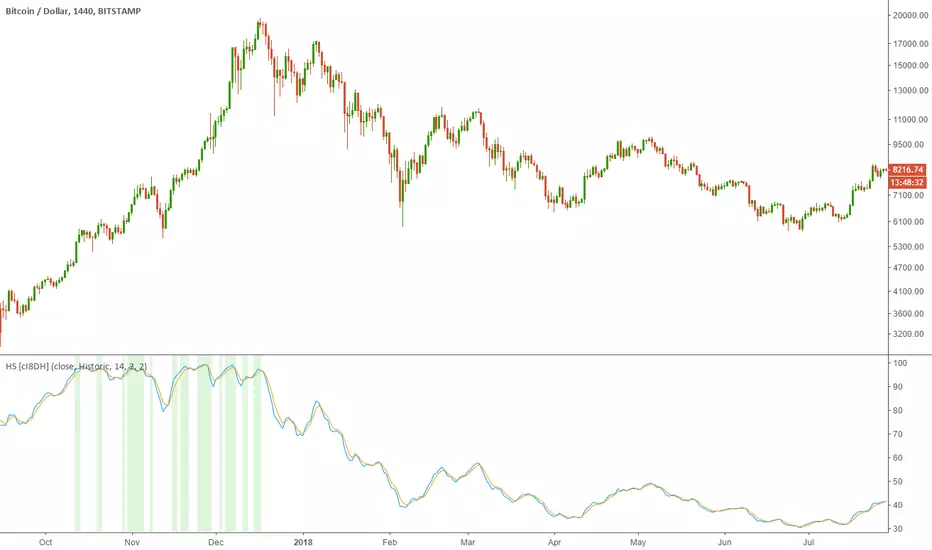
Historical Stochatic (HS) [cI8DH]This indicator calculates historical stochastic (HS). It also includes the standard stoch. HS works similar to the standard stochastic . The difference is that the standard stochastic has a set look-back period, while HS looks as far back as the first bar. This allows identifying ATHs and ATLs (background highlights green and red respectively). Basically, HS shows inverse retracement from ATL to ATH in percentage. This indicator works best on non-range bound indicators such as MACD. As you can see in the chart below, MACD is not useful to compare against periods that price is wildly different. Applying HS on MACD fixes this issue (To achieve the same results, add MACD indicator > change the source to MACD on HS settings > since MACD is a smoothed indicator, smoothing length is set to 1. To get similar smoothing length on the signal as in standard MACD, set %D to 5 smoothed MA which is equivalent to 9 EMA smoothing on standard MACD). Gain/Loss Moving Average (GLMA) is another indicator that can benefit well from HS. GLMA is the simplest and probably the most accurate momentum indicator. But it is not as convenient as RSI since it is not range bound. HS can make it range bound without compromising its accuracy. (To achieve the same results, add GLMA indicator > change the source to GLMA on HS settings > set %K length to 1). Chart below shows HS applied to Accumulation/Distribution Money Flow (ADMF) and compares it against its range bound counter part, ADP. Conclusion: There are different ways of making an indicator normalized or range bound. Some indicators use RSI's approach (positive changes MA / all changes MA) such as MFI, CMF, ADP. This approach is great but the divergence near extremes can sometimes be misleading. HS fixes this problem as long as the indicator is not making a new ATH or ATL . When it does make new ATH or ATL , this indicator gives a warning to avoid using it for detecting divergence. PS: It is a bit geeky to apply HS on other indicators. I will publish some of my indicators with HS and standard stoch built-in. So stay tuned if u r interested in this indicator. Read more here about using stochastic www.tradingview.com(STOCH)Penunjuk Pine Script®oleh cI8DH66175
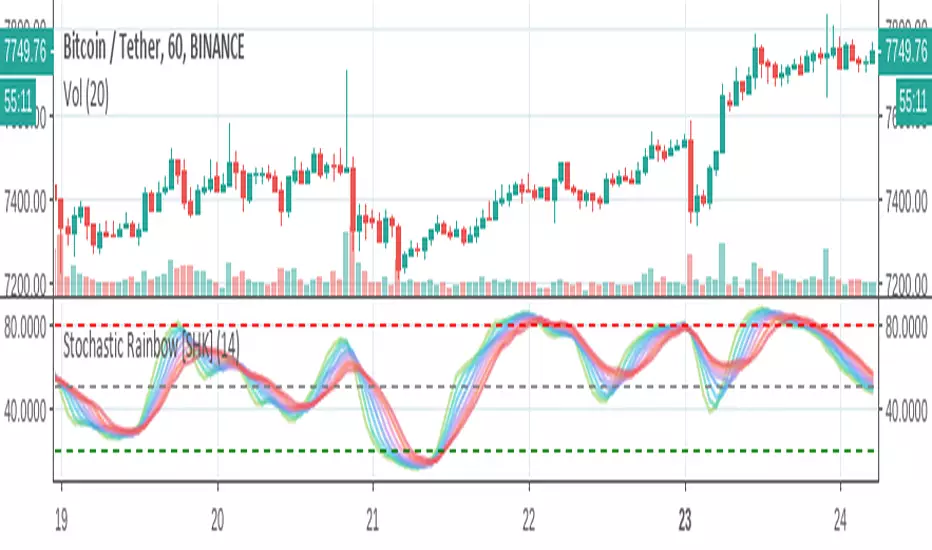
Stochastic Rainbow [SHK]Stochastic Rainbow consists of 8 stochastic oscillators with different speeds. So It has lower noises and better visualization comparing to simple stochastic. I welcome comments, suggestions.Penunjuk Pine Script®oleh shayankm99429
3x Stoch on Given Time-frame v0.13x stochastic oscillators (K only), set the timeframe you want the stoch to be based off. Smooth and length is hard-coded to give easy view of the time-frame set in the indicator arguments shown on-chart. Edit these in the Pine Editor as needed. smooth = 6 length1 = 5 length2 = 8 length3 = 14Penunjuk Pine Script®oleh wangyue33
Stoch Momentum Index* Original code from UCSgears. * Added circles for when Stoch MI and signal line crosses.Penunjuk Pine Script®oleh cryptotakuTelah dikemas kini 1196
Inverse Fisher Transform on STOCHASTIC (modified graphics)Modified the graphic representation of the script from John Ehlers - From California, USA, he is a veteran trader. With 35 years trading experience he has seen it all. John has an engineering background that led to his technical approach to trading ignoring fundamental analysis (with one important exception). John strongly believes in cycles. He’d rather exit a trade when the cycle ends or a new one starts. He uses the MESA principle to make predictions about cycles in the market and trades one hundred percent automatically. In the show John reveals: • What is more appropriate than trading individual stocks • The one thing he relies upon in his approach to the market • The detail surrounding his unique trading style • What important thing underpins the market and gives every trader an edge About INVERSE FISHER TRANSFORM: The purpose of technical indicators is to help with your timing decisions to buy or sell. Hopefully, the signals are clear and unequivocal. However, more often than not your decision to pull the trigger is accompanied by crossing your fingers. Even if you have placed only a few trades you know the drill. In this article I will show you a way to make your oscillator-type indicators make clear black-or-white indication of the time to buy or sell. I will do this by using the Inverse Fisher Transform to alter the Probability Distribution Function (PDF) of your indicators. In the past12 I have noted that the PDF of price and indicators do not have a Gaussian, or Normal, probability distribution. A Gaussian PDF is the familiar bell-shaped curve where the long “tails” mean that wide deviations from the mean occur with relatively low probability. The Fisher Transform can be applied to almost any normalized data set to make the resulting PDF nearly Gaussian, with the result that the turning points are sharply peaked and easy to identify. The Fisher Transform is defined by the equation 1) Whereas the Fisher Transform is expansive, the Inverse Fisher Transform is compressive. The Inverse Fisher Transform is found by solving equation 1 for x in terms of y. The Inverse Fisher Transform is: 2) The transfer response of the Inverse Fisher Transform is shown in Figure 1. If the input falls between –0.5 and +0.5, the output is nearly the same as the input. For larger absolute values (say, larger than 2), the output is compressed to be no larger than unity. The result of using the Inverse Fisher Transform is that the output has a very high probability of being either +1 or –1. This bipolar probability distribution makes the Inverse Fisher Transform ideal for generating an indicator that provides clear buy and sell signals. Penunjuk Pine Script®oleh hard6out11234
ShortSqueeze StochasticOscillatorHey! I made a StochasticOscillator with BITFINEX:BTCUSDLONG & BITFINEX:BTCUSDSHOTS Hope you enjoy it, and remember it's not about the asset's price, but about the asset's interest with these finantial tools.Penunjuk Pine Script®oleh BiO-61866
Stochastic (Double-Smoothed Bressert)Bressert's Double-Smoothed Stochastic formula, with some extra features. Visual highlighting of overbought/oversold values with dots. On intraday charts you can optionally show the Daily Stochastic instead of using the minutes/hours data. Penunjuk Pine Script®oleh nj_guy7233239
3 in 1 (BB, Stoch ,rsi) with alert On the chart there are the BB with purple and green circles to give the entry signal once the price has come back in the bands.The background alert appair when BOTH RSI and STOCH are in overbuy or oversell. the defalt is 20/80 but can set it by yourself. Penunjuk Pine Script®oleh MarcoValente77 1.5 K
5 in 1 (rsi,aroon,stoch,macd,adx di)5 indicators in 1. You can choose wich one you want to see (rsi ,aroon,macd,stoch or adx di) Usefull to save space for other indicators Penunjuk Pine Script®oleh MarcoValente1616 1.8 K
Willams %R with 13 EMA and middle pointWillams %R with 13 EMA and middle point. It also uses the textbook formula instead of the Tradingview one.Penunjuk Pine Script®oleh alexpunctTelah dikemas kini 1313 1.1 K
RSI AND SMOOTHED STOCH RSI TOGETHERi dont know pine script but here i used some free ones and merged them and modified some especially smoothed stoch rsi is Good to decide when buy coz i modified it and when fast K value is over D value it changes color visually better this way also rsi is shown as area o histogram but if u dont like u can change to line for stoch rsi i unclick xtrigger (d value) for better appearance Penunjuk Pine Script®oleh Mlnklkm44180
Kozlod - Stochastic Slow AlertsAlerts for standard Stochastic Slow strategy. Penunjuk Pine Script®oleh QuantNomad382
4 Multi-Timeframe Stochastics by Theo Parkmodify the study name and open soure codePenunjuk Pine Script®oleh JiyoungPark123
BTCUSD long vs short ratio+rsiJust a script I want to share with friends on a discord orange/green line : longs vs short ratio (100 = only longs, 0 = only shorts) purple line : RSI of (longs-shorts)Penunjuk Pine Script®oleh EtherikTelah dikemas kini 60
STOCH MTF with Moving AverageBasic STOCH indicator with MTF support with moving average USE EMA Cross with Stoch for buy / sell signalPenunjuk Pine Script®oleh QuantTherapy11156
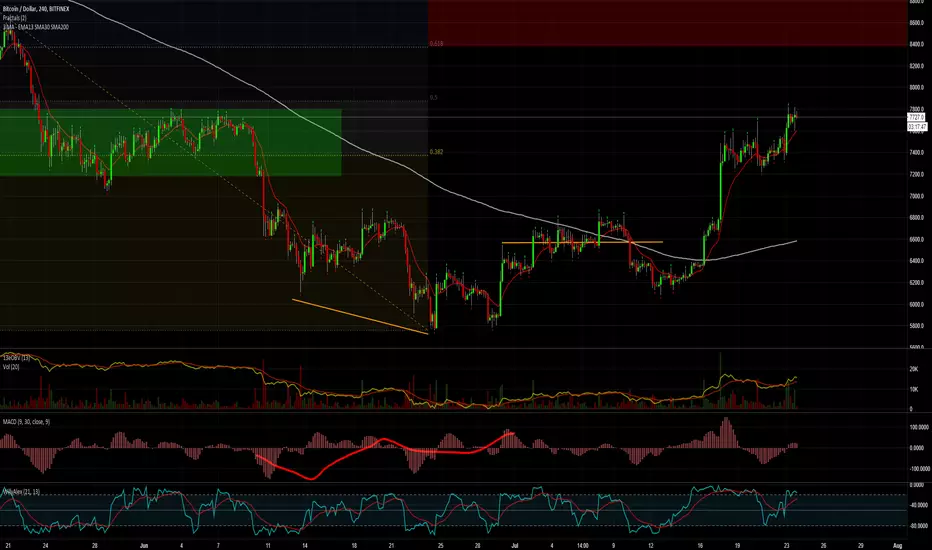
Simple profitable trading strategyThis strategy has three components. Philakones EMAs are a sequence of five fibonacci EMAs. They range from 55 candles (green) to 8 candles (red) in length. A strong trend or breakout is marked by the emas appearing in sequence of their length from 8 to 55 or vice versa. These EMAs are also used to signal an exit. Only two EMAs are used for exit signals - when the 13 EMA crosses over/under the 55 EMA. RSI gives a bullish signal when 40 > rsi > 70. Exit signals are oversold (30) or overbought (70) Stochastics give a bullish signal when stoch < 80 and an exit signal when > 95. Results include 3 ticks of slippage and taker fees of .002. Provides a pretty smooth equity curve with a 73% win rate and beats buy and hold by than 10x (returns about 60x overall) since start of 2017. Strategi Pine Script®oleh joepegler1616 3.1 K
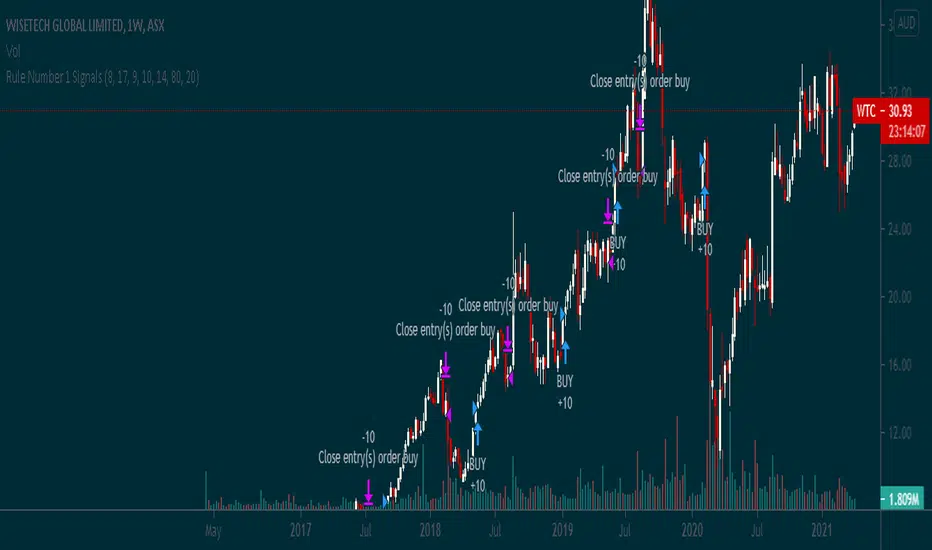
Rule Number 1 SignalsThis script takes the Rule #1 3 tools and plots them on the graph, to provide an additional level of indication for when to sell and when to buy.Strategi Pine Script®oleh TraderHalaiTelah dikemas kini 66154
Ehlers Stochastic Cyber CycleEhlers Stochastic Cyber Cycle indicator script. This indicator was originally developed by John F. Ehlers (see his book `Cybernetic Analysis for Stocks and Futures`, Chapter 8: `Stochasticization and Fisherization of Indicators`).Penunjuk Pine Script®oleh evergetTelah dikemas kini 33235
Salty GRaB Wave with Highlights for Squeeze CCI-Arrows SlowStochThis indicator shows GRaB candles and allows several moving averages to be displayed at the same time. It uses background coloring to identify momentum shifts. Wide bands of color can be used to identify trends while short bands of color can be used to identify reversals. It has arrows above or below the candles to show CCI values above 100 or below -100 with the arrow pointing in the direction of the momentum. It has red background coloring to show slow stochastic Overbought ranges and dark red signals indicating a cross of the fast and slow lines. It has green background coloring to show slow stochastic Oversold ranges and dark green signals indicating a cross of the fast and slow lines. It has yellow background to show squeezes with additional Squeeze information shown at the bottom of the chart in the form of letters and momentum arrows.Penunjuk Pine Script®oleh markmiotkeTelah dikemas kini 77293
Double Stochastic Multi-TimeframeI personalized a double stochastic oscillator. HOW IS IT USED ? Everyone should adapt the parameters to its way of trading. First you must have a confirmation of the trend. In positive trend, a double stochastic > 20 can be used t enter long. In negative trend, a double stochastic < 80 can be used t enter long. Of course this is only one possibility that everyone should adapt. I added the possibility to add on the chart a 2nd timeframe for confirmation. If you found this script useful, a tip is always welcome... :)Penunjuk Pine Script®oleh KenLeShim130
Multi-Timeframe Stochastic-Theo ParkMulti timeframe Stochastic.Penunjuk Pine Script®oleh JiyoungParkTelah dikemas kini 22276