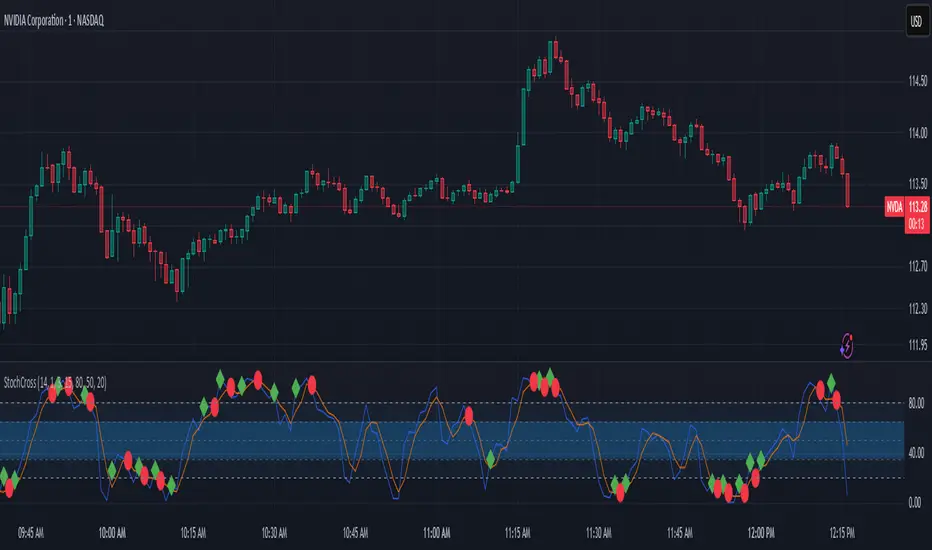
Exponential Stochastic Strategywhat is Exponential Stochastic?
it is a modified version of the stochastic indicator. This strategy does not include pyramiding, repaint, trailing stop or take profit.
what it does?
It contains an extra input in addition to the stochastic indicator. Thanks to this input, different exponential weights can be given to the outputs and the indicator can be made more sensitive or insensitive. The strategy buys when the indicator leaves the overbought zone, sells when it leaves the oversold zone and always stays in the trade.
how it does it?
it uses this formula: i.hizliresim.com
Thanks to this formula, even if the weights given to the outputs change, the indicator always continues to take a value between 0 and 100.
how to use it ?
With the input named "exp", you can change the sensitivity of the indicator and develop different strategies. other inputs are the same as the stochastic indicator. Increasing the exp value causes the indicator to signal less, decreasing it makes it much more sensitive.
Stochastic Oscillator
Stochastic Oversold / Overbought Multi Time Frame on CandleAt the suggestion of a friend, I prepared this educational indicator to show how to use a Multi time frames on the chart based on the color of The Candle.
This Script calculates the stochastic oscillator for multiple timeframes and displays the overbought/oversold signals on the chart with color coding.
The stochastic oscillator is a momentum indicator that compares a security's closing price to its high-low range over a set number of periods. The indicator oscillates between 0 and 100, with readings above 80 considered overbought and readings below 20 considered oversold.
The indicator has the following input parameters:
%K Length: the number of periods used to calculate the stochastic oscillator (default is 14).
%K Smoothing: the number of periods used to smooth the stochastic oscillator (default is 1).
Three timeframes: The timeframes for which the stochastic oscillator is calculated can be set as 15-minute, 1-hour, or 4-hour intervals. For each timeframe, the user can choose to display the indicator (or not) and set the color of the candle. The user can also set the overbought and oversold levels (default is 80 and 20, respectively).
The indicator calculates the stochastic oscillator using the ta.stoch function from the built-in ta library in PineScript. It then uses the ta.sma function to smooth the stochastic oscillator if specified. Finally, the indicator uses the TimeframFuction to calculate the stochastic oscillator for different timeframes, which is then displayed on the chart using the barcolor function. The color of the candle is set based on whether the stochastic oscillator is overbought or oversold, as determined by the overbought/oversold levels specified by the user.
Note: This code is example for you to use multi timeframe in your indicator or Strategy , also prevent Repainting Calculation
DEVIATION OF THE STOCHASTIC INDICATORThis new technical indicator uses the stochastic oscillator as its base and calculates the deviation of its moving average, generating an alternative view of market volatility.
Stochastic RSI ScreenerStochastic RSI Screener is built as an indicator and can be applied to any chart.
It gives users the ability to choose 5 specific symbols to watch and then specify the required options to change the RSI and Stochastic settings in a way that fits their needs.
This screener shows the values of (CURRENT PRICE, RSI, K-VALUE, D-VALUE) for each one of the specified symbols. It will do the calculations based on the currently opened timeframe for all symbols.
Table rsi multiframes(by Lc_M)- Simultaneous display of RSI values on cells corresponding to each selected timeframe, organized in an intuitive table, adjustable in size and position.
- Color indicator on each cell that presents RSI values within the overbought and oversold levels. example: if the user wants to set the O.S/O.B levels to 20 - 80, the colored cells will only appear at "RSI" => 80 and "RSI" <= 20.
- Free configuration of graphic times, lengths and O.B/O.S, according to user standards
Strategy Myth-Busting #5 - POKI+GTREND+ADX - [MYN]This is part of a new series we are calling "Strategy Myth-Busting" where we take open public manual trading strategies and automate them. The goal is to not only validate the authenticity of the claims but to provide an automated version for traders who wish to trade autonomously.
Our fifth one we are automating is one of the strategies from "The Best 3 Buy And Sell Indicators on Tradingview + Confirmation Indicators ( The Golden Ones ))" from "Online Trading Signals (Scalping Channel)". No formal backtesting was done by them and resuructo messaged me asking if we could validate their claims.
Originally, we mimic verbatim the settings Online Trading Signals was using however weren't getting promising results. So before we stopped there we thought we might want to see if this could be improved on. So we adjusted the Renko Assignment modifier from ATR to Traditional and adjusted the value to be higher from 30 to 47. We also decided to try adding another signal confirmation to eliminate some of the ranged market conditions so we choose our favorite, ADX . Also, given we are using this on a higher time-frame we adjusted the G-Channel Trend detection source from close to OHLC4 to get better average price action indication and more accurate trend direction.
This strategy uses a combination of 2 open-source public indicators:
poki buy and sell Take profit and stop loss by RafaelZioni
G-Channel Trend Detection by jaggedsoft
Trading Rules
15m - 4h timeframe. We saw best results at the recommended 1 hour timeframe.
Long Entry:
When POKI triggers a buy signal
When G-Channel Trend Detection is in an upward trend (Green)
ADX Is above 25
Short Entry:
When POKI triggers a sell signal
When G-Channel Trend Detection is in an downward trend (red)
ADX Is above 25
If you know of or have a strategy you want to see myth-busted or just have an idea for one, please feel free to message me.
Zig Zag Stochastic (ZZS)The "Zig Zag Stochastic" indicator is an indicator that uses a combination of zigzag pivot points and exponential smoothing to calculate a stochastic-like oscillator.
The indicator starts by identifying pivot high and pivot low points in the price data using the Zigzag indicator. These pivot points are then used to calculate the scale_price, which is a ratio of the current close price to the range between the current pivot high and pivot low.
Next, the scale_price is smoothed using exponential smoothing. The user can input the desired length of the smoothing period, with a default value of 14. If the user sets the smoothing length to 0, the indicator will automatically calculate the optimal smoothing length using the MAMA period calculation from the Dominant Cycle Estimators library.
The smoothed scale_price is then used to calculate two lines: the K-line and the D-line, both of which are also smoothed using exponential smoothing. The K-line is the main oscillator line and is similar to the %K line in a traditional stochastic oscillator. The D-line is a signal line, similar to the %D line in a traditional stochastic oscillator.
The indicator plots the smoothed scale_price, the K-line, and the D-line. Additionally, it includes horizontal lines at the 80 and 20 levels, and fills the area between them to help identify overbought and oversold conditions.
Adaptive RSI/Stochastic (ARSIS)As a trader, one of the most important aspects of technical analysis is identifying the dominant cycle of the market. The dominant cycle, also known as the market's "heartbeat," can provide valuable information on the current market trend and potential future price movements. One way to measure the dominant cycle is through the use of the MESA Adaptation - MAMA Cycle function, which is a part of the Dominant Cycle Estimators library.
I have developed an "Adaptive RSI/Stochastic" indicator that incorporates the MAMA Cycle function to provide more accurate and reliable signals. The indicator uses the MAMA Cycle function to calculate the period of the data, which is then used as a parameter in the calculation of the RSI and Stochastic indicators. By adapting the calculation of these indicators to the dominant cycle of the market, the resulting signals are more in tune with the current market conditions and can provide a more accurate representation of the current trend.
The MAMA Cycle function is a powerful tool that utilizes advanced mathematical techniques to accurately calculate the dominant cycle of the market. It takes into account the dynamic nature of the market and adapts the calculation of the period to the current conditions. The result is a more accurate and reliable measurement of the market's dominant cycle, which can be used to improve the performance of other indicators and trading strategies.
In conclusion, the Adaptive RSI/Stochastic indicator that I have developed, which incorporates the MAMA Cycle function, is a valuable tool for any trader looking to improve their technical analysis. By adapting the calculation of the RSI and Stochastic indicators to the dominant cycle of the market, the resulting signals are more in tune with the current market conditions and can provide a more accurate representation of the current trend.
Huge thank you to @lastguru for making this possible!
Stoch RSI 15 min - multi time frame tableABOUT THIS INDICATOR
This indicator calculates the Stochastic RSI for the time frames 15 min, 30 min, 1h, 4h, and 12h. However, the 15 min time frame should always be the default time frame for your chart.
IMPORTANT
* NOTE! It's extremely important that the chosen time frame for your chart is 15 min. Otherwise the Stochastic RSI for the longer time frames won’t be correctly calculated.
* Stochastic RSI will be calculated and displayed in a table for the time frames: 15 min, 30 min, 1h, 4h, 12h.
* All time frames are based on closed bars except the "15minR" that are realtime updated values calculated on a 15 min time frame.
ABOUT STOCHASTIC RSI
The Stochastic RSI (StochRSI) is a momentum indicator that ranges between 0 and 100. A Stochastic RSI value above 80 is considered overbought and below 20 is considered oversold.
By using different time frames you can get a better idea of what direction the trade could take in a "longer" perspective.
SETTINGS
1.) Length RSI = 14 (default period)
2.) Smoothing parameter of Stochastic RSI (Length Moving Average = 3) . Moving average of stochastic RSI
* By default the displayed Stochastic RSI values are smoothed values of the actual Stochastic RSI. The smoothnes is formed by a calculated moving average of with the length of 3 by default.
If you want Stochastic RSI with a sharper signal (higher risk for "false alarms" being more sensitive) change the Length Moving Average to = 1 (no smoothness at all)
You can see the selected "Length RSI" and "Length Moving Average" on top of the Stochastic RSI table.
Next version of this script will be updated with more a more flexible solution for different time frames.
* NOTE, Tradingview comes with a inbuilt Stochastic RSI. See the the chart below. The blue line in the Stochastic-RSI chart represents (K value = 3) the same value as the script calculate/display in the table.
inverse_fisher_transform_adaptive_stochastic█ Description
The indicator is the implementation of inverse fisher transform an indicator transform of the adaptive stochastic (dominant cycle), as in the Cycle Analytics for Trader pg. 198 (John F. Ehlers). Indicator transformation in brief means reshaping the indicator to be more interpretable. The inverse fisher transform is achieved by compressing values near the extremes many extraneous and irrelevant wiggles are removed from the indicator, as cited.
█ Inverse Fisher Transform
input = 2*(adaptive_stoc - .5)
output = e(2*k*input) -1 / e(2*k*input) +1
█ Feature:
iFish i.e. output value
trigger i.e. previous 1 bar of iFish * 0.90
if iFish crosses above the trigger, consider a buy indicated with the green line
while, iFish crosses below the trigger, consider a sell indicate by the red line
in addition iFish needs to be greater than the previous iFish
Key Points of Adjoining Median (KPAM)This indicator shows more reliable overbought & oversold levels buy combing 3 different level-indicators (i.e., indicators showing overbought/oversold levels).
A median is created by adjoining two of them and then it is assisted by a third one.
This reduces noise in calculating entries when using level indicators.
Note: The extra indicator shown is "Bands Bands (BanB)"
----- HOW TO USE IT -----
Use with price-action trading and with indicators showing the overall trend.
See notes in chart for more explanation.
The high and low levels of the RSI are within a range of 2 & -2 respectively.
The high and low levels for the median range from 4 & -4 respectively.
The Discordance shows how certain the level of the median is.
For example, if a part of the Discordance touches a low level while the median is at a higher level, then it usually indicates that the median is about to reverse.
The more Discordance that is visible, the less certain the current trend of the median is.
----- HOW THIS INDICATOR IS ORIGINAL; WHAT IT DOES AND HOW IT DOES IT -----
This indicator has an original, unique ability to reduce noise when comparing overbought and oversold levels.
It does this by first adjoining the Stochastic and the Stochastic RSI. Second, it creates a median from the two.
Third, the median is compared to the RSI on the same scale to assist in deciding where the median is at in relation to itself.
It shows whether the median lows and highs are near overbought or oversold levels.
----- VERSION -----
This is not a variant of the Stochastic, Stochastic RSI, and/or the RSI.
The focus is on the median that is created by an adjoining of the Stochastic and Stochastic RSI.
The Stochastic and Stochastic RSI are needed in order to obtain and plot the Median and the Discordance.
The RSI is plotted on the same scale to serve as the comparison needed to evaluate the Median levels with more visual accuracy.
Smooth Stochastic and RSI ComboA lot of people run both stochastic and rsi on one chart so I figured I would make something that combines the two. This script takes both the rsi and the stochastic, smooths them both and then plots them both on top of each other. I have filled it to make an error range and I colored it with the direction of its mean. I hope this frees up some room on your screen! Enjoy!
ps this is not stochastic rsi, its both stochastic and rsi.
Vector ScalerVector Scaler is like Stochastic but it uses a different method to scale the input. The method is very similar to vector normalization but instead of keeping the "vector" we just sum the three points and average them. The blue line is the signal line and the orange line is the smoothed signal line. I have added the "J" line from the KDJ indicator to help spot divergences. Differential mode uses the delta of the input for the calculations. Here are some pictures to help illustrate how this works relative to other popular indicators.
Vector Scaler vs Stochastic
Vector Scaler vs Smooth Stochastic RSI
average set to 100
average set to 200
Rob Booker Reversal Tabs StrategyRob Booker Reversal Tabs Strategy is an updated version of Rob Bookers Reversal Tab study: Rob Booker Reversal Tabs
While the original is a Pinescript study, this version can be switched between strategy and indicator mode.
Rob Bookers script generates reversal signal based on MACD and Stochastics, it is not a true reversal system, default pyramiding value is set to 5.
Inputs determine MACD and Stochastics settings. The only additional input is the "Strategy Mode" checkbox.
This script works well on its own for some tickers, but like any reversal pattern generating scripts, traders will profit from looking at overall price action and trend strength before making a trade.
From the original:
A simple reversal pattern indicator that uses MACD and Stochastics.
Created by Rob Booker and programmed by Andrew Palladino.
Please note that I only updated the original to V5 and edited it to be a strategy, which was a grand total of 5 minutes of work. I updated it because I wanted to see how the script performs as a strategy and I'm publishing it in case others would like to use it. I take no credit whatsoever for the original and WILL take this version down if Rob Booker or his Team ask me to or decide to release their own strategy version of the original.
Check out Rob Bookers scripts and ideas on his Tradingview account: robbooker
Stochastic Buy Sell with EMA TrendStochastic Buy Sell with EMA Trend is combination of two indicators only.
The Stochastic Oscillator ( STOCH ) is a range bound momentum oscillator. The Stochastic indicator is designed to display the location of the close compared to the high/low range over a user defined number of periods. Typically, the Stochastic Oscillator is used for three things; Identifying overbought and oversold levels, spotting divergences and also identifying bull and bear set ups or signals.
The Exponential Moving Average (EMA) is a specific type of moving average that points towards the importance of the most recent data and information from the market.
1) Stochastic - It is giving signal whenever cross happen in oversold or overbought zone.
2) EMA 200 - EMA 200 is used to identify market trend.
Long :
If stochastic giving buy signal and price is over 200 EMA.
Short :
If stochastic giving sell signal and price is below 200 EMA.
Stochastic Smooth Relative Strength Index (SSRSI)This is Stochastic RSI but it uses smoothed RSI instead. You use it the same as any other Stochastic RSI :)
The features in this scripts are: RSI Length, Extra Smoothing, Extra Smooth RSI Filter, Stochastic Length, and K and D.
I hope you find this release useful!
The Stochastic RSI indicator ( Stoch RSI ) is essentially an indicator of an indicator. It is used in technical analysis to provide a stochastic calculation to the RSI indicator. This means that it is a measure of RSI relative to its own high/low range over a user defined period of time. The Stochastic RSI is an oscillator that calculates a value between 0 and 1 which is then plotted as a line. This indicator is primarily used for identifying overbought and oversold conditions.
Delta StochasticThis is the Stochastic Oscillator but now instead of reading it raw we sum the stochastic over a window and then take the cumulative sum of the difference. This allows us to have a much smoother representation of the stochastic while seeing the true momentum relative to it. I hope you can find this useful!
Refresher on Stochastic: Stochastics are range bound momentum oscillators. They calculate values between 0 and 1 which are usually plotted as 2 lines. These indicators are primarily used for identifying overbought and oversold conditions, line crossovers, divergences and increases in buying or selling pressure.
Stochastic Moving Average Convergence Divergence (SMACD)This is my attempt at making a Stochastic MACD indicator. To get this to work I have introduced a DC offset to the MACD histogram output. I figured that if theirs a Stochastic RSI their might as well be a Stochastic everything else! lmao enjoy. Honestly, from what I can tell it's even faster than Stochastic Smooth RSI.
The Stochastic Oscillator (STOCH) is a range bound momentum oscillator. The Stochastic indicator is designed to display the location of the close compared to the high/low range over a user defined number of periods. Typically, the Stochastic Oscillator is used for three things; Identifying overbought and oversold levels, spotting divergences and also identifying bull and bear set ups or signals
MACD is an extremely popular indicator used in technical analysis. MACD can be used to identify aspects of a security's overall trend. Most notably these aspects are momentum, as well as trend direction and duration. What makes MACD so informative is that it is actually the combination of two different types of indicators. First, MACD employs two Moving Averages of varying lengths (which are lagging indicators) to identify trend direction and duration. Then, MACD takes the difference in values between those two Moving Averages (MACD Line) and an EMA of those Moving Averages (Signal Line) and plots that difference between the two lines as a histogram which oscillates above and below a center Zero Line. The histogram is used as a good indication of a security's momentum
Stochastic CandlesIn this indicator I have transformed the %K line into adjustable candles. Because of this I have increased the length of the %D line to be more useful in this context. It is worth noting that you get the same momentum indication as %D set to 4 just because of the default candle transform setting. Incase you need to brush up on how stoch works here is the built in summery.
The Stochastic Oscillator (STOCH) is a range bound momentum oscillator. The Stochastic indicator is designed to display the location of the close compared to the high/low range over a user defined number of periods. Typically, the Stochastic Oscillator is used for three things; Identifying overbought and oversold levels, spotting divergences and also identifying bull and bear set ups or signals.
Global & local RSI / quantifytoolsAs the terms global and local imply, global RSI describes broad relative strength, whereas local RSI describes local relative strength within the broad moves. A macro and micro view of relative strength so to speak. Global and local RSI are simply regular RSI and stochastic RSI. Local RSI extremes ( stochastic RSI oversold/overbought) often mark a pivot in RSI which naturally reflects to price. Local RSI extremes are visualized inside the global RSI bands (upper band for overbought, lower band for oversold) in a "heat map" style.
By default:
Stochastic RSI >= 75 = yellow
Stochastic RSI >= 87 = orange
Stochastic RSI >= 100 = pink
Users also have the ability smooth the RSI with their preferred smoothing method ( SMA , EMA , HMA , RMA, WMA ) and length. This leads to different behavior in RSI, rendering the typical RSI extremes (> 70 or < 30) suboptimal or even useless. By enabling adaptive bands, the extremes are readjusted based on typical RSI pivot points (median pivots ), which gives much more relevant reference points for oversold/overbought conditions in both global and local RSI. This feature can be used without smoothing, but it rarely provides a meaningful difference, unless the RSI calculation length is messed with.
Global RSI can be plotted as candles, bars or a line. Candles and bars can be useful for detecting rejections (wicks) in relative strength, the same you would with OHLC data. Sometimes there are "hidden rejections" that are visible in relative strength but not on OHLC data, which naturally gives an advantage. All colors can be adjusted in the input menu. You also have a real-time view of the current RSI states in top right corner. Available alerts are the following: global RSI overbought, global RSI oversold, local RSI overbought and local RSI oversold.
Multi-Indicator Divergence ScreenerHere is a new screener for everyone.
I have applied my Better Divergence On Any Indicator logic to scan 3 different indicators and up to 6 different assets at one time. Shoutout to LonesomeTheBlue and QuantNomad for their respective work on divergence and scanner scripts. I've implemented similar logic to put together this scanner.
So far, I have added support for RSI, OBV, MACD, MFI, Stochastic, and FSR, though I'm happy to add more by request. Please note, for simplicity, I have removed the logic to filter for only overbought/oversold divergences. Because this can scan both centered oscillators and non-centered indicators, overbought/oversold does not apply to all of them. I may try to find a way to work in back in later, as time allows.
Personally, I like to find confluences different types of indicators. For instance, agreeable divergence with a centered strength oscillator like RSI and a volume based indicator like OBV gives me more confidence that there will be follow-through.
Like in the Better Divergence script, you can opt to scan for confirmed divergences, potential divergences, or both.
You have the option to show or hide a table that will tell you exactly which assets have divergence, on which indicator they were found, and how many points of divergence were identified. By default, bull divergences will be green, bear will be red, but you can change these base colors to your liking. Confirmed divergences are shown with a solid background, while potentials (if selected) are shown with transparent background. If all 3 of your chosen indicators have divergence in the same direction, the asset name will show in the bull or bear color to highlight the confluence.
Alerts have also been set up to fire on bar close. The message will essentially tell you the same thing the table does, but in condensed format.
You can choose to have alerts fire any time there is any divergence detected across all assets, only when there are divergences on at least 2 of the chosen indicators for a given asset, or limit them to only when all 3 indicators show divergence in agreement.
Adaptive Fisherized Stochastic Center of GravityIntroduction
I modified the script "Fisher Stochastic Center of Gravity" of @DasanC for this indicator.
I added inverse Fisher transform, cycle period adaptiveness mode (Ehlers) and smoothing to it.
Moreover, I added buy and sell and beautified some stuff.
Lastly, it is also non-repainting!
Usage
This indicator can be used like a normal stochastic, but I don't recommend divergence analysis on it.
That fisherization stuff seems to make the graphs unuseable for that because it tries.
It works well on every timeframe I would say, but lower timeframes are recommended, because of the fast nature of stochastic.
Usually it does a good job on entry confirmation for reversals and trend continuation trades.
Recommended indicator to combine with this indicator is RSI cyclic smoothed v2 .
This is the best RSI version I know. In trending market it is recommended to look more on the inner bands and in flat market it is recommended to look more on the outer bands.
When RSI shows oversold and this indicator shows a crossover of the Center of Gravity plot through the bottom line -> Long entry is confirmed
When RSI shows overbought and this indicator shows a crossunder of the Center of Gravity plot through the top line -> Short entry is confirmed
Settings
The adaptive mode is enabled by default to give you straight the whole indicator experience.
The default settings are optimized, but should be changed depending on the market.
An example:
Market has a low volatility and a high momentum -> I want a slower/higher length to catch the slower new highs and lows.
Market has higher volatility and a low momentum, -> I want a faster/lower length to catch the faster new highs and lows
Signals
Crossover
Buy -> cog crossover signalLine
Sell -> cog crossunder signalLine
Overbought/Oversold Crossover
Buy -> cog crossover lowerBand
Sell -> cog crossunder lowerBand
I use this indicator a lot, because I don't know a better stochastic on this community here.
@DasanC did an awesome work with his version I used as base for this script.
Enjoy this indicator and let the profit roll! 🔥