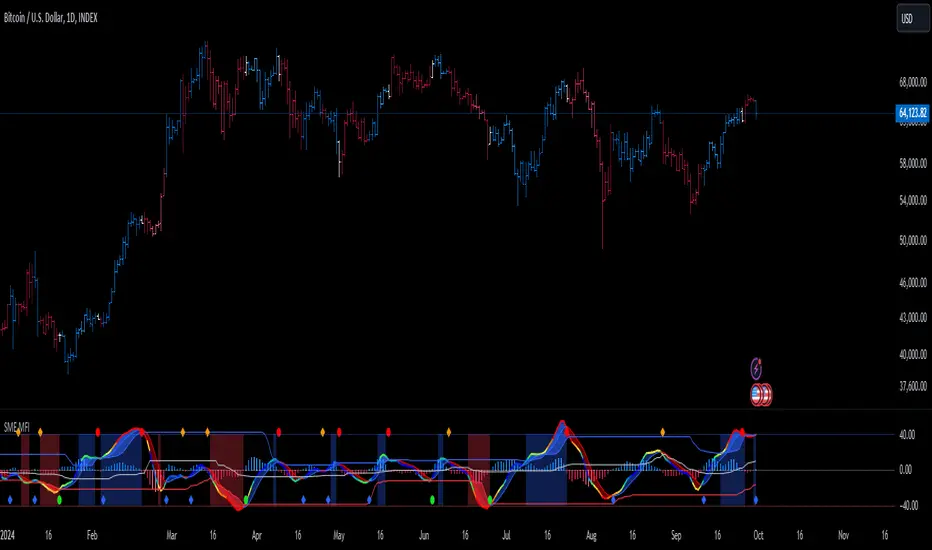
SMI Ergodic Indicator/Oscillator▮ Introduction
The Stochastic Momentum Index Ergodic Indicator (SMII) is a technical analysis tool designed to predict trend reversals in the price of an asset.
It functions as a momentum oscillator, measuring the ratio of the smoothed price change to the smoothed absolute price change over a given number of previous periods.
The Ergodic SMI is based on the True Strength Index (TSI) and integrates a signal line, which is an exponential moving average (EMA) of the SMI indicator itself.
It provides a clearer picture of market trends than the traditional stochastic oscillator by incorporating the concept of "ergodicity", which helps remove market noise.
On ther other hand, the Stochastic Momentum Index Ergodic Oscillator (SMIO) is a histogram that measures the difference between TSI and it's signal line.
By default, in TradingView both SMII and SMIO are provided independently.
Here in this script these two indicators are combined, providing a more comprehensive view of price direction and market strength.
▮ Motivation: why another indicator?
The intrinsic value of this indicator lies in the fact that it allows fine adjustments in both calculation parameters, data source and visualization, features that are not present in the standard indicators or similar.
Also, trend lines breakouts and divergences detector were added.
▮ What to look for
When using the indicator, there are a few things to look out for.
First, look at the SMI signal line.
When the line crosses above -40, it is considered a buy signal, while the crossing below +40 is considered a sell signal.
Also, pay attention to divergences between the SMI and the price.
If price is rising but the SMI is showing negative divergence, it could indicate that momentum is waning and a reversal could be in the offing.
Likewise, if price is falling but the SMI is showing positive divergence, this could indicate that momentum is building and a reversal could also be in the offing.
Divergences can be considered in both indicator and/or histogram.
Examples:
▮ Notes
The indicator presented here offers both the "SMII" and the "SMIO", that is, the "Stochastic Momentum Index Ergodic Indicator" together with the "Stochastic Momentum Index Ergodic Oscillator" (histogram), as per the documentation described in reference links.
So it is important to highlight the differences in relation to my other indicator, Stochastic Momentum Index (SMI) Refurbished .
This last one is purely based on the **SMI**, which is implemented using smoothed ratio between the relative range and the high/low range.
Although they may seem the same in some situations, the calculation is actually different. The TSI tends to be more responsive at the expense of being noisier, while the SMI tends to be smoother. Which of these two indicators is best depends on the situation, the context, and the analyst's personal preference.
Please refer to reference links to more info.
▮ References
SMI documentation
SMII documentation
SMIO documentation
Stochasticmomentumindex

SMI Ergodic Indicator/Oscillator of Money Flow Index▮ Introduction
The Stochastic Momentum Index Ergodic (SMII) indicator is a technical analysis tool designed to predict trend reversals in the price of an asset.
It functions as a momentum oscillator, measuring the ratio of the smoothed price change to the smoothed absolute price change over a given number of previous periods.
The Ergodic SMI is based on the True Strength Index (TSI) and integrates a signal line, which is an exponential moving average (EMA) of the SMI indicator itself.
The Ergodic SMI oscillator provides a clearer picture of market trends than the traditional stochastic oscillator by incorporating the concept of 'ergodicity', which helps remove market noise.
On ther other hand, MFI (Money Flow Index) is a technical analysis indicator used to measure the inflow of money into an asset and thus help identify buying and selling pressure in a given financial instrument.
When these two indicators are combined, they can provide a more comprehensive view of price direction and market strength.
▮ Motivation: why another indicator?
By combining SMII with MFI, we can gain even more insights into the market.
One way to do this is to use the MFI as an input to the SMII, rather than just using price.
This means we are measuring momentum based on buying and selling pressure rather than just price.
Furthermore, there is the possibility of making several fine adjustments to both the calculation and visualization parameters that are not present in other indicators.
▮ What to look for
When using the SMII MFI indicator, there are a few things to look out for.
First, look at the SMII signal line.
When the line crosses above -40, it is considered a buy signal, while the crossing below +40 is considered a sell signal.
Also, pay attention to divergences between the SMII and the price.
If price is rising but the SMII is showing negative divergence, it could indicate that momentum is waning and a reversal could be in the offing.
Likewise, if price is falling but the SMII is showing positive divergence, this could indicate that momentum is building and a reversal could also be in the offing.
Divergences can be considered in both indicator and/or histogram.
Examples:
▮ Notes
The indicator presented here offers both the 'SMII' and the 'SMIO', that is, the 'Stochastic Momentum Index Ergodic Indicator' together with the 'Stochastic Momentum Index Ergodic Oscillator' (histogram), as per the documentation described in reference links.
So it is important to highlight the differences in relation to my other indicator, the 'Stochastic Momentum Index (SMI) of Money Flow Index (MFI)':
This last one is purely based on the SMI , which is implemented using SMA smoothing for the relative range and the high/low range.
Although they may seem the same in some situations, the calculation is actually different. The TSI tends to be more responsive at the expense of being noisier, while the SMI tends to be smoother. Which of these two indicators is best depends on the situation, the context, and the analyst's personal preference.
Please refer to reference links to more info.
▮ References
SMI documentation
SMII documentation
SMIO documentation
MFI documentation
GKD-C Blau Stochastic Momentum Index [Loxx]Giga Kaleidoscope GKD-C Blau Stochastic Momentum Index is a Confirmation module included in Loxx's "Giga Kaleidoscope Modularized Trading System".
█ Giga Kaleidoscope Modularized Trading System
What is Loxx's "Giga Kaleidoscope Modularized Trading System"?
The Giga Kaleidoscope Modularized Trading System is a trading system built on the philosophy of the NNFX (No Nonsense Forex) algorithmic trading.
What is the NNFX algorithmic trading strategy?
The NNFX (No-Nonsense Forex) trading system is a comprehensive approach to Forex trading that is designed to simplify the process and remove the confusion and complexity that often surrounds trading. The system was developed by a Forex trader who goes by the pseudonym "VP" and has gained a significant following in the Forex community.
The NNFX trading system is based on a set of rules and guidelines that help traders make objective and informed decisions. These rules cover all aspects of trading, including market analysis, trade entry, stop loss placement, and trade management.
Here are the main components of the NNFX trading system:
1. Trading Philosophy: The NNFX trading system is based on the idea that successful trading requires a comprehensive understanding of the market, objective analysis, and strict risk management. The system aims to remove subjective elements from trading and focuses on objective rules and guidelines.
2. Technical Analysis: The NNFX trading system relies heavily on technical analysis and uses a range of indicators to identify high-probability trading opportunities. The system uses a combination of trend-following and mean-reverting strategies to identify trades.
3. Market Structure: The NNFX trading system emphasizes the importance of understanding the market structure, including price action, support and resistance levels, and market cycles. The system uses a range of tools to identify the market structure, including trend lines, channels, and moving averages.
4. Trade Entry: The NNFX trading system has strict rules for trade entry. The system uses a combination of technical indicators to identify high-probability trades, and traders must meet specific criteria to enter a trade.
5. Stop Loss Placement: The NNFX trading system places a significant emphasis on risk management and requires traders to place a stop loss order on every trade. The system uses a combination of technical analysis and market structure to determine the appropriate stop loss level.
6. Trade Management: The NNFX trading system has specific rules for managing open trades. The system aims to minimize risk and maximize profit by using a combination of trailing stops, take profit levels, and position sizing.
Overall, the NNFX trading system is designed to be a straightforward and easy-to-follow approach to Forex trading that can be applied by traders of all skill levels.
Core components of an NNFX algorithmic trading strategy
The NNFX algorithm is built on the principles of trend, momentum, and volatility. There are six core components in the NNFX trading algorithm:
1. Volatility - price volatility; e.g., Average True Range, True Range Double, Close-to-Close, etc.
2. Baseline - a moving average to identify price trend
3. Confirmation 1 - a technical indicator used to identify trends
4. Confirmation 2 - a technical indicator used to identify trends
5. Continuation - a technical indicator used to identify trends
6. Volatility/Volume - a technical indicator used to identify volatility/volume breakouts/breakdown
7. Exit - a technical indicator used to determine when a trend is exhausted
What is Volatility in the NNFX trading system?
In the NNFX (No Nonsense Forex) trading system, ATR (Average True Range) is typically used to measure the volatility of an asset. It is used as a part of the system to help determine the appropriate stop loss and take profit levels for a trade. ATR is calculated by taking the average of the true range values over a specified period.
True range is calculated as the maximum of the following values:
-Current high minus the current low
-Absolute value of the current high minus the previous close
-Absolute value of the current low minus the previous close
ATR is a dynamic indicator that changes with changes in volatility. As volatility increases, the value of ATR increases, and as volatility decreases, the value of ATR decreases. By using ATR in NNFX system, traders can adjust their stop loss and take profit levels according to the volatility of the asset being traded. This helps to ensure that the trade is given enough room to move, while also minimizing potential losses.
Other types of volatility include True Range Double (TRD), Close-to-Close, and Garman-Klass
What is a Baseline indicator?
The baseline is essentially a moving average, and is used to determine the overall direction of the market.
The baseline in the NNFX system is used to filter out trades that are not in line with the long-term trend of the market. The baseline is plotted on the chart along with other indicators, such as the Moving Average (MA), the Relative Strength Index (RSI), and the Average True Range (ATR).
Trades are only taken when the price is in the same direction as the baseline. For example, if the baseline is sloping upwards, only long trades are taken, and if the baseline is sloping downwards, only short trades are taken. This approach helps to ensure that trades are in line with the overall trend of the market, and reduces the risk of entering trades that are likely to fail.
By using a baseline in the NNFX system, traders can have a clear reference point for determining the overall trend of the market, and can make more informed trading decisions. The baseline helps to filter out noise and false signals, and ensures that trades are taken in the direction of the long-term trend.
What is a Confirmation indicator?
Confirmation indicators are technical indicators that are used to confirm the signals generated by primary indicators. Primary indicators are the core indicators used in the NNFX system, such as the Average True Range (ATR), the Moving Average (MA), and the Relative Strength Index (RSI).
The purpose of the confirmation indicators is to reduce false signals and improve the accuracy of the trading system. They are designed to confirm the signals generated by the primary indicators by providing additional information about the strength and direction of the trend.
Some examples of confirmation indicators that may be used in the NNFX system include the Bollinger Bands, the MACD (Moving Average Convergence Divergence), and the MACD Oscillator. These indicators can provide information about the volatility, momentum, and trend strength of the market, and can be used to confirm the signals generated by the primary indicators.
In the NNFX system, confirmation indicators are used in combination with primary indicators and other filters to create a trading system that is robust and reliable. By using multiple indicators to confirm trading signals, the system aims to reduce the risk of false signals and improve the overall profitability of the trades.
What is a Continuation indicator?
In the NNFX (No Nonsense Forex) trading system, a continuation indicator is a technical indicator that is used to confirm a current trend and predict that the trend is likely to continue in the same direction. A continuation indicator is typically used in conjunction with other indicators in the system, such as a baseline indicator, to provide a comprehensive trading strategy.
What is a Volatility/Volume indicator?
Volume indicators, such as the On Balance Volume (OBV), the Chaikin Money Flow (CMF), or the Volume Price Trend (VPT), are used to measure the amount of buying and selling activity in a market. They are based on the trading volume of the market, and can provide information about the strength of the trend. In the NNFX system, volume indicators are used to confirm trading signals generated by the Moving Average and the Relative Strength Index. Volatility indicators include Average Direction Index, Waddah Attar, and Volatility Ratio. In the NNFX trading system, volatility is a proxy for volume and vice versa.
By using volume indicators as confirmation tools, the NNFX trading system aims to reduce the risk of false signals and improve the overall profitability of trades. These indicators can provide additional information about the market that is not captured by the primary indicators, and can help traders to make more informed trading decisions. In addition, volume indicators can be used to identify potential changes in market trends and to confirm the strength of price movements.
What is an Exit indicator?
The exit indicator is used in conjunction with other indicators in the system, such as the Moving Average (MA), the Relative Strength Index (RSI), and the Average True Range (ATR), to provide a comprehensive trading strategy.
The exit indicator in the NNFX system can be any technical indicator that is deemed effective at identifying optimal exit points. Examples of exit indicators that are commonly used include the Parabolic SAR, the Average Directional Index (ADX), and the Chandelier Exit.
The purpose of the exit indicator is to identify when a trend is likely to reverse or when the market conditions have changed, signaling the need to exit a trade. By using an exit indicator, traders can manage their risk and prevent significant losses.
In the NNFX system, the exit indicator is used in conjunction with a stop loss and a take profit order to maximize profits and minimize losses. The stop loss order is used to limit the amount of loss that can be incurred if the trade goes against the trader, while the take profit order is used to lock in profits when the trade is moving in the trader's favor.
Overall, the use of an exit indicator in the NNFX trading system is an important component of a comprehensive trading strategy. It allows traders to manage their risk effectively and improve the profitability of their trades by exiting at the right time.
How does Loxx's GKD (Giga Kaleidoscope Modularized Trading System) implement the NNFX algorithm outlined above?
Loxx's GKD v1.0 system has five types of modules (indicators/strategies). These modules are:
1. GKD-BT - Backtesting module (Volatility, Number 1 in the NNFX algorithm)
2. GKD-B - Baseline module (Baseline and Volatility/Volume, Numbers 1 and 2 in the NNFX algorithm)
3. GKD-C - Confirmation 1/2 and Continuation module (Confirmation 1/2 and Continuation, Numbers 3, 4, and 5 in the NNFX algorithm)
4. GKD-V - Volatility/Volume module (Confirmation 1/2, Number 6 in the NNFX algorithm)
5. GKD-E - Exit module (Exit, Number 7 in the NNFX algorithm)
(additional module types will added in future releases)
Each module interacts with every module by passing data between modules. Data is passed between each module as described below:
GKD-B => GKD-V => GKD-C(1) => GKD-C(2) => GKD-C(Continuation) => GKD-E => GKD-BT
That is, the Baseline indicator passes its data to Volatility/Volume. The Volatility/Volume indicator passes its values to the Confirmation 1 indicator. The Confirmation 1 indicator passes its values to the Confirmation 2 indicator. The Confirmation 2 indicator passes its values to the Continuation indicator. The Continuation indicator passes its values to the Exit indicator, and finally, the Exit indicator passes its values to the Backtest strategy.
This chaining of indicators requires that each module conform to Loxx's GKD protocol, therefore allowing for the testing of every possible combination of technical indicators that make up the six components of the NNFX algorithm.
What does the application of the GKD trading system look like?
Example trading system:
Backtest: Strategy with 1-3 take profits, trailing stop loss, multiple types of PnL volatility, and 2 backtesting styles
Baseline: Hull Moving Average
Volatility/Volume: Hurst Exponent
Confirmation 1: Blau Stochastic Momentum Index as shown on the chart above
Confirmation 2: Williams Percent Range
Continuation: Fisher Transform
Exit: Rex Oscillator
Each GKD indicator is denoted with a module identifier of either: GKD-BT, GKD-B, GKD-C, GKD-V, or GKD-E. This allows traders to understand to which module each indicator belongs and where each indicator fits into the GKD protocol chain.
Giga Kaleidoscope Modularized Trading System Signals (based on the NNFX algorithm)
Standard Entry
1. GKD-C Confirmation 1 Signal
2. GKD-B Baseline agrees
3. Price is within a range of 0.2x Volatility and 1.0x Volatility of the Goldie Locks Mean
4. GKD-C Confirmation 2 agrees
5. GKD-V Volatility/Volume agrees
Baseline Entry
1. GKD-B Baseline signal
2. GKD-C Confirmation 1 agrees
3. Price is within a range of 0.2x Volatility and 1.0x Volatility of the Goldie Locks Mean
4. GKD-C Confirmation 2 agrees
5. GKD-V Volatility/Volume agrees
6. GKD-C Confirmation 1 signal was less than 7 candles prior
Continuation Entry
1. Standard Entry, Baseline Entry, or Pullback; entry triggered previously
2. GKD-B Baseline hasn't crossed since entry signal trigger
3. GKD-C Confirmation Continuation Indicator signals
4. GKD-C Confirmation 1 agrees
5. GKD-B Baseline agrees
6. GKD-C Confirmation 2 agrees
1-Candle Rule Standard Entry
1. GKD-C Confirmation 1 signal
2. GKD-B Baseline agrees
3. Price is within a range of 0.2x Volatility and 1.0x Volatility of the Goldie Locks Mean
Next Candle:
1. Price retraced (Long: close < close or Short: close > close )
2. GKD-B Baseline agrees
3. GKD-C Confirmation 1 agrees
4. GKD-C Confirmation 2 agrees
5. GKD-V Volatility/Volume agrees
1-Candle Rule Baseline Entry
1. GKD-B Baseline signal
2. GKD-C Confirmation 1 agrees
3. Price is within a range of 0.2x Volatility and 1.0x Volatility of the Goldie Locks Mean
4. GKD-C Confirmation 1 signal was less than 7 candles prior
Next Candle:
1. Price retraced (Long: close < close or Short: close > close )
2. GKD-B Baseline agrees
3. GKD-C Confirmation 1 agrees
4. GKD-C Confirmation 2 agrees
5. GKD-V Volatility/Volume Agrees
PullBack Entry
1. GKD-B Baseline signal
2. GKD-C Confirmation 1 agrees
3. Price is beyond 1.0x Volatility of Baseline
Next Candle:
1. Price is within a range of 0.2x Volatility and 1.0x Volatility of the Goldie Locks Mean
3. GKD-C Confirmation 1 agrees
4. GKD-C Confirmation 2 agrees
5. GKD-V Volatility/Volume Agrees
█ GKD-C Blau Stochastic Momentum Index
What is Blau Stochastic Momentum Index?
The Blau Stochastic Momentum Index (BSMI) is a technical analysis indicator used to measure momentum in financial markets. It was developed by William Blau, a well-known trader and author of several books on technical analysis.
The BSMI is based on the Stochastic Momentum Index (SMI), which is a popular momentum indicator that measures the distance between the current closing price and the recent high or low. The SMI is similar to the Stochastic Oscillator, but it takes into account the rate of change in the market, making it more responsive to short-term changes in momentum.
The BSMI is designed to provide a more accurate and responsive measure of momentum than the SMI. It uses a digital signal processing technique called "smoothed moving averages" to filter out noise and provide a smoother, more stable indicator. This technique helps to reduce false signals and provide a clearer picture of market momentum.
The BSMI indicator is plotted on a chart as a line that oscillates between -100 and +100. Values above zero indicate bullish momentum, while values below zero indicate bearish momentum. The BSMI line is typically plotted alongside the price chart to help traders identify potential turning points in the market.
Traders can use the BSMI indicator in a variety of ways, including:
1. Identifying overbought and oversold conditions: When the BSMI line reaches extreme values (e.g., above +80 or below -80), it may indicate that the market is overbought or oversold and due for a reversal.
2. Confirming trend strength: When the BSMI line is trending in the same direction as the price, it can confirm the strength of the trend and help traders stay in winning positions.
3. Identifying divergences: When the BSMI line and the price chart are moving in opposite directions, it may indicate a potential trend reversal or weakening of the current trend.
As with any technical indicator, it is important to use the BSMI in conjunction with other forms of analysis and risk management strategies. No single indicator can predict market movements with 100% accuracy, and traders should always use caution and discipline when making trading decisions.
Requirements
Inputs
Confirmation 1 and Solo Confirmation: GKD-V Volatility / Volume indicator
Confirmation 2: GKD-C Confirmation indicator
Outputs
Confirmation 2 and Solo Confirmation Complex: GKD-E Exit indicator
Confirmation 1: GKD-C Confirmation indicator
Continuation: GKD-E Exit indicator
Solo Confirmation Simple: GKD-BT Backtest strategy
Additional features will be added in future releases.
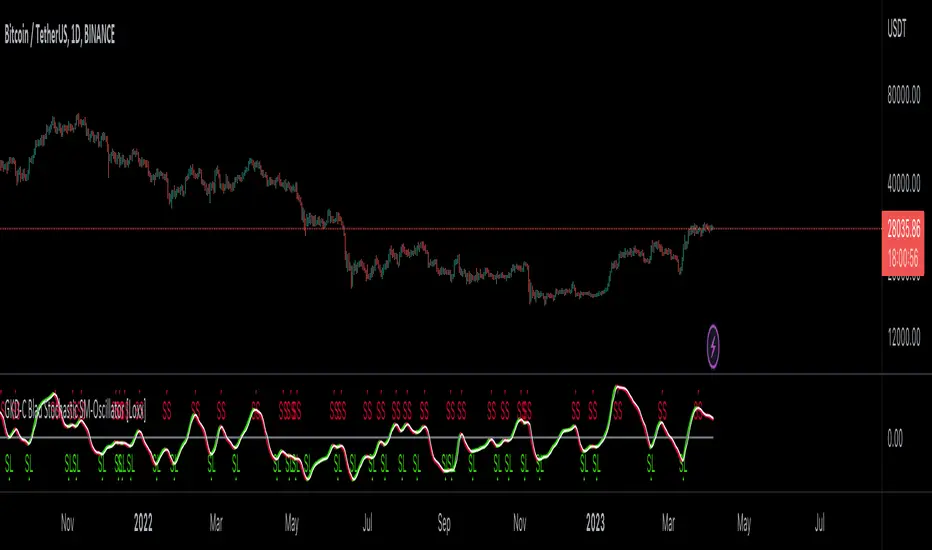
GKD-C Blau Stochastic SM-Oscillator [Loxx]Giga Kaleidoscope GKD-C Blau Stochastic SM-Oscillator is a Confirmation module included in Loxx's "Giga Kaleidoscope Modularized Trading System".
█ Giga Kaleidoscope Modularized Trading System
What is Loxx's "Giga Kaleidoscope Modularized Trading System"?
The Giga Kaleidoscope Modularized Trading System is a trading system built on the philosophy of the NNFX (No Nonsense Forex) algorithmic trading.
What is the NNFX algorithmic trading strategy?
The NNFX (No-Nonsense Forex) trading system is a comprehensive approach to Forex trading that is designed to simplify the process and remove the confusion and complexity that often surrounds trading. The system was developed by a Forex trader who goes by the pseudonym "VP" and has gained a significant following in the Forex community.
The NNFX trading system is based on a set of rules and guidelines that help traders make objective and informed decisions. These rules cover all aspects of trading, including market analysis, trade entry, stop loss placement, and trade management.
Here are the main components of the NNFX trading system:
1. Trading Philosophy: The NNFX trading system is based on the idea that successful trading requires a comprehensive understanding of the market, objective analysis, and strict risk management. The system aims to remove subjective elements from trading and focuses on objective rules and guidelines.
2. Technical Analysis: The NNFX trading system relies heavily on technical analysis and uses a range of indicators to identify high-probability trading opportunities. The system uses a combination of trend-following and mean-reverting strategies to identify trades.
3. Market Structure: The NNFX trading system emphasizes the importance of understanding the market structure, including price action, support and resistance levels, and market cycles. The system uses a range of tools to identify the market structure, including trend lines, channels, and moving averages.
4. Trade Entry: The NNFX trading system has strict rules for trade entry. The system uses a combination of technical indicators to identify high-probability trades, and traders must meet specific criteria to enter a trade.
5. Stop Loss Placement: The NNFX trading system places a significant emphasis on risk management and requires traders to place a stop loss order on every trade. The system uses a combination of technical analysis and market structure to determine the appropriate stop loss level.
6. Trade Management: The NNFX trading system has specific rules for managing open trades. The system aims to minimize risk and maximize profit by using a combination of trailing stops, take profit levels, and position sizing.
Overall, the NNFX trading system is designed to be a straightforward and easy-to-follow approach to Forex trading that can be applied by traders of all skill levels.
Core components of an NNFX algorithmic trading strategy
The NNFX algorithm is built on the principles of trend, momentum, and volatility. There are six core components in the NNFX trading algorithm:
1. Volatility - price volatility; e.g., Average True Range, True Range Double, Close-to-Close, etc.
2. Baseline - a moving average to identify price trend
3. Confirmation 1 - a technical indicator used to identify trends
4. Confirmation 2 - a technical indicator used to identify trends
5. Continuation - a technical indicator used to identify trends
6. Volatility/Volume - a technical indicator used to identify volatility/volume breakouts/breakdown
7. Exit - a technical indicator used to determine when a trend is exhausted
What is Volatility in the NNFX trading system?
In the NNFX (No Nonsense Forex) trading system, ATR (Average True Range) is typically used to measure the volatility of an asset. It is used as a part of the system to help determine the appropriate stop loss and take profit levels for a trade. ATR is calculated by taking the average of the true range values over a specified period.
True range is calculated as the maximum of the following values:
-Current high minus the current low
-Absolute value of the current high minus the previous close
-Absolute value of the current low minus the previous close
ATR is a dynamic indicator that changes with changes in volatility. As volatility increases, the value of ATR increases, and as volatility decreases, the value of ATR decreases. By using ATR in NNFX system, traders can adjust their stop loss and take profit levels according to the volatility of the asset being traded. This helps to ensure that the trade is given enough room to move, while also minimizing potential losses.
Other types of volatility include True Range Double (TRD), Close-to-Close, and Garman-Klass
What is a Baseline indicator?
The baseline is essentially a moving average, and is used to determine the overall direction of the market.
The baseline in the NNFX system is used to filter out trades that are not in line with the long-term trend of the market. The baseline is plotted on the chart along with other indicators, such as the Moving Average (MA), the Relative Strength Index (RSI), and the Average True Range (ATR).
Trades are only taken when the price is in the same direction as the baseline. For example, if the baseline is sloping upwards, only long trades are taken, and if the baseline is sloping downwards, only short trades are taken. This approach helps to ensure that trades are in line with the overall trend of the market, and reduces the risk of entering trades that are likely to fail.
By using a baseline in the NNFX system, traders can have a clear reference point for determining the overall trend of the market, and can make more informed trading decisions. The baseline helps to filter out noise and false signals, and ensures that trades are taken in the direction of the long-term trend.
What is a Confirmation indicator?
Confirmation indicators are technical indicators that are used to confirm the signals generated by primary indicators. Primary indicators are the core indicators used in the NNFX system, such as the Average True Range (ATR), the Moving Average (MA), and the Relative Strength Index (RSI).
The purpose of the confirmation indicators is to reduce false signals and improve the accuracy of the trading system. They are designed to confirm the signals generated by the primary indicators by providing additional information about the strength and direction of the trend.
Some examples of confirmation indicators that may be used in the NNFX system include the Bollinger Bands, the MACD (Moving Average Convergence Divergence), and the MACD Oscillator. These indicators can provide information about the volatility, momentum, and trend strength of the market, and can be used to confirm the signals generated by the primary indicators.
In the NNFX system, confirmation indicators are used in combination with primary indicators and other filters to create a trading system that is robust and reliable. By using multiple indicators to confirm trading signals, the system aims to reduce the risk of false signals and improve the overall profitability of the trades.
What is a Continuation indicator?
In the NNFX (No Nonsense Forex) trading system, a continuation indicator is a technical indicator that is used to confirm a current trend and predict that the trend is likely to continue in the same direction. A continuation indicator is typically used in conjunction with other indicators in the system, such as a baseline indicator, to provide a comprehensive trading strategy.
What is a Volatility/Volume indicator?
Volume indicators, such as the On Balance Volume (OBV), the Chaikin Money Flow (CMF), or the Volume Price Trend (VPT), are used to measure the amount of buying and selling activity in a market. They are based on the trading volume of the market, and can provide information about the strength of the trend. In the NNFX system, volume indicators are used to confirm trading signals generated by the Moving Average and the Relative Strength Index. Volatility indicators include Average Direction Index, Waddah Attar, and Volatility Ratio. In the NNFX trading system, volatility is a proxy for volume and vice versa.
By using volume indicators as confirmation tools, the NNFX trading system aims to reduce the risk of false signals and improve the overall profitability of trades. These indicators can provide additional information about the market that is not captured by the primary indicators, and can help traders to make more informed trading decisions. In addition, volume indicators can be used to identify potential changes in market trends and to confirm the strength of price movements.
What is an Exit indicator?
The exit indicator is used in conjunction with other indicators in the system, such as the Moving Average (MA), the Relative Strength Index (RSI), and the Average True Range (ATR), to provide a comprehensive trading strategy.
The exit indicator in the NNFX system can be any technical indicator that is deemed effective at identifying optimal exit points. Examples of exit indicators that are commonly used include the Parabolic SAR, the Average Directional Index (ADX), and the Chandelier Exit.
The purpose of the exit indicator is to identify when a trend is likely to reverse or when the market conditions have changed, signaling the need to exit a trade. By using an exit indicator, traders can manage their risk and prevent significant losses.
In the NNFX system, the exit indicator is used in conjunction with a stop loss and a take profit order to maximize profits and minimize losses. The stop loss order is used to limit the amount of loss that can be incurred if the trade goes against the trader, while the take profit order is used to lock in profits when the trade is moving in the trader's favor.
Overall, the use of an exit indicator in the NNFX trading system is an important component of a comprehensive trading strategy. It allows traders to manage their risk effectively and improve the profitability of their trades by exiting at the right time.
How does Loxx's GKD (Giga Kaleidoscope Modularized Trading System) implement the NNFX algorithm outlined above?
Loxx's GKD v1.0 system has five types of modules (indicators/strategies). These modules are:
1. GKD-BT - Backtesting module (Volatility, Number 1 in the NNFX algorithm)
2. GKD-B - Baseline module (Baseline and Volatility/Volume, Numbers 1 and 2 in the NNFX algorithm)
3. GKD-C - Confirmation 1/2 and Continuation module (Confirmation 1/2 and Continuation, Numbers 3, 4, and 5 in the NNFX algorithm)
4. GKD-V - Volatility/Volume module (Confirmation 1/2, Number 6 in the NNFX algorithm)
5. GKD-E - Exit module (Exit, Number 7 in the NNFX algorithm)
(additional module types will added in future releases)
Each module interacts with every module by passing data between modules. Data is passed between each module as described below:
GKD-B => GKD-V => GKD-C(1) => GKD-C(2) => GKD-C(Continuation) => GKD-E => GKD-BT
That is, the Baseline indicator passes its data to Volatility/Volume. The Volatility/Volume indicator passes its values to the Confirmation 1 indicator. The Confirmation 1 indicator passes its values to the Confirmation 2 indicator. The Confirmation 2 indicator passes its values to the Continuation indicator. The Continuation indicator passes its values to the Exit indicator, and finally, the Exit indicator passes its values to the Backtest strategy.
This chaining of indicators requires that each module conform to Loxx's GKD protocol, therefore allowing for the testing of every possible combination of technical indicators that make up the six components of the NNFX algorithm.
What does the application of the GKD trading system look like?
Example trading system:
Backtest: Strategy with 1-3 take profits, trailing stop loss, multiple types of PnL volatility, and 2 backtesting styles
Baseline: Hull Moving Average
Volatility/Volume: Hurst Exponent
Confirmation 1: Blau Stochastic SM-Oscillator as shown on the chart above
Confirmation 2: Williams Percent Range
Continuation: Fisher Transform
Exit: Rex Oscillator
Each GKD indicator is denoted with a module identifier of either: GKD-BT, GKD-B, GKD-C, GKD-V, or GKD-E. This allows traders to understand to which module each indicator belongs and where each indicator fits into the GKD protocol chain.
Giga Kaleidoscope Modularized Trading System Signals (based on the NNFX algorithm)
Standard Entry
1. GKD-C Confirmation 1 Signal
2. GKD-B Baseline agrees
3. Price is within a range of 0.2x Volatility and 1.0x Volatility of the Goldie Locks Mean
4. GKD-C Confirmation 2 agrees
5. GKD-V Volatility/Volume agrees
Baseline Entry
1. GKD-B Baseline signal
2. GKD-C Confirmation 1 agrees
3. Price is within a range of 0.2x Volatility and 1.0x Volatility of the Goldie Locks Mean
4. GKD-C Confirmation 2 agrees
5. GKD-V Volatility/Volume agrees
6. GKD-C Confirmation 1 signal was less than 7 candles prior
Continuation Entry
1. Standard Entry, Baseline Entry, or Pullback; entry triggered previously
2. GKD-B Baseline hasn't crossed since entry signal trigger
3. GKD-C Confirmation Continuation Indicator signals
4. GKD-C Confirmation 1 agrees
5. GKD-B Baseline agrees
6. GKD-C Confirmation 2 agrees
1-Candle Rule Standard Entry
1. GKD-C Confirmation 1 signal
2. GKD-B Baseline agrees
3. Price is within a range of 0.2x Volatility and 1.0x Volatility of the Goldie Locks Mean
Next Candle:
1. Price retraced (Long: close < close or Short: close > close )
2. GKD-B Baseline agrees
3. GKD-C Confirmation 1 agrees
4. GKD-C Confirmation 2 agrees
5. GKD-V Volatility/Volume agrees
1-Candle Rule Baseline Entry
1. GKD-B Baseline signal
2. GKD-C Confirmation 1 agrees
3. Price is within a range of 0.2x Volatility and 1.0x Volatility of the Goldie Locks Mean
4. GKD-C Confirmation 1 signal was less than 7 candles prior
Next Candle:
1. Price retraced (Long: close < close or Short: close > close )
2. GKD-B Baseline agrees
3. GKD-C Confirmation 1 agrees
4. GKD-C Confirmation 2 agrees
5. GKD-V Volatility/Volume Agrees
PullBack Entry
1. GKD-B Baseline signal
2. GKD-C Confirmation 1 agrees
3. Price is beyond 1.0x Volatility of Baseline
Next Candle:
1. Price is within a range of 0.2x Volatility and 1.0x Volatility of the Goldie Locks Mean
3. GKD-C Confirmation 1 agrees
4. GKD-C Confirmation 2 agrees
5. GKD-V Volatility/Volume Agrees
█ GKD-C Blau Stochastic SM-Oscillator
What is Blau Stochastic SM-Oscillator?
The Blau Stochastic SM-Oscillator is a technical indicator that combines the Stochastic Oscillator and the Stochastic Momentum Index (SMI) to provide a more accurate and responsive measure of momentum in financial markets. It is designed to identify potential turning points in price trends and help traders make more informed decisions about when to enter or exit a position.
The Stochastic Oscillator is a popular momentum indicator that measures the level of buying or selling pressure in the market. It compares the current closing price to the range of prices over a given period of time to determine whether the market is overbought or oversold. The Stochastic Momentum Index (SMI), on the other hand, takes into account the recent rate of change in the market and is designed to be more responsive to changes in momentum.
The Blau Stochastic SM-Oscillator calculates the difference between the Stochastic Oscillator and the SMI to create a more sensitive indicator that is able to capture short-term changes in momentum. It is plotted as a line that oscillates between -100 and +100, with values above zero indicating bullish momentum and values below zero indicating bearish momentum. The indicator also includes a signal line, which is a moving average of the Blau Stochastic SM-Oscillator, that is used to generate trading signals.
Traders use the Blau Stochastic SM-Oscillator in a variety of ways, including identifying potential entry and exit points, confirming trends, and identifying overbought and oversold conditions in the market. It is important to note, however, that no indicator is foolproof and traders should always use multiple indicators and other forms of analysis to make informed trading decisions.
Requirements
Inputs
Confirmation 1 and Solo Confirmation: GKD-V Volatility / Volume indicator
Confirmation 2: GKD-C Confirmation indicator
Outputs
Confirmation 2 and Solo Confirmation Complex: GKD-E Exit indicator
Confirmation 1: GKD-C Confirmation indicator
Continuation: GKD-E Exit indicator
Solo Confirmation Simple: GKD-BT Backtest strategy
Additional features will be added in future releases.
Stochastic Momentum Index (SMI) of Money Flow Index (MFI)"He who does not know how to make predictions and makes light of his opponents, underestimating his ability, will certainly be defeated by them."
(Sun Tzu - The Art of War)
▮ Introduction
The Stochastic Momentum Index (SMI) is a technical analysis indicator that uses the difference between the current closing price and the high or low price over a specific time period to measure price momentum.
On the other hand, the Money Flow Index (MFI) is an indicator that uses volume and price to measure buying and selling pressure.
When these two indicators are combined, they can provide a more comprehensive view of price direction and market strength.
▮ Improvements
By combining SMI with MFI, we can gain even more insights into the market. One way to do this is to use the MFI as an input to the SMI, rather than just using price.
This means we are measuring momentum based on buying and selling pressure rather than just price.
Another way to improve this indicator is to adjust the periods to suit your specific trading needs.
▮ What to look
When using the SMI MFI indicator, there are a few things to look out for.
First, look at the SMI signal line.
When the line crosses above -40, it is considered a buy signal, while the crossing below +40 is considered a sell signal.
Also, pay attention to divergences between the SMI MFI and the price.
If price is rising but the SMI MFI is showing negative divergence, it could indicate that momentum is waning and a reversal could be in the offing.
Likewise, if price is falling but the SMI MFI is showing positive divergence, this could indicate that momentum is building and a reversal could also be in the offing.
In the examples below, I show the use in conjunction with the price SMI, in which the MFI SMI helps to anticipate divergences:
In summary, the SMI MFI is a useful indicator that can provide valuable insights into market direction and price strength.
By adjusting the timeframes and paying attention to divergences and signal line crossovers, traders can use it as part of a broader trading strategy.
However, remember that no indicator is a magic bullet and should always be used in conjunction with other analytics and indicators to make informed trading decisions.

Reverse Stochastic Momentum Index On ChartIntroducing the Reverse Stochastic Momentum Index "On Chart" version
According to Investopedia :
“The Stochastic Momentum Index (SMI) is a more refined version of the stochastic oscillator, employing a wider range of values and having a higher sensitivity to closing prices.”
The SMI is considered a refinement of the stochastic oscillator developed by William Blau and introduced in 1993 in an attempt to provide a more reliable indicator, less subject to false swings.
It calculates the distance of the current closing price as it relates to the median of the high/low range of price.
The SMI has a normal range of values between +100 and -100.
When the present closing price is higher than the median, or midpoint value of the high/low range, the resulting value is positive.
When the current closing price is lower than that of the midpoint of the high/low range, the SMI has a negative value.
Here I have reverse engineered the SMI formula to derive 2 functions.
One function calculates the chart price at which the SMI will reach a particular SMI scale value.
The second function calculates the chart price at which the SMI will crossover its signal line.
I have employed those functions here to give the "crossover" price levels for :
Upper alert level ( default 40, color : aqua blue )
Mid-Line ( default value 0, color : white )
Lower alert level ( default -40, color : purple )
Signal line ( default 13, colors : bright red & lime green )
And also to give the SMI eq price ( colors : red & green )
The midline, upper and lower alert levels return the closing price which would make SMI equal to their respective values
The user can infer from this that.....
Closing above these prices will cause the Stochastic Momentum Index to cross above the associated levels
Closing below these prices will cause the Stochastic Momentum Index to cross below the associated levels
Signal line returns the closing price where Stochastic Momentum Index is equal to its signal line
The user can infer from this that.....
Closing above this price will cause the Stochastic Momentum Index to cross above the signal line
Closing below this price will cause the Stochastic Momentum Index to cross below the signal line
SMI eq price returns the closing price which would make the SMI equal to its previous value
The user can infer from this that.....
Closing above this price will cause the Stochastic Momentum Index to increase
Closing below this price will cause the Stochastic Momentum Index to decrease
Note : all returned prices have a returned value filter to replace any values below zero with zero to help prevent auto focus issues.
These levels are displayed as plotted lines on the chart and also as an optional infobox with choice of displayed info.
This allows the user to see directly on the chart the interplay between the various crossover levels and price action and to precisely plan entries, exits and stops for their SMI based trades.
Traditionally traders and analysts will consider:
Positives values above 40 indicate a bullish trend
Negative values below -40 indicate a bearish trend .
Common traditional ways to derive signals from the SMI :
When the SMI crosses below -40 and then moves back above it, a buy signal is generated.
When the SMI crosses above +40 and then moves back below it, a sell signal is generated.
When the SMI line crosses above the signal line. A signal to buy is generated
When the SMI line crosses below the signal line signal to sell is generated.
When the SMI crosses above the zeroline, signal line and the SMI eq level many interpret that as a full bullish bias signal and take trades only in that direction, vice versa for bearish bias.
Traders also look for divergences between the SMI and price action.
The SMI is often used in conjunction with the Chande Momentum Oscillator or R squared indicator to determine overall market trendiness where the SMI is used to determine the direction of the trend, and also with volume indicators to show if the momentum carries significant selling or buying pressure.

CT Reverse Stochastic Momentum IndexIntroducing the Caretakers Reverse Stochastic Momentum Index .
According to Investopedia :
“The Stochastic Momentum Index (SMI) is a more refined version of the stochastic oscillator, employing a wider range of values and having a higher sensitivity to closing prices.”
The SMI was developed by William Blau and introduced in 1993 in an attempt to provide a more reliable indicator, less subject to false swings.
It calculates the distance of the current closing price as it relates to the median of the high/low range of price.
The SMI has a normal range of values between +100 and -100.
When the present closing price is higher than the median, or midpoint value of the high/low range, the resulting value is positive.
When the current closing price is lower than that of the midpoint of the high/low range, the SMI has a negative value.
I have reverse engineered the SMI formula to derive 2 functions.
One function calculates the chart price at which the SMI will reach a particular SMI scale value.
The second function calculates the chart price at which the SMI will crossover its signal line.
I have employed those functions here to give the price level where the SMI will equal :
Upper alert level ( default 40 )
Zero-Line
Lower alert level ( default -40 )
Signal line
The user can infer from these values that when closing prices cross the levels shown, the SMI will cross the indicated level or signal line.
If the price value is less than zero the value will show "impossible".
The advantage of knowing the exact prices that this will happen should give the user an additional edge and precision in risk management.
These crossover levels are displayed via an optional infobox with choice of user selected info.
There is an option to change the decimal places shown.
For easy and intuitive reading of the indicator when ….
SMI is above the signal line both the SMI and Signal line and the space between them is Green.
SMI is below the signal line both the SMI and Signal line and the space between them is Red.
SMI is above the Zeroline the space between them is Green.
SMI is below the Zeroline the space between them is Red.
Traditionally traders and analysts will consider:
Positives values above 40 indicate a bullish trend
Negative values below -40 indicate a bearish trend .
Common traditional ways to derive signals from the SMI :
When the SMI crosses above the zeroline, a buy signal is generated.
When the SMI crosses below the zeroline, a sell signal is generated.
When the SMI crosses below -40 and then moves back above it, a buy signal is generated.
When the SMI crosses above +40 and then moves back below it, a sell signal is generated.
When the SMI line crosses above the signal line. A signal to buy / take profit is generated
When the SMI line crosses below the signal line. A signal to sell / take profit is generated.
Traders also look for divergences between the SMI itself or the SMI histogram and price action.
The SMI is often used in conjunction with the Chande Momentum Oscillator or R squared indicator to determine overall market trendiness where the SMI is used to determine the direction of the trend, and also with volume indicators to show if the momentum carries significant selling or buying pressure.

Triple Stochastic Momentum Index(TSMI)This script is a stochastic momentum index (SMI) indicator that is designed to view the flow of three stochastic momentums at once.
You can easily see the change in momentum by applying the values used in the triple stochastic form to the basic SMI usage.
이 스크립트는 3가지 stochastic momentum의 흐름을 한번에 볼 수 있도록 만들어진 SMI(stochastic momentum index)지표 입니다.
기본적인 SMI의 사용방식을 triple stochastic형식에서 사용되는 수치를 적용하여 쉽게 모멘텀의 변화를 확인 할 수 있습니다.
SMI Stochastic Momentum Index 2x set per Baiynd -Tom1traderStochastic Momemtum Index - a true strength indix tsi with a moving average signal.
This uses the built in with modifications per Anne-Marie Baiynds recommendations - she uses a SIMPLE MOVING AVERAGE
for the signal (signal length at 4x the short length seems to work best to reflect actual price action support or resistance)
Note: Default settings in this code have been updated to her most recent recommendations that I have seen.
video is entitled "The Most Reliable Technical Indicator I Have Ever Used"
Note: I have not discussed this with Ms . Baiynd this is my interpretation of the vids I have seen.
Anne-Marie Baiynd also in talks / videos refers to the use of short / long of 4/20 and 6/40 and have combined both of them here
This overlays both of them with their respective SMAs- a 4/20 lengths and a 6/40 lengths in darker colors and smallest linewidth.
this gives a perspective on slightly higher time frame action.
USAGE: Generally above and below the black dashed zero line is long or short
KEYS: -Plot position relative to zero black, red overbought, green oversold and the gray lines at .25 -.25
Indicator action often more significant out side of the more "neutral" +.25/-.25 area
and near or above/below the red/green dashed lines.
-Steepness of slopes
Slopes of smi plots relate directly to price action where steeper is more momentum.
- -SMI blue relation to its simple moving average orange and the SMI longer dark blue with moving average purple.
MAJOR FEATURE - The average acts as support or resistance to the SMI and the price unless breaking out.
Price is often pausing or reversing iin finding primary/secondary support or resistance as well at those times.
You Can See and anticipate Where Support or Resistance may be Encountered. (much unlike most indicators)
My standard caveat -use at your own risk. Like anyone else I do not know what the next bar/candle is going to do
and I place all of my trades with a management plan in place for the worst case scenario.
That said enjoy your charting and trading.
This was coded starting with the built-in indicator "SMI Ergontic Oscilator / Indicator". You do this by within the Pine Editor select "New" tab and
choose the indicator that you want the code for. This populates the editor with the code for the built in indicator and you can modify it to suit your
purposes and save it / publish it and etc. Thanks for following this and Keep Smiling!

Inverse Fisher Transform on SMI (Stochastic Momentum Index)Inverse Fisher Transform on SMI (Stochastic Momentum Index)
About John EHLERS:
From California, USA, John is a veteran trader. With 35 years trading experience he has seen it all. John has an engineering background that led to his technical approach to trading ignoring fundamental analysis (with one important exception).
John strongly believes in cycles. He’d rather exit a trade when the cycle ends or a new one starts. He uses the MESA principle to make predictions about cycles in the market and trades one hundred percent automatically.
In the show John reveals:
• What is more appropriate than trading individual stocks
• The one thing he relies upon in his approach to the market
• The detail surrounding his unique trading style
• What important thing underpins the market and gives every trader an edge
About INVERSE FISHER TRANSFORM:
The purpose of technical indicators is to help with your timing decisions to buy or
sell. Hopefully, the signals are clear and unequivocal. However, more often than
not your decision to pull the trigger is accompanied by crossing your fingers.
Even if you have placed only a few trades you know the drill.
In this article I will show you a way to make your oscillator-type indicators make
clear black-or-white indication of the time to buy or sell. I will do this by using the
Inverse Fisher Transform to alter the Probability Distribution Function (PDF) of
your indicators. In the past12 I have noted that the PDF of price and indicators do
not have a Gaussian, or Normal, probability distribution. A Gaussian PDF is the
familiar bell-shaped curve where the long “tails” mean that wide deviations from
the mean occur with relatively low probability. The Fisher Transform can be
applied to almost any normalized data set to make the resulting PDF nearly
Gaussian, with the result that the turning points are sharply peaked and easy to
identify. The Fisher Transform is defined by the equation
1)
Whereas the Fisher Transform is expansive, the Inverse Fisher Transform is
compressive. The Inverse Fisher Transform is found by solving equation 1 for x
in terms of y. The Inverse Fisher Transform is:
2)
The transfer response of the Inverse Fisher Transform is shown in Figure 1. If
the input falls between –0.5 and +0.5, the output is nearly the same as the input.
For larger absolute values (say, larger than 2), the output is compressed to be no
larger than unity. The result of using the Inverse Fisher Transform is that the
output has a very high probability of being either +1 or –1. This bipolar
probability distribution makes the Inverse Fisher Transform ideal for generating
an indicator that provides clear buy and sell signals.
