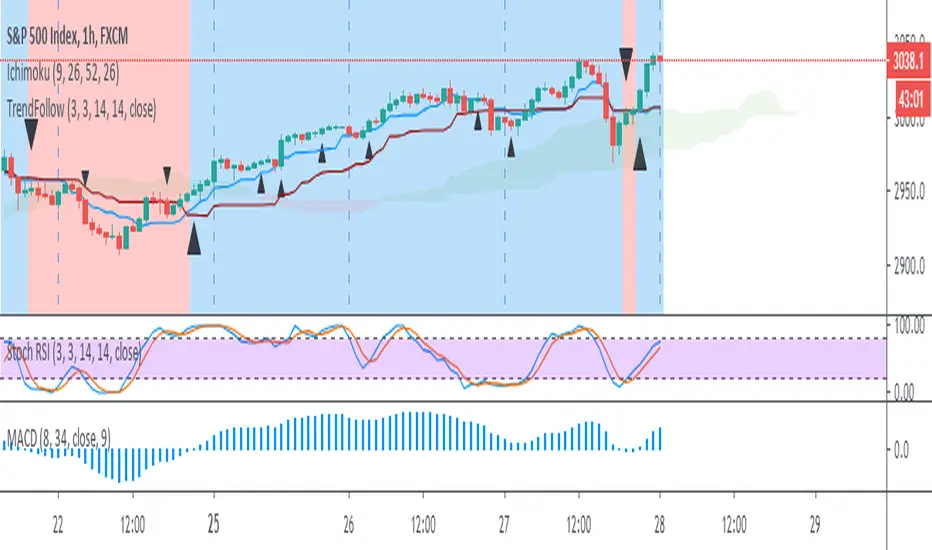
Trend Follow with kijun-sen/tenkan sen for 1 Hour SPX
This script determines, plots and alerts on probable trend initiation and continuation points, using tenkan-sen(conversion line of ichimoku), kijun-sen(baseline of ichimoku) and stochastic RSI, for 1 H SPX.
New long/short trend initiates when prices cross above/below kijun sen. The trend continues when prices cross above/below tenkan-sen or stochastic RSI crosses up/down its signal line, while prices are above/below kijun-sen.
It is good to take partial profit between 10-15 points gain and trail the left with stops below kijun-sen line.
While placing the order, using 2-3 points buffer above/below of signal bars is recommended. Additionally, please be careful about clouds and do not place long/short orders below/above clouds.
Stochastic RSI (STOCH RSI)

Trend Follow with 8/34 EMA and Stoch RSI for 1 Hour SPX
The script determines and plots entry points for 1 hour S&P index using 8/34 emas and stochastic RSI. When 8 ema above/below 34 ema up/down crosses of stochastic RSI are considered as long/short entries. Entry prices should be above/below high/low of the signal bars accordingly. Ichimoku cloud can be used as extra filtering.
Lobowass 2 StochasticsThis script uses a DMI, Stochastic, and two stochastic RSI, when they are all overbought or oversold (also applying price action and looking for bounce points) we can obtain a greater probability that the price will go in the direction we expect
This script is compact, which can be very useful for many traders
Default values
DMI:
Lenght=10
Stolenght=3
Stochastic:
K=14
D=3
Smooth=3
RSI Stochastic:
K=3
D=3
Lenght=6
Lenght Stoch=6
RSI Stochastic 2:
K=3
D=3
Lenght=14
Lenght Stoch=14
The indicators configured in this way can bring greater efficiency, do not confront only them, also use price action or other confirmat
They are arranged in a graph, such that the DMI has the oversold at 10 and the overbought at 90, the stochastic oversold at 120 and overbought at 180, first stochastic RSI at oversold at 220 and overbought at 280, and last stochastic RSI at oversold at 320 and overbought at 380, you can configure them your way taking into account that the DMI range is from 0-100, stochastic 100-200, stochastic RSI 200-300 and stochastic RSI 2 from 300-400

Stoch.RSI+RSI+MFI+CM_Williams_Vix_Fix_V3An update of my previous code "Stoch.RSI+RSI+DoubleStrategy+CMWilliamsVixFix+MFI".
Updates:
- Script converted to v4 and to study version
- Removed the "Double strategy" code because it doesn't work much well
- Replaced the "CM_Williams_Vix_Fix" (by ChrisMoody) code with its updated version "CM_Williams_Vix_Fix_V3" that also features custom filtered alerts directly onto candlesticks (don't forget to check its author's profile)
- Other minor graphical adjustments
Stochastic RSI with Overbought OverSold Crosses coloredColored Stoch Rsi .
It is possible to show Oberbought and Oversold Crosses only or all Crosses via Checkbox .
It is a script for Beginner. Stochastic RSI is more readable.
Have Fun

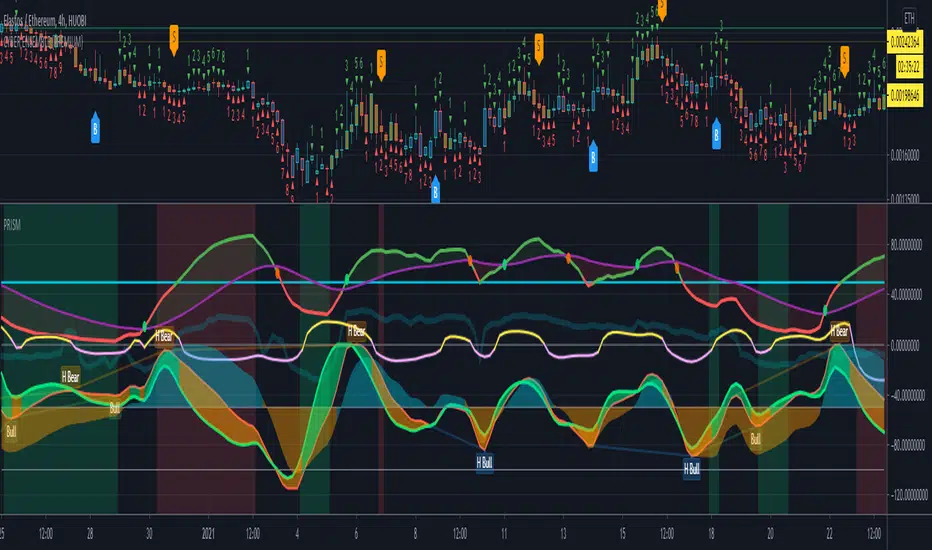
PRISM Oscillators Set {PREMIUM}The PRISM Oscillator Set consists of:
(1) A modified-pSAR derived main driving oscillator (P-Oscillator).
(2) With MAJeStic (Momentum, Acceleration, Jerk, Snap) Oscillators Set (M-, A-, J-, S-Oscillators respectively).
User can switch the main oscillator to RSI-mode (default), as well as reverting to configurable EMA/SMA MACD mode as well.
The P-Oscillator
The P-Oscillator (centered at 50 in the y-axis) indicates the instantaneous bullish/bearish cycle of the market, and the degree of which.
A MA-line is provided as well (VWMA-mode is set as the default, but user can choose to switch to SMA-mode).
The crossing of the P-Oscillator into its MA-line signals a significant turn in the P-Oscillator , similar to how the cross between MAs are being used to signal a golden/death-cross (example: P-Oscillator crossing down its MA-line indicates a probable shift into the bearish phase).
The MAJeStic-Oscillators
The MAJeStic-Oscillators are derived from the main P-Oscillator .
The M-Oscillator is the momentum oscillator, to more clearly visually indicate the current momentum phase of the main P-Oscillator -- i.e. when the oscillator is above the zeroline at -50, the P-oscillator is in an uptrend; and the magnitude of which indicates the velocity (or to be more precise, the speed) of the current momentum trend.
The AJ-Ribbon consists of the acceleration and jerk oscillators, to indicate the hidden underlying trends in the momentum. They can be thought of as the hidden force/hand that pushes and pulls the momentum oscillator upwards or downwards.
Both the M-Oscillator and the AJ-Ribbon are y-shifted down with its zeroline set at -50, simply for the purpose of clarity of presentation for this multiple-oscillator script.
The S-Oscillator is centered about the 0 as its zeroline. It is a highest-order indicator, derived from the AJ-Ribbon , and is an extremely sensitive indicator -- which is able to dig up even the more subtle market trends that may later cascade into a more macro trend. For example: when it crosses from the negative into the positive (especially with a steeply positive slope) and holds above the zeroline, it is then likely that price will see some upside movement ahead (depending on the magnitude of the oscillator as well), even if it may presently be simply moving sideways or even downwards (i.e. a divergence in the S-oscillator wrt the current price movement).
The alignment of the various indicators gives the clearest signal of the market trend, however, that naturally isn't always the case. Hence, when signals from the oscillators looks conflicted, the higher order oscillators (i.e. the AJ-Ribbon, and the S-Oscillator) will be helpful indicators of possible movement incoming; alternatively looking for divergence and hidden divergence of the P-Oscillator (set to RSI-mode) is also an effective strategy.
This oscillator set is suitable to be applied on any timeframes and on any charts.
This oscillator does not give precise price targets, but only offers a qualitative view of the present as well as the probable incoming price action.
To (attempt to) predict price targets, I personally use the PRISM Oscillator Set in conjunction a combination of various support & resistance analytical strategies: e.g. VPVR-levels, moving averages, trend-lines, Ichimoku Cloud, etc. and looking/waiting for sufficient candle closing and break-outs for confirmation, etc.
The PRISM Oscillator Set provide a momentum-focused perspective of the current market.
While my other script, Cyber Ensemble ( which generates buy/sell signals base on the scoring of a large ensemble of technical indicators + and modified by a series of filters ), provides a technical perspective of the current market; and which I frequently use conjunction with the PRISM Oscillator Set .
~ * ~ * ~ * ~ * ~ * ~ * ~ * ~ * ~ * ~ * ~ * ~ * ~ * ~ * ~ * ~ * ~ * ~ * ~ * ~ * ~
Note:
In no way is this intended as a financial/investment/trading advice. You are responsible for your own investment/trade decisions.
Please exercise your own judgement for your own trades base on your own risk-aversion level and goals as an investor or a trader. The use of OTHER indicators and analysis in conjunction (tailored to your own style of investing/trading) will help improve confidence of your analysis, for you to determine your own trade decisions.
~ * ~ * ~ * ~ * ~ * ~ * ~ * ~ * ~ * ~ * ~ * ~ * ~ * ~ * ~ * ~ * ~ * ~ * ~ * ~ * ~
Please PM me for access information.
© cybernetwork
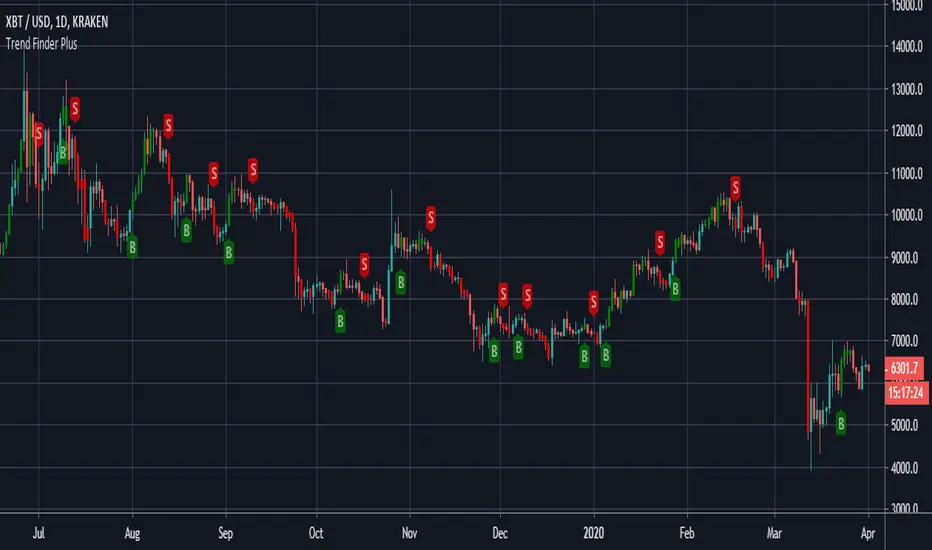
Trend Finder Plus - theCrypster===========
Trend Finder Plus
===========
A combination of various trend analysis techniques - MA's, pivotal breakouts, and Stochastics - Combined to make one super handy indicator!
-----------
Editable settings include a custom "Trend Finder" length and the usual settings for utilizing a "Stochastic RSI" .
This is a really useful tool for catching the very start of potentially bigger swings and movements - but it can get easily and display false signals during choppy periods - use with other indicators for a true sense of what can be achieved with this.
Good Luck and Happy Trading!
RSI StochRSI Days of Week ALL IN ONEPlot flexibly three indicators in one window:
RSI
Stochastic RSI
Days of the week in the background
Besides the higher and lower extreme levels, I have also highlighted the middle range for RSI. I find it useful for corrections during a trend, where it usually tops or bottoms.
Enter settings, and you can manage in Inputs what to plot.
Moreover, save space with one indicator.

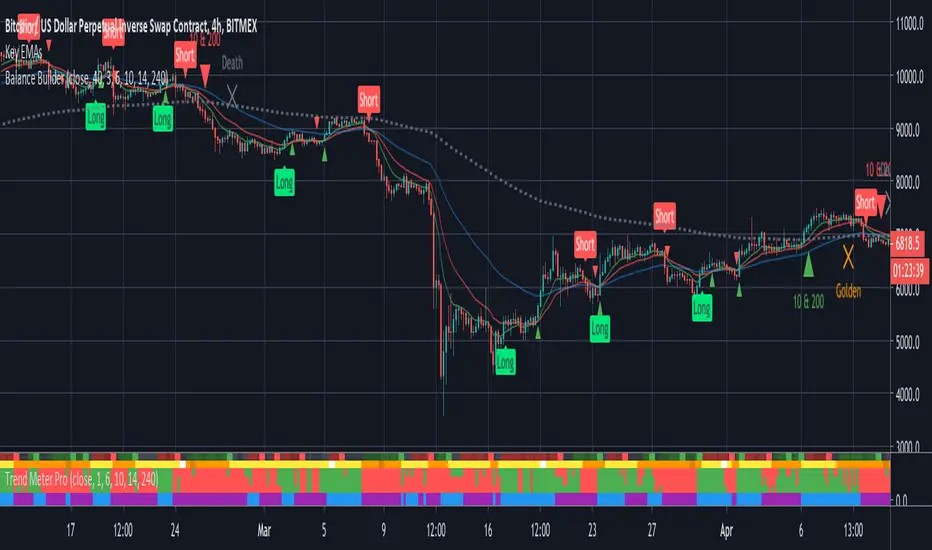
Balance BuilderBalance Builder is the culmination of everything I've learned over the last few years and will be my exclusive FOREX and crypto trading indicator going forward. I will be developing and updating it on a regular basis.
The unique signals it generates do not repaint, nor do they lag. What you are seeing is real-time and will not change once the current candle closes.
This technology analyses trend strength, momentum and the outcome of previous candles to determine the best time to accurately go long or short.
Use the labels to influence your own manual trading decisions or enable the built in alerts to hook in to your trading bot of choice and automatically trade around the clock.
The system can be applied to any instrument but the defaults are tuned for trading Bitcoin on the 4 hour chart. Higher time frames such as this are recommended to increase the win-rate but the parameters can easily be tweaked to cater for shorter term trading.
Important: I personally use Heikin Ashi candles with this script to further filter entries. An option is available within the script settings to toggle this on/off should you wish to do the same.
This is a premium script. Please DM me for access.
StochRSI by Trader PrasadThe Stochastic RSI ( Stoch RSI ) indicator was developed by Tushard Chande and Stanley Kroll. They introduced their indicator in their 1994 book The New Technical Trader.
Original formula is
Stoch RSI = ( RSI - Lowest Low RSI ) / (Highest High RSI - Lowest Low RSI )
I have changed some settings as per my back testing.

RSI & StochasticA combination of RSI and Stochastic using default settings.
- RSI or Relative Strength Index is the white line.
- Stochastic %K is the aqua line
- Stochastic %D is the orange line
- The purple rectangle is the RSI range going from 30 (oversold) at the bottom to 70 (overbought)
- The top dotted line indicates the price being overbought on the stochastic
- The bottom dotted line indicates the price oversold on the stochastic
I mainly use both indicators to spot divergence/ potential upcoming turning points (tops or bottoms).
For example on the chart the white line shows the price of Bitcoin Rising
While the yellow line shows the stochastic declining and the red RSI stayed more or less at the same level.
Another way to use this indicator is to use the aqua line crossing above the orange line as an entry for a long trade this strategy is most useful when both are near the bottom of the range. The opposite is true for short trades but
both should be combined with other indicators such as moving averages support levels or volume for best results.
Generally RSI is more useful in trending markets & the stochastic is more useful in sideways or choppy markets.

EMA Trend MeterThis is a useful trend analysis tool that I've seen others sell for high monthly subscription fees. I'm giving my version away for free.
The script consists of 3 EMAs, all weighted against the same baseline moving average to give you an overview of the trend. My meter shows the status of each EMA; either up (green) or down (red). When you see two of the same colour vertically aligned then the trade will most likely go in that direction. When all three are the same colour then it's a certainty.
The top row represents the stochastic RSI direction to further validate the EMA signals. Grey is up, black is down.
Default values for the EMAs are 7, 14 and 21 but please tweak to fit your chart.
Alerts are built in for longs and shorts when either 2 or 3 EMAs are the same colour and the stochastic indicator agrees. They'll fire only in the first instance (long/short) so you won't receive repeat alerts on each candle.
NOTE: This is a metered indicator and you get only the bottom portion of what's shown here. The signals overlaid on the chart are merely to demonstrate when the meter alerts would fire.

unRekt - Dogs of WarThis indicator includes StochRSI, RSI and a double RSI-EMA. By combining StochRSI with the RSI , it becomes very powerful for directional moves. The double EMA-RSI powerful in itself, helps filter out typical noise by showing trend strength allowing for greater profits by holding the trade longer.

WhiteSRSI
This indicator, combines stochastic and rsi of different timeframes, is convenient when used on younger timeframes.

CryptoSignalScanner - Stochastic Trend IndicatorDESCRIPTION:
This script has been designed to provide the ideal buy and sell moment on the lower time frames.
• This scripts is based on the Stochastic RSI Indicator.
• When we are in an uptrend the background becomes green.
• When we are in a downtrend the background becomes red.
• It is also possibility to set the overbought and oversold range.
HOW TO USE:
• When the blue line (stochastic K) has crossed above the red line (stochastic D) in the oversold area then this is the ideal moment to get into a trade.
• When the blue line (stochastic K) has crossed below the red line (stochastic D) in the overbought area then this is the ideal moment to get out of a trade.
• Use this together with the CryptoSignalScanner - Advanced BUY/SELL indicator to get a stronger confirmation.
• Use the Fibonacci tool together with the Eliot Waves to help you to find the ideal buy or sell moment.
HOW TO GET ACCESS TO THE SCRIPT:
• Use the link below to subscribe to our indicators.
REMARKS:
• This advice is NOT financial advice.
• We do not provide personal investment advice and we are not a qualified licensed investment advisor.
• All information found here, including any ideas, opinions, views, predictions, forecasts, commentaries, suggestions, or stock picks, expressed or implied herein, are for informational, entertainment or educational purposes only and should not be construed as personal investment advice.
• We will not and cannot be held liable for any actions you take as a result of anything you read here.
• We only provide this information to help you make a better decision.
• While the information provided is believed to be accurate, it may include errors or inaccuracies.
Good Luck,
The CryptoSignalScanner Team

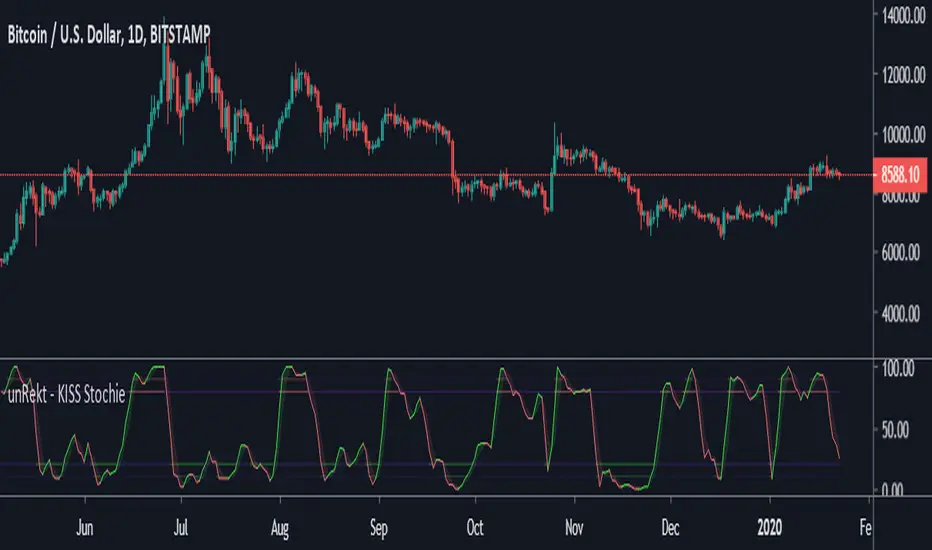
unRekt - KISS StochieStochie is the StochRSI indicator and is part of the ''keeping it simple' series that have a similar color scheme. The Stochastic RSI technical indicator applies the Stochastic Oscillator to values of the Relative Strength Index (RSI). The indicator thus produces two main plots FullK and FullD oscillating between oversold and overbought levels. The StochRSI can also be used to detect divergence and trend.
CryptoSignalScanner - Advanced BUY/SELL indicatorDESCRIPTION:
This script has been designed to do some swing trading on 4 hour and daily candles.
After some adjustments it also gives a good result on the lower timeframes 5m, 15m and 1h.
• This scripts is based on RSI, Stoch RSI and some other indicator(s).
• It provides BUY, SELL, STRONG BUY and STRONG SELL labels when loading the script.
• It is also possibility to set a BUY, STRONG BUY, SELL, STRONG SELL, BUY/SELL or STRONG BUY/STRONG SELL alert.
HOW TO USE:
• When a BUY signal appears it means that the trading pair is oversold. Wait for the reversal to buy. Use the Fibonacci tool together with the Eliot Waves Theory to BUY or SELL or wait for the SELL signal.
• When a SELL signal appears it means that the trading pair is overbought. SELL immediately or use the Fibonacci tool together with the Eliot Waves Theory to SELL.
FEATURES:
• You can show/hide the labels based on RSI, Stoch RSI input values.
• You can show/hide the labels based on Stoch RSI K and R input values.
• You can show/hide the labels based on Stoch RSI K and R crossing.
• You can show only STRONG BUY or STRONG SELL labels.
• Etc...
HOW TO GET ACCESS TO THE SCRIPT:
• Use the link below to subscribe to our indicators.
• Based on this script we provide telegram channels that provides signals for all Binance BTC, ETH, USDT and BNB pairs.
REMARKS:
• This advice is NOT financial advice.
• We do not provide personal investment advice and we are not a qualified licensed investment advisor.
• All information found here, including any ideas, opinions, views, predictions, forecasts, commentaries, suggestions, or stock picks, expressed or implied herein, are for informational, entertainment or educational purposes only and should not be construed as personal investment advice.
• We will not and cannot be held liable for any actions you take as a result of anything you read here.
• We only provide this information to help you make a better decision.
• While the information provided is believed to be accurate, it may include errors or inaccuracies.
Good Luck,
The CryptoSignalScanner Team

Scoring Development Sample [BigBitsIO]This script shows a sample of how to do confidence weighted scoring indicators and for loops with Pine. This indicator may or may not be found useful, it's intent is to provide a sample on how to create such an indicator and use certain Pine features.
Features:
- Defined points based on the confidence of RSI and Stochastic indicator
- Defined points based on candle color and sma trend direction
- For loops used to calculate bonus points for "extended periods" of confidence.
*** DISCLAIMER: For educational and entertainment purposes only. Nothing in this content should be interpreted as financial advice or a recommendation to buy or sell any sort of security or investment including all types of crypto. DYOR, TYOB. ***

W5T Roller CoasterOur new Roller Coaster indicator is perfect for trading Stocks, Futures, Forex, Commodities, & Cryptocurrencies.
The Roller Coaster is a Stochastic/MACD Cross with Special EMA Points of Control for both Long and Short trades.
Our algorithm works everything out behind the scenes, keeping your chart clean.
With the purchase of our indicator, you will have access to:
Entry Price
Stop Loss Price
Trade Management
Trailing Stop Positions
Get in early on a Trend, or Trade Long & Short as an instrument moves with a range
Check out our signature to learn more!

[fikira] MACD & RSI+Stoch + DivergencesThis is a new version of my "Divergences"
Compared to my "Divergences (Pivots)", this is calculated totally different
There are 3 options:
- MACD
- RSI
- Stoch RSI
Since this script is very heavy in calculation it is limited in time (= inspired from a script of "Che_Trader")
Also it uses "max_bars_back" (=1000)
For MACD and Stoch RSI there is a "custom Divergences Period", which compares more then 7 Pivot Points,
the higher the number, the less reliable, it is not necessary to use this, but it is there,
also you can change the "leftbars" and "rightbars", again, it is not necessary to change, but you can...
Linewidth and style of the Divergences lines can be changed
Thank you!

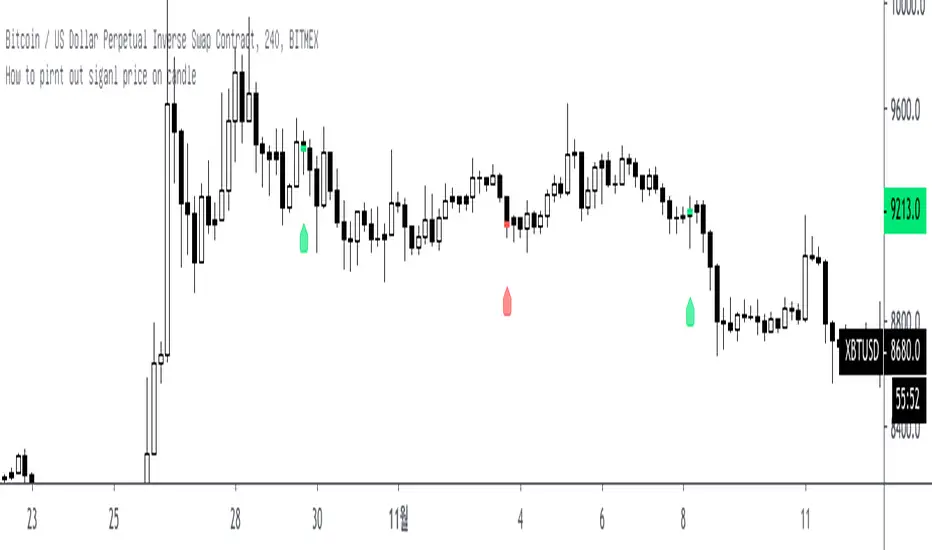
How to pirnt out siganl price on candleHi, this is Yong from Mby_lab
this codes explain how print out signal price on candles.
only working on 4H timeframe.
Core code based on 3H timeframe so This time close show on 4H, realtime close.
if 3H close fixed, then it will show on 4H line break style and this is not show twice on candle cause like this
When 3H closed / 4H = realtime
4H closed / 3H = realtime
then like this
3am close show 4am candle
6am close show next 4H candle for 8am~
..
.....
enjoy this!
this codes can help solve timeframe / security issues.
//
StOrc
Combining both Stochastic and Stochastic RSI for better data consolidation for more accurate user analysis
