Stochastic MTF IICombines Stochastics, RSI and MACD Histogram to give a complete picture of the momentum.
The main two lines are stochastics from the higher time frame(current time frame* 4).
The red columns are stochastic of macd histogram.
The green histogram is the stochastic rsi of price.
The dots at 50 line is the correlation between price and macd+rsi combo.
Stochastic RSI (STOCH RSI)

Stochastic RSI+Applies signal values to significant changes in momentum and can be used in conjunction with other indicators and analysis to improve trade timing.
Both "Signal Up" and "Signal Down" can be used for alerts.
The magnitude of the signal is the difference between K and D.
(See the code for the logic and implementation.)
Signal Up occurs when momentum is within the band and moving upward.
Signal Down occurs when momentum is within the band and moving downward.
Interpretation Note:
The Stochastic RSI is known for false signals, so it should never be used as a pure buy or sell signal. It is useful as a warning or to help with trade timing.
A good example of this is: If you are bullish on a stock, and the signal is negative (signal down), then it may be wise to not buy until the recent change in momentum has dissipated.

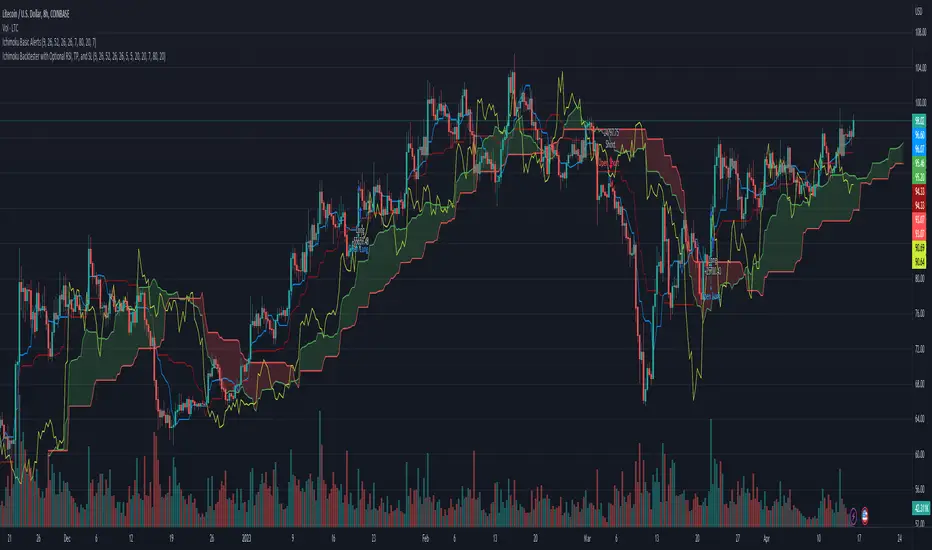
Ichimoku Backtester with TP, SL, and Cloud Confirmation OptionStarted with the Basic Ichimoku strategy from Mizuki32. Added Take Profit, Stop Loss (for both long and short), and a toggle to wait for confirmation from the cloud.

Triangular Stoch RSI BandsThe indicator calculates Triangularity over Stoch RSI Overbought and Oversold Conditions
So Ever wondered how a overbought and oversold condition looks if the values are triangualrised
The indicator plots auto band levels on top of price
Enjoy!

StochRSI x RSI x CCI x EMAsWanted to put this out there. Kind of a rough explanation but basically I wanted to build an indicator that takes out emotions and is easy to read. The indicator is basically RSI, stochRSI, CCI, and EMAs into an easy to read package. The traffic lights at the end will tell you if stochRSI/RSI and price action above according to EMA ribbon are in agreement. RSI with a period of 2 also always seemed very useful to me but it was just extremely distracting to look at it. I tried to make many rules in this indicator to find as much confluence between RSI, stochRSI, CCI, and EMAs to help you make better decisions. What is shown on the indicator is not necessarily a buy/sell signal. It should be seen as a way to view strength of price and possible momentum changes.
I find that one of the biggest distractions of indicators is taking your eyes off what is really happening at the chart above. This indicator uses popular and well used tools and helps you to get an easier visual of what is happening.
Purple lines at top and bottom: Short RSI ob/os
Red/orange and blue/green lines at top and bottom: When stochRSI kd and CCI also crosses +/- 100 or 200
Blue background: when stochRSI k > d and short RSI crosses above 30
Red background: when stochRSI k < d and short RSI crosses below 70
Green crosses: StochRSI is above 80 and making higher highs
Red X crosses: StochRSI is below 20 and making lower lows
Red/green fill of stochRSI and purple/blue dots on RSI: When short RSI and stochRSI are both ob/os
Red/green fill of RSI: Green when Long rsi > 50, red when Long rsi < 50
60/40 lines: Possible support/resistance for RSI
Traffic lights
1st light: Long RSI > EMA and stoch RSI k>d or vice versa
2nd light: Price above EMA 1 and 2 or vice versa
3rd light: when lights 1 and 2 are in agreement
Hope you enjoy!

Multi-Timeframe Stoch RSIGood evening folks!
Today I want to share with you a simple variant of the Stochastic-RSI built-in indicator.
Nothing too complex: by enabling the relative checkbox and setting the desired (k, d or the RSI ) source and timeframes, you can see higher timeframes data plotted on your screen.
Everything you need to do is enabling the indicator on the lowest timeframe (in this case 15 minutes), then you will see in YELLOW the information retrieved from the next higher timeframe (in this case 30 minutes) and in RED the information retrieved from the highest timeframe (in this case 45 minutes).
IT'S IMPORTANT THAT YOU DISPLAY THE INDICATOR ON THE LOWEST TIMEFRAME!
You can play with the overbought and oversold heights in order to have the best configuration you want (in oversold conditions is suggested to buy while in overbought conditions is suggested to sell)
The higher timeframes data are retrieved avoiding repainting since the method used for taking them is the 10th method described in this PineCoders Article , so, if you want to enable alerts, you SHOULD ignore the disclaimer message related to it without any problem.
Good Trading!

Momentum Strategy (BTC/USDT; 30m) - STOCH RSI (with source code)Here's a strategy for low time frames (30min suggested) for BTC , based on momentum Analysis using Stochastic RSI
By default the strategy will use the 50% of the specified capital for each trade; if "Gamble Sizing" is enabled, it will add the specified amount of capital (25% by default, until reaching the 100% limit or lower) for the next trade after having detected a loss in the previous trade; if the next trade is successful, the size for the next trade comes back to 50%
• Trend Filter LONG: If the fast exponential moving average is UNDER the slow exponential moving average , it won't open LONG positions
• Trend Filter SHORT: If the fast exponential moving average is ABOVE the slow exponential moving average , it won't open SHORT positions
• Bars delay: the strategy will wait the specified amount of bars before closing the current position; the counter is triggered as soon as the closing trade condition is verified
BY MAKING USE OF THIS STRATEGY, YOU ACKNOWLEDGE AND AGREE THAT: (1) YOU ARE AWARE OF THE RISKS ASSOCIATED WITH TRANSACTIONS OF DIGITAL CURRENCIES AND THEIR DERIVATIVES; (2) YOU SHALL ASSUME ALL RISKS RELATED TO THE USE OF THIS STRATEGY AND TRANSACTIONS OF DIGITAL CURRENCIES AND THEIR DERIVATIVES; AND (3) I SHALL NOT BE LIABLE FOR ANY SUCH RISKS OR ADVERSE OUTCOMES.
SOURCE CODE BELOW

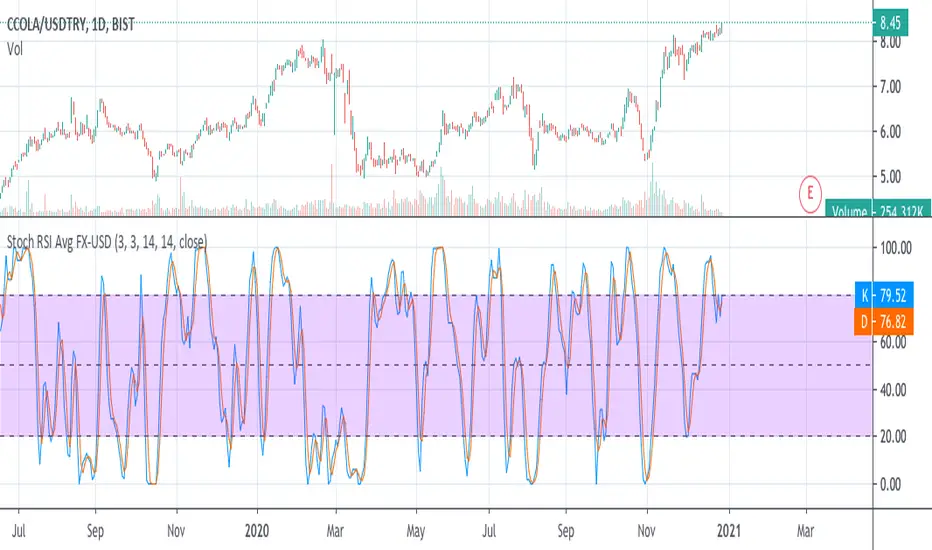
Stochastic RSI Average FX-USDThis script calculates average stochastic RSI of local currency and USD price of the stock.
(JS) Double StochasticThe idea for this indicator came from looking at the Stochastic RSI. The Stochastic RSI takes the RSI reading then applies the Stochastic formula to it - an indicator on top of an indicator. Using this logic, I decided to try using a Stochastic on the existing Stochastic in order to smooth it out - hence the "Double Stochastic". I have also added the option to add RSI on to the indicator as well (with smoothing if you'd like).
Resolution:
I added this so you can look at the reading on any time frame.
K & D:
This is the standard K% and D% used with the Stochastic indicator - the numbers modify the length of their calculations.
Smooth:
This is the smoothing calculation, also from the normal Stochastic indicator.
Use Second Stochastic:
This adds a second Stochastic on to the chart for analysis.
K & D 2:
This is the parameters used to calculate the second K% and D% lines.
Smooth 2:
This is the smoothing interval for the second K% and D% lines.
Use K% and D%:
The default for this is to have it on. What it means is that you wish to see both the K% and D% lines (watching for a cross). If you turn this off, the plot switches to a K% & D% difference line. It is just one line that plots the distance between the two.
SMA Length Using Difference:
If this is on, then you can smooth the difference plot with an SMA, obviously if you just want the raw difference to plot, then set this to 1.
Use RSI:
Since both RSI and Stochastic use a 0-100 scale, I added the ability to plot the RSI along with the Stochastic. This will not plot if you are using the Difference plot, being that plot isn't on a 0-100 scale.
Smooth RSI:
I also added the ability to smooth the RSI if you'd like, you can turn this off for the standard RSI reading.
RSI Length:
This is the period of bars used to calculate the RSI.
RSI Smoothing Length:
This is the smoothing interval if you'd like to apply a moving average on the regular RSI reading.
RSI Smoothing Use EMA:
This makes the RSI smoothing use an EMA, when off an SMA is used instead.
RSI Source:
And finally, this is the source used to calculate the RSI value.
I hope that you all may find this useful, I have been using it myself with a lot of success. Any questions, please leave them in the comments, thanks!

Crypto BOT lower timeframesThis is a crypto bot designed for lower time frames.
Its made of 2 EMA, one fast and one slower . They are combined together with Stochastic, MACD and price action patterns.
For entries we have multiple conditions :
First we check if one of our last 4 closed candles crossed above or below the faster EMA. After that for long, we check that last close is above the fast EMA, that the fast ema is above the slower EMA, at the same time that the histogram from MACD is positive and that we have crossover with the oversold line on stochastic. For the short , the opposite of long.
For exit we have TP/SL mechanic based on price % movement, in this example if the price moved 10% from the initial position it will exit.

Bjorgum RSIRSI output signals are displayed with color change to reflect the plotted value. This makes evaluating RSI conditions require but a glance.
RSI momentum buy signals are given on the cross of the 50 level, whereas sell signals are given on a fall below.
Default values a 5 period RSI which gives more timely entrances and exits for swing traders. This can be adjusted to the typical 14 period if the viewer desires slower signals.
Bullish and bearish area is shaded to accentuate the signal to the eye.
Excellent results can be found when coupling BJ RSI, with BJ TSI, and the reversal system using all 3 as a complete together simultaneously
Default color changes are plotted as a recorded value falls within the following levels:
RSI < 30 = green
RSI 30-50 = red
RSI 50-70 = blue
RSI 70-80 = yellow
RSI 80-90 = orange
RSI 90-100 = white hot

MACD Trend CandlesThe script combines 2 indicators (MACD and Stoch-RSI) and puts them visually directly on the candles - can be used with normal OHLC candles or Heiken Ashi candles. Furthermore, you can derive divergences exremely easy directly visually from the candles as well. Lastly, a SMA 20 high and a SMA 20 low line build a trend channel.
Script is best used in trending markets to trade with the trend.
1) SMA trend channel:
* uptrend: close above
* downtrend: close below
* aggressive entry (uptrend) closing inside channel from below
* conservative entry (uptrend) closing above channel from inside
* hold (uptrend) until close below channel
* can be used accordingly for the downtrend
2) MACD candles
* visualization of the MACD histogram directly on the candles
* dark blue: histogram > 0 and histogram > histogram of previous candle
* light blue: histogram > 0 and histogram < histogram of previous candle
* orange: histogram < 0 and histogram < histogram of previous candle
* light blue: histogram < 0 and histogram > histogram of previous candle
* hold uptrend (dark/light blue candles) - combined with trend channel (above channel)
* hold downtrend (orange /yellow candles) - combined with trend channel (below channel)
* Color divergence: light blue candle > dark blue candle (price and MACD show divergence (bearish)
* Color divergence: yellow candle < orange candle (price and MACD show divergence (bullish)
* Trend change (0 line cross to upside) yellow or orange to dark blue
* Trend change (0 line cross to downside) dark or light blue to orange
3) Stoch RSI diamonds
* visualization of the STOCH-RSI as diamonds above or below the candle
* k, d line > 80: diamond above the candle
* k, d line < 20: diamond below the candle
* divergence caldle without diamond above > candle with diamond above (bearish divergence)
* divergence caldle without diamond below < candle with diamond below (bullish divergence)
Feel free to test each part individually and combine it with other indicators, e.g. BBands and Ichimoku Cloud - you will see it is a powerful visualization script
HAVE FUN

Cyclic Smoothed RSI with Divergence IndicatorI created a single indicator that combines 1) Cyclic Smoothed RSI and 2) the Divergence indicator (bull, bear). It is very handy when used with the MACD and crossover points.
Please refer to for info on how to use the cRSI indicator.
Info on the chart.
1) Red dotted lines = cRSI crossed back from overbought and crossover in MACD
2) Red solid lines = Bear divergence and crossover in MACD
3) Green dotted lines = cRSI crossed back from oversold and crossover in MACD
4) Green solid lines = Bull divergence and crossover in MACD
5) Black transition = cRSI crossover but NO crossover in MACD

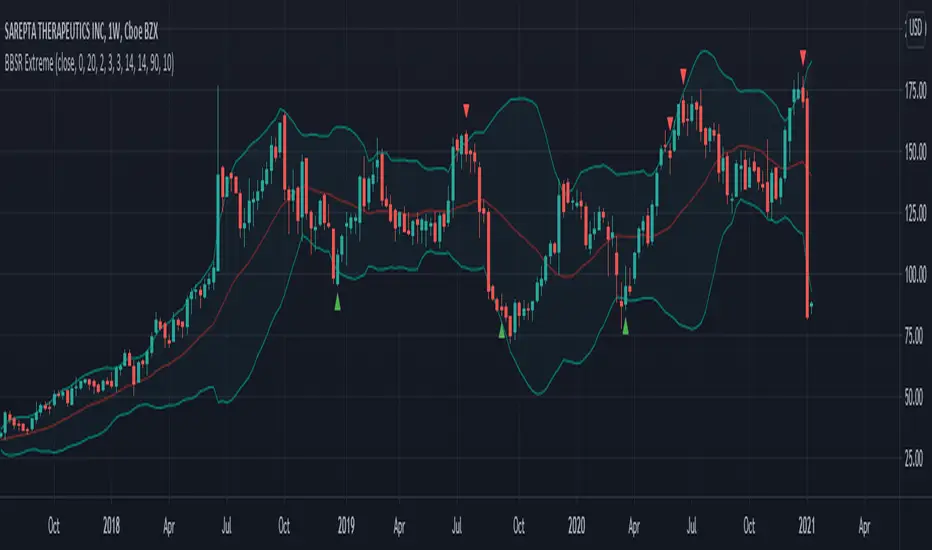
Bollinger Bands Stochastic RSI Extreme SignalThis is the finalized code released to the public that I created in a video linked here.
This indicators combines a Bollinger Band and Stochastic RSI to produce signals for possible price reversal. The signals are displayed by default as green arrows for bullish and red arrows for bearish.
To trigger a signal the indicator checks for the following:
(Bullish)
A candle closes above the upper Bollinger Band
The following candle closes within the upper Bollinger Band
The RSI Stochastic is below the set threshold (10 by default)
(Bearish)
A candle closes below the lower Bollinger Band
The following candle closes within the lower Bollinger Band
The RSI Stochastic is above the set threshold (90 by default)
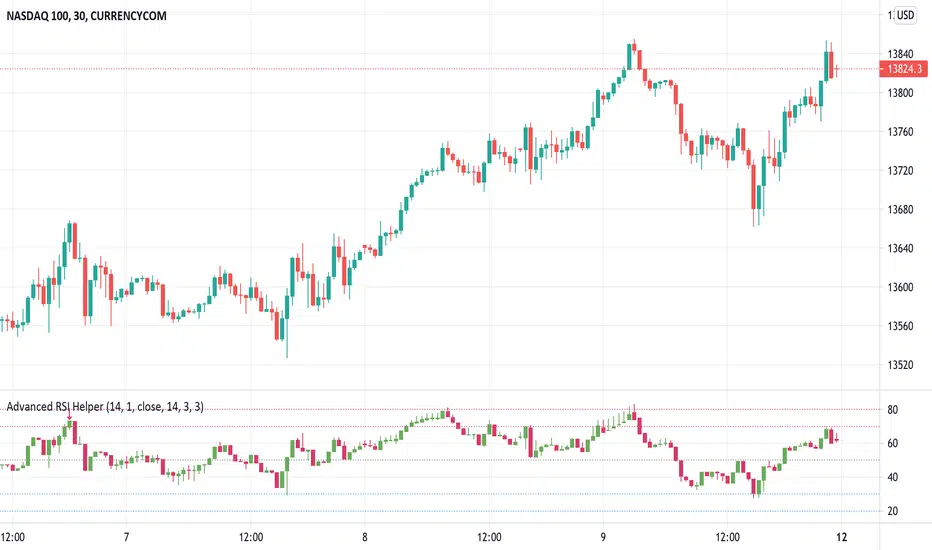
Advanced RSI HelperHere is Advanced RSI Helper. An advanced RSI represented in a candle type chart. It contains a Stochastic and a Pivot Detector (High-Low) and RSI divergences.
It also contains a Filter which you can configure the upper, lower zone to colorize the bars on the chart only when you are overbought or oversold, when you are in range the bars appear "transparent".
You also have the option of placing alerts for divergences or when the rsi exceeds the upper zone 1 / 2 or lower zone 1 / 2.
if you encounter any bugs do not hesitate to let me know in the comment area. The same goes for your suggestions.
Cheers and remember, risk management is the most important!
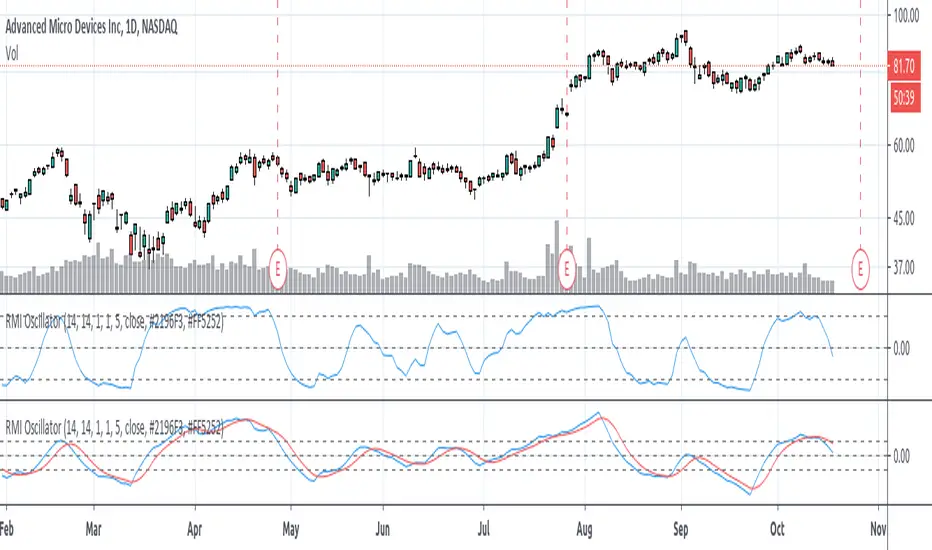
Relative Momentum Index (RMI) OscillatorThe Relative Momentum Index (RMI) is a sibling to the RSI. Where the RSI measures trend based on the average (RMA) of gains and draws over a length of time , the RMI measures based on the SUM of gains and draws . Myself and many others have found that the RMI oscillates better than the RSI does.
I paired the RMI with the oscillation method the Fisher Transformation uses to oscillate the value from -1.0 to 1.0 instead of the Stochastic way of 0 to 100. This way you can enable the Fisher transform, if desired. But I also just prefer the appearance of that.
Some options and features I have coded in-
RMI Length: This is the length of the Relative Momentum Index itself. Like the length of RSI, default 14
Oscillation Length: This is your oscillation length, like a Stochastic. If you put the length at 1 it will turn the indicator into the straight up RMI indicator. (If you select to use the Fisher Transform, the overbought/oversold lines will not show nicely)
Source Pre-Smoothing: The option of smoothing out the source, ie close, before you even run it through the RMI, oscillation, and/or transform
Oscillator Post-Smoothing: The option of smoothing the output of the script
Trailing MA: If desired, you can check the box to Use a Trailing Signal, and enter the length of lookback for a Simple Moving Average (SMA) of the RMI Osc value
Use Fill Colors on MA: If enabled, it will fill the area between the RMI Osc and the trailing MA. I chose to use colors that are similar to some educational ideas I have published, whereby nearing the bottom of the oscillation you get Green to signal Accumulation, and near the top you get Red to signal Distribution. Following red is Black, where you typically get late signal sellers that Capitulate and sell stops trigger. Blue is where traders tend to Chase price up.
The most primitive way of using this indicator would be sell when the value exceeds the overbought/top line and buy when it falls below the oversold/bottom line. You can find ways to use the fill colors, or MA crossovers, rising lows or rising highs, etc. for signals.
Here's a comparison of this indicator to the Stochastic RSI, using similar values-
Here's showing the indicator on intraday values at defaults with some pre- and post-smoothing-
Same thing, but with Fisher Transform enabled-
And an example of the fill bands in action-
Please feel free to use any part of this code as desired.
Stochastics and RSI HybridThis is an interesting study. We know bollinger bands can be a useful tool for price action, but what if we applied them to other indicators?
The top chart is the Stochastics and bottom chart represents RSI. We can see a relationship between the two indicators, where the signal line bounces of the bollinger bands.
The strategy is simple, when the signal lines bounce of their bollinger bands together, review price action and then take the trade. If you see one indicator going in the opposite direction to the other, or opposite to price action, then you may be observing divergence in which case a big move is about to happen.
If you wish to have this indicator further customised, please do not hesitate to contact me.

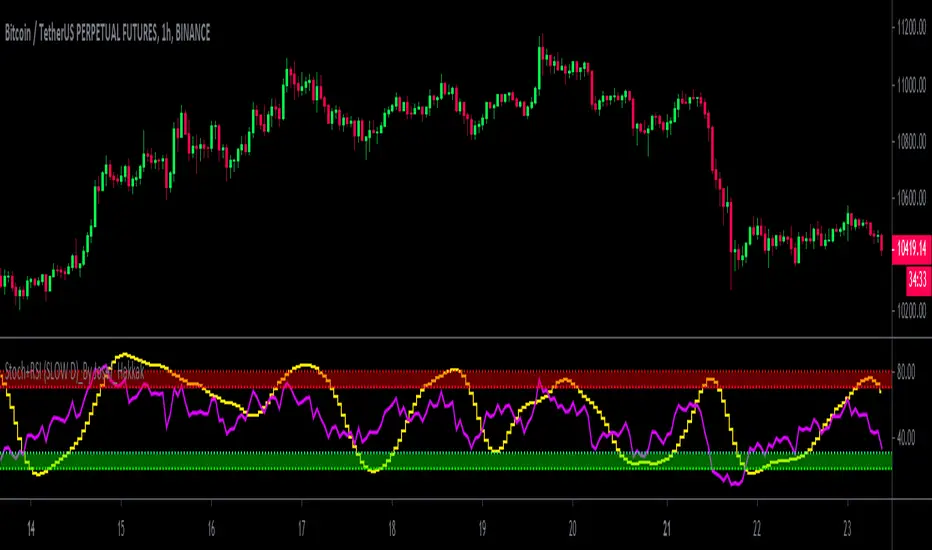
Stoch+RSI (SLOW D)_By Josef_HakkakStoch+RSI (SLOW D)_By Josef_Hakkak
Stochastic and RSI by SLOW D%
-> How to use:
B UY = When the yellow line (D of Slow Stoch ) goes out of the green range, it is better that the purple line ( RSI ) is be low
SELL = When the yellow line (D of Slow Stoch ) goes out of the red range, it is better to have the purple line ( RSI ) is be high
This script was previously written by RRanjanFX and has now been edited by me and changes have been made to optimize for shorter timeframes.
Edited and updated and optimized from:
RRanjanFX
Many thanks and loyal to RRanjanFX
MTF Stoch RSI ScreenerDisplays when multiple timeframes of Stochastic RSI are overbought/oversold. Multiple consecutive timeframes being overbought/oversold can signify a short term top or bottom.
Thanks to Micse in Pinescripters telegram who helped remove a few errors from this.

GnG - WaveTrend with RSIShow WaveTrend Line and Stochastic RSI line Indicator in one script
When Stochastic RSI Line cross will show signal.
Helping users to know the signal of reversal.
Disclaimer On and Take your Own Risk.

RSI2 with alerts by Mr.TuanDoan for Binary OptionIdea was developed from Larry Connors RSI2.
The 2-period RSI strategy is a fairly simple mean-reversion trading strategy designed to buy or sell securities after a corrective period.
You should look for buying opportunities when 2-period RSI moves below Lower Band (5), which is considered deeply oversold. Conversely, you can look for short-selling opportunities when 2-period RSI moves above Upper Band (95).
This is a rather aggressive short-term strategy for Binary Option.
Best use with Stoch RSI x 2.
The settings for Stoch RSI are
- Slow: 3 3 14 14
- Fast: 3 3 5 5
Only consider a PUT/CALL when both Stoch RSI are in the same state (overbought/oversold).
When arrow appears on the candle, it likely reverse the current trend.
Note
This is not a holy-grail.
Please follow your risk management
Confirmations must be met before entering a trade
It's for Binary Option

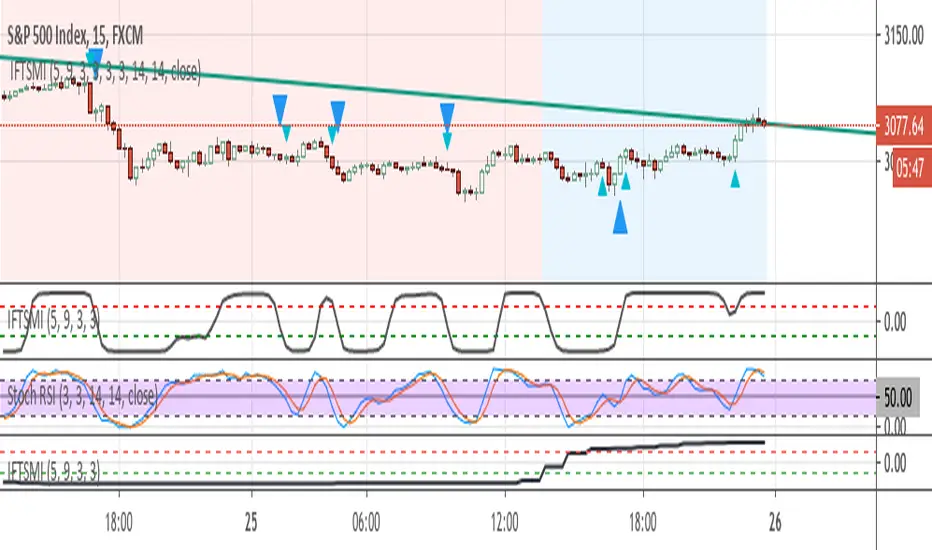
Inverse Fisher Transform of SMI and sto. RSI, MTF confirmedThe system uses 1 hour and 15 min timeframe data. Signals coming from 15 min Inverse Fisher Transform of SMI and stochastic RSI are confirmed by 1 hour Inverse Fisher Transform SMI, according to the following rules:
long cond.: 15 min IFTSMI crosses ABOVE -0.5 or SRSI k-line crosses ABOVE 50 while 1-hour IFTSMI is already ABOVE -0.5
short cond.:15 min IFTSMI crosses BELOW 0.5 or SRSI k-line crosses BELOW 50 while 1-hour IFTSMI is already BELOW 0.5
SMI and Inverse Fisher Transform of SMI codes belong to @kivancozbilgic.