Most Power V5 Most Power V5
The MOST indicator is an indicator used as a Moving Stoploss. The MOST indicator also generates a buy signal in case the prices rise, unlike the traditional indicators that allow you to make stop losses.In the MOST POWER V5 indicator, stoploss generates its signals using moving averages such as 'SMA', 'EMA', 'WMA', 'VWMA', 'HMA', 'SMMA', 'DEMA' rather than just the current price. In this way, it aims to prevent false signals that may be produced by excessive price movements during the day.
MOST POWER Indicator follows the average by preserving the stop loss distance in the movement of the moving average in the same direction.
The second variable that creates the MOST POWER curve is the stop loss distance that gives power to MOST with the moving average used and the shift rate that provides the stop signal. In this version, this distance is prepared with 2 separate inputs for both buy and sell.You can set these values as "percentage for long trend" and "percentage for short trend" in the indicator input properties.
You can also enter your Take Profit-1, Take Profit-2-, Take Profit-3- and Stop Loss levels in the indicator input properties, especially if you are interested in algo trading or to take advantage of the wonderful alarm setup features of tradingview and get the chance to get maximum profit. (If you enter Take Profit-1, Take Profit-2-, Take Profit-3- and Stop Loss levels as 0. Only buy and sell labels will appear on the indicator.)
Also, activate the amplitude filter option from the indicator input settings to get less signal and filter our inputs.
In addition, the entry price, take profit1, take profit2, take profit3 values for the last transaction opened to make things easier are located in the upper right corner of your graph as a table.
Important note: No indicator guarantees investment. That's why the tests you will do before real trades are very important in this indicator. I wish you all successful trades.
i will show how works with examples
Example 1
If you enter Take Profit-1, Take Profit-2-, Take Profit-3- and Stop Loss levels greater than 0
Example 2
If you enter Take Profit-1, Take Profit-2-, Take Profit-3- and Stop Loss levels as 0 (u will see only buy - sell labels)
Example 3
if select Amplitude Filter is on . you will see less signal
how works Amplitude Filter whats logic ?
if Amplitude Filter is active the signal from mostpower will be combined with Amplitude Filter.
for example, if the amplitude value is 2, the highest price and the lowest price of the last 2 bars are calculated. then this amplitude value is calculated for sma with its source high and low. Based on these values, the trend is determined in the amplitude of the price movement.
Important note: No indicator guarantees investment. That's why the tests you will do before real trades are very important in this indicator. I wish you all successful trades.
Stocks!

Investing ZonesInvesting Zones indicator shows the areas where LONGS or SHORTS can be made, the areas are calculated based on the mathematical averages of the high and low peaks of the price.
-There is an area called "No trading Zone" where the price is too slow, It also has a Alma Trend Ribbon (blue for uptrend, pink for downtrend) that helps to make trading decisions.
-You can make shorts when the price enters the Yellow zone called the "Sell Zone" and the price is below the Alma trend, set the TP1 in the white dotted line, and TP2 in the white lower line
-You can make longs when the price enters the Green zone called the "Buy Zone" and the price is above the Alma trend, set the TP1 in the yellow dotted line, and TP2 in the yellow upper line
-It works in all timeframes, personally I use it in 1min, 5min and 1hr.

Day Trading Booster by DGTTiming when day trading can be everything
In Stock markets typically more volatility (or price activity) occurs at market opening and closings
When it comes to Forex (foreign exchange market), the world’s most traded market, unlike other financial markets, there is no centralized marketplace, currencies trade over the counter in whatever market is open at that time, where time becomes of more importance and key to get better trading opportunities. There are four major forex trading sessions, which are Sydney , Tokyo , London and New York sessions
Forex market is traded 24 hours a day, 5 days a week across by banks, institutions and individual traders worldwide, but that doesn’t mean it’s always active the entire day. It may be very difficult time trying to make money when the market doesn’t move at all. The busiest times with highest trading volume occurs during the overlap of the London and New York trading sessions, because U.S. dollar (USD) and the Euro (EUR) are the two most popular currencies traded. Typically most of the trading activity for a specific currency pair will occur when the trading sessions of the individual currencies overlap. For example, Australian Dollar (AUD) and Japanese Yen (JPY) will experience a higher trading volume when both Sydney and Tokyo sessions are open
There is one influence that impacts Forex matkets and should not be forgotten : the release of the significant news and reports. When a major announcement is made regarding economic data, currency can lose or gain value within a matter of seconds
Cryptocurrency markets on the other hand remain open 24/7, even during public holidays
Until 2021, the Asian impact was so significant in Cryptocurrency markets but recent reasearch reports shows that those patterns have changed and the correlation with the U.S. trading hours is becoming a clear evolving trend.
Unlike any other market Crypto doesn’t rest on weekends, there’s a drop-off in participation and yet algorithmic trading bots and market makers (or liquidity providers) can create a high volume of activity. Never trust the weekend’ is a good thing to remind yourself
One more factor that needs to be taken into accout is Blockchain transaction fees, which are responsive to network congestion and can change dramatically from one hour to the next
In general, Cryptocurrency markets are highly volatile, which means that the price of a coin can change dramatically over a short time period in either direction
The Bottom Line
The more traders trading, the higher the trading volume, and the more active the market. The more active the market, the higher the liquidity (availability of counterparties at any given time to exit or enter a trade), hence the tighter the spreads (the difference between ask and bid price) and the less slippage (the difference between the expected fill price and the actual fill price) - in a nutshell, yield to many good trading opportunities and better order execution (a process of filling the requested buy or sell order)
The best time to trade is when the market is the most active and therefore has the largest trading volume, trading all day long will not only deplete a trader's reserves quickly, but it can burn out even the most persistent trader. Knowing when the markets are more active will give traders peace of mind, that opportunities are not slipping away when they take their eyes off the markets or need to get a few hours of sleep
What does the Day Trading Booster do?
Day Trading Booster is designed ;
- to assist in determining market peak times, the times where better trading opportunities may arise
- to assist in determining the probable trading opportunities
- to help traders create their own strategies. An example strategy of when to trade or not is presented below
For Forex markets specifically includes
- Opening channel of Asian session, Europien session or both
- Opening price, opening range (5m or 15m) and day (session) range of the major trading center sessions, including Frankfurt
- A tabular view of the major forex markets oppening/closing hours, with a countdown timer
- A graphical presentation of typically traded volume and various forext markets oppening/clossing events (not only the major markets but many other around the world)
For All type of markets Day Trading Booster plots
- Day (Session) Open, 5m, 15m or 1h Opening Range
- Day (Session) Referance Levels, based on Average True Range (ATR) or Previous Day (Session) Range (PH - PL)
- Week and Month Open
Day Trading Booster also includes some of the day trader's preffered indicaotrs, such as ;
- VWAP - A custom interpretaion of VWAP is presented here with Auto, Interactive and Manual anchoring options.
- Pivot High/Low detection - Another custom interpretation of Pivot Points High Low indicator.
- A Moving Average with option to choose among SMA, EMA, WMA and HMA
An example strategy - Channel Bearkout Strategy
When day trading a trader usually monitors/analyzes lower timeframe charts and from time to time may loose insight of what really happens on the market from higher time porspective. Do not to forget to look at the larger time frame (than the one chosen to trade with) which gives the bigger picture of market price movements and thus helps to clearly define the trend
Disclaimer : Trading success is all about following your trading strategy and the indicators should fit within your trading strategy, and not to be traded upon solely
The script is for informational and educational purposes only. Use of the script does not constitutes professional and/or financial advice. You alone the sole responsibility of evaluating the script output and risks associated with the use of the script. In exchange for using the script, you agree not to hold dgtrd TradingView user liable for any possible claim for damages arising from any decision you make based on use of the script

Price Average ZonesThis indicator shows the areas where LONGS or SHORTS can be made, the areas are calculated based on the mathematical averages of the high and low peaks of the price.
It also has a line that shows the average of the price movement. you can make shorts when the price enters the orange zone called the "Short Zone".
You can make longs when the price enters the orange zone called the sell zone.
It works in all timeframes, personally I use it in 1 min and in 1 hour.

Portfolio Tracker For Stocks & CryptoThis is a portfolio tracker that will track individual, overall and daily profit/loss for up to 12 assets. You can set the size of your buys and price of your buys for accurate, up to date profit and loss data right on your chart. It works on all markets and timeframes.
HOW TO USE
Go into the indicator settings and you will see all of the available settings. The first is the ability to turn the tracker info table on or off from the chart, so it saves your portfolio info but let’s you remove it from the chart while trading. Second is the option to move the position of the info table to suit your preference.
Next we get into setting up your portfolio tickers, order size and price. Each ticker lets you set which stock/crypto you bought, then set how much you purchased and then what price you purchased them at.
Go through and set up all of your assets and then turn off any tickers that you don’t need. Once that is all done, your portfolio will be shown on the chart with all the data.
FEATURES
Top Section
The portfolio tracker has 2 sections. The top section shows each ticker in your portfolio individually with the following data:
- Ticker Name
- Weight of that asset compared to your total portfolio in %
- Current value of that position in $
- Profit or loss value from purchase price in %
- Todays change in value from yesterday’s close in %
The $ Value, PnL % and Today % will all change colors from green to red depending if they are in profit or not.
Bottom Section
The bottom section of the tracker will give you info for your portfolio as a whole. It has the following data:
- Total cost of your entire portfolio in $
- Current value of your entire portfolio in $
- Current profit or loss of your entire portfolio in $
- Current profit or loss of your entire portfolio in %
- Todays change of your entire portfolio value compared to yesterday’s close in %
The $ Value, PnL $, PnL % and Today % will all change colors from green to red depending if they are in profit or not.

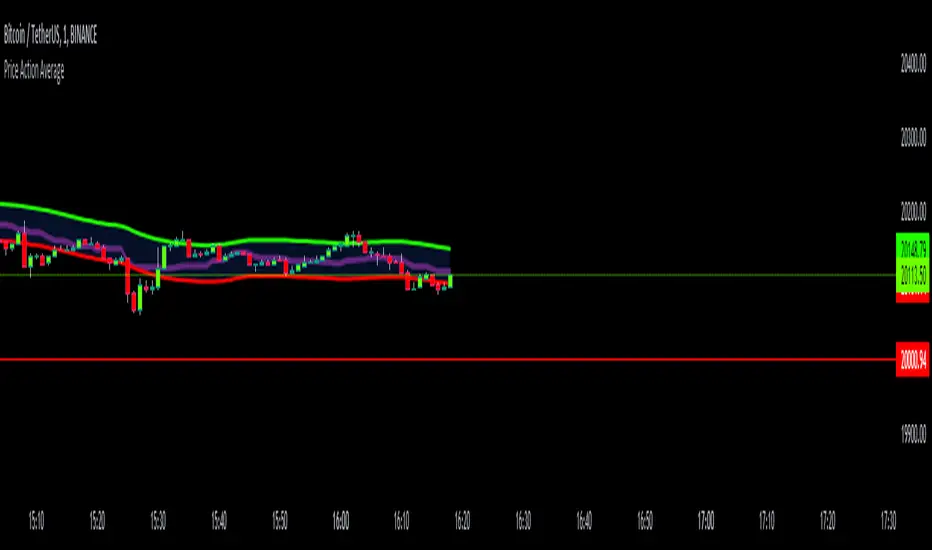
Price Action AverageThis indicator is perfect for scalping in 1 minute, it consists of a channel and a line that is made up of the average of the highs and lows of the price in 12 and 64 cycles.
The channel has as its center a 7 cycles SMA, when the average line (Called Signal, the purple one) crosses the upper band it is time to make a Long.
If it crosses the lower band it is time to make a short, if the line returns to the channel a signal appears to close the operation.
The indicator works with all timeframes, I use it on the 1 hour chart and I do the trades in 1 minute.
Power Of Stocks - Bollinger Band & 5Ema Indicator - Keanu_RiTz
Power of Stocks - Bollinger band & 5ema Strategy
In this script you get to take Buy/Sell trades using the 3 options mentioned below.(Alerts with price levels for buy/sell at , SL & Target are included in this one)
1. Combined Strategy :- uses confirmation from both strategies to trade.
2. Bollinger band Strategy :- use the Bollinger band Strategy to trade.
3. 5ema Strategy :- use the 5ema Strategy to trade.
1. Combined Strategy :-
for Selling :- we will go short/sell only when conditions of both strategies are satisfied.
i.e. when a candle is completely above the upper Bollinger band & completely above the 5ema then it will be our Alert Candle.
We Short/Sell only when the low of the Alert candle is broken or when the candle closes below the close of the Alert Candle.
SL will be above high of the Alert Candle. Target will be minimum 1:3 or as per your emotions.
for Buying:- we will go Long/Buy only when conditions of both strategies are satisfied.
i.e. when a candle is completely below the lower Bollinger band & completely below the 5ema then it will be our Alert Candle.
We go Long/Buy only when the high of the Alert candle is broken or when the candle closes above the close of the Alert Candle.
SL will be below low of the Alert Candle. Target will be minimum 1:3 or as per your emotions.
2. Power of Stocks - Bollinger Band Strategy :-
Bollinger band with standard deviation = 1.5
when a candle is completely above the upper Bollinger band, that candle will be called a signal/alert candle.
Initiate a Sell trade when that alert candles low is broken. SL will be above high of that alert candle.
Risk to reward ratio will be 1:4 i.e. target will be 4 times the SL.
when a candle is completely below the lower Bollinger band, that candle will be called a signal/alert candle.
Initiate a Buy trade when that alert candles high is broken. SL will be below low of that alert candle.
Risk to reward ratio will be 1:4 i.e. target will be 4 times the SL.
other rules for Options buying:- minimum 15min timeframe
The day you initiate the position , you should be in profit above 10%-15% then only you should carry forward that position overnight, otherwise squareoff your trade on that day only.
Buy ATM or slightly OTM, SL max 100 points , target 1:4
for Long-term/Investing :- Minimum Weekly
If candle is outside the lower band then initiate a Buy trade when that candles High is broken. Sl will be below Low of that candle.
for Long-term Target will be according to your emotions.
3. Power of Stocks - 5ema Strategy (target minimum 1:3)
Timeframe -
5 min for Selling (Sell Futures/index/stocks or buy Put)
15 min for Buying (Buy Futures/index/stocks or sell Put)
for selling stocks :-
you should enter trade within 10am , don't look for entries after that time. take only 2 entries a day.
for selling Index(Banknifty) :-
you can take trade at anytime of the day whenever conditions get satisfied. you can take multiple entries in banknifty as it is very volatile.
for options choose atm strikes: selling trade
sl for premium between 200-300 :- 20-30 points SL
sl for premium between 400-500 :- 40-50 points SL
sl for premium between 500-600 :- 50-60 points SL
Subhashish Pani's (power of stocks) 5 EMA Strategy:-
It plots 5 EMA and Buy/Sell signals with Target & Stoploss levels.
What is Subhashish Pani's (power of stocks) 5 EMA Strategy :-
His strategy is very simple to understand. for intraday use 5 minutes timeframe for selling. You can sell futures, sell call or buy Puts in selling strategy.
What this strategy tries to do is , it tries to catch the tops, so when you sell at top & it turns out to be a reversal point then you can get good profit.
this will hit stop losses often, but stop losses are small and minimum target should be 1:3. but if you stay with the trend you can get big profits.
According to Subhashish Pani this strategy has 60% success rate.
Strategy for Selling (Short future/Call/stock or buy Put)
When ever a Candle closes completely above 5 ema (no part of candle should be touching the 5ema), then that candle should be considered as Alert Candle.
If the next candle is also completely above 5 ema and it has not broken the low of previous alert candle, Then the previous Alert Candle should be ignored and the new candle should be considered as new Alert Candle.
so if this goes on then continue shifting the Alert Candle, but whenever the next candle breaks the low of the Alert Candle we should take the Short trade (Short future/Call/stock or buy Put).
Stoploss will be above high of the Alert Candle and minimum target will be 1:3.
Strategy for Buying (Buy future/Call/stock or sell Put)
When ever a Candle closes completely below 5 ema (no part of candle should be touching the 5ema), then that candle should be considered as Alert Candle.
If the next candle is also completely below 5 ema and it has not broken the high of previous alert candle, Then the previous Alert Candle should be ignored and the new candle should be considered as new Alert Candle.
so if this goes on then continue shifting the Alert Candle, but whenever the next candle breaks the high of the Alert Candle we should take the Long trade (Buy future/Call/stock or sell Put).
Stoploss will be below low of the Alert Candle and minimum target will be 1:3.
Buy/Sell with extra conditions :
it just adds 1 more condition to buying/selling
1. checks if closing of current candle is lower than alert candles closing for Selling & checks if closing of current candle is higher than alert candles closing for Buyling.
This can sometimes save you from false moves but by using this, you can also miss out on big moves as you'll enter trade after candle closing instead of entering at break of high/low.
Note :- According to Subhashish Pani Timeframe for intraday buying should be 15 minutes Timeframe.
If you haven't understood the strategy by reading above description, then search for "Subhashish Pani's (power of stocks) 5 EMA Strategy" on YouTube to get a deeper understanding.
Note:- This is not only for Intraday trading , you can use this strategy for Positional/Swing trading as well. If you use this on Monthly Timeframe then it can be very good for Long Term Investing as well.
Rules will be same for all types of trades & Timeframes.

Cosmic GravityCosmic Gravity draws dynamic non-repainting trendlines and helps
⭐ know when to scalp
⭐ predict the position and timing of the next major reversal
⭐ predict sudden changes in volatility
⭐ recognize if the trend is bearish or bullish
👀 HOW IT WORKS
Cosmic Gravity draws a dynamic channel consisting of a basis line and several support and resistance levels for low/medium/high volatility situations, as defined by the Inner Channel and 2 Outer Channel plots respectively. The script achieves this by reducing a large number of select moving averages, their multiples, and other trend levels into a single basis line and deriving the remaining plots off of it using ATR and probability-constant multiples. The basis line color is determined by its smoothed vector similar to how our Cosmic Vector indicator paints its plot. The aim of this indicator is to provide a consistent and generic price context that works out-of-the-box; accordingly a single static average period is used throughout and the settings have been stripped to the bare minimum with no need to ever update them.
📗 HOW TO USE IT
Cosmic Gravity's channel levels are meant to be used as a guide for entering and exiting positions and setting stop-loss and take profit levels. The indicator is deemed effective for any particular timeframe as long as the price stays within the maximum bounds of the indicator's plots. For this reason it is recommended to use Cosmic Gravity in a multi-chart layout where each chart has a different timeframe. The 5 primary strategies are:
long when the price reverses off of an Outer Channel support level and short when the price reverses off of an Outer Channel resistance level
long when the price crosses above the basis line after being below it for a prolonged period and vice-versa (short when the price trend moves below the basis line)
long when the basis line color turns blue after being pink for a prolonged period and visa-versa (short when the basis line color turns pink)
long/short in the direction the price takes when it goes outside the Magnetic Gravity channel when this channel is in a tight squeeze
scalp as the price bounces between the Inner Channel levels (do this only while the price is contained inside the Inner Channel )
🔔 SMART ALERTS
Get notified at the most critical times with a single alert. Simply select Cosmic Gravity - Any alert() function call as the condition when creating an alert and you will be tipped-off on bar-close as follows:
RR↘ (price close crossed below Outer Channel R6 plot)
RR↗ (price high crossed above Outer Channel R6 plot)
R└ (price low entered R channel from above)
R┘ (price high exited R channel from above)
R┐ (price high exited R channel from below)
R┌ (price high entered R channel from below)
B↘ (price high crossed below Basis plot)
B↗ (price low crossed above Basis plot)
B╮ ( Basis vector turned negative)
B╯ ( Basis vector turned positive)
S└ (price low entered S channel from above)
S┘ (price low exited S channel from above)
S┐ (price low exited S channel from below)
S┌ (price high entered S channel from below)
SS↘ (price low crossed below Outer Channel S6 plot)
SS↗ (price close crossed above Outer Channel S6 plot)
For example, an alert such as Cosmic Gravity 6H R┐ B↘ means that during the last 6-hour bar the price exited the R channel from below and also crossed below the basis line.
🚩 DISCLAIMER
The information we create and publish here is not prohibited, doesn't constitute investment advice, and isn't created solely for qualified investors.

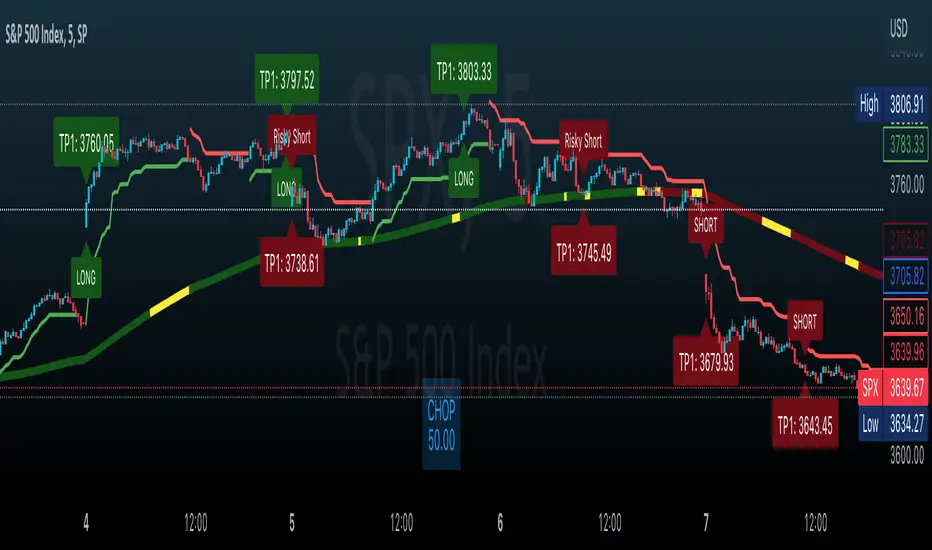
Effortless ScalpingEffortless Scalping is an indicator that primarily is used for stock options trading.
Effortless Scalping is based off of momentum. Our script takes into account the price action, volume, and historical data points of a stock to give potential "buy" and "sell" areas.
Effortless Scalping is a protected script because its Buy and Sell signals are based off of custom coded confirmations. This is what makes our script unique. We also have custom coded CHOP Filters in the indicator.
Effortless Scalping has a custom EMA line that flows with the trend of the market. It also changes colors to indicate a bullish or bearish trend . It also will change into a yellow color if the CHOP of the market exceeds your allowance. This EMA line is the only "classic" element of our custom coded script.
You can easily use Effortless Scalping by applying it straight to your chart. You can customize several visual effects in the settings menu.
Effortless Scalping also has two types of signals--RISKY signals and normal signals. Risky signals have a higher risk, but also a higher reward.
Effortless Scalping also features take profit levels based off of ATR levels.
Effortless Scalping also has custom support and resistance lines to better help you analyze the movement of a stock. These levels are based off of pivot levels.
Effortless Scalping can not predict the future move of a stock. Our script uses historical data points to alert POTENTIAL entries. These historical data points by NO MEANS predict the future movement of the market.
Effortless Scalping was created to help me understand the movement of a stock and why it may be moving in that direction. I personally found success using this script. I am sharing it because I am hoping that others find success in this script as well. I also like to trade quite frequently, and several times a day, so I made an indicator that is both accurate and alerts frequently.
This indicator does NOT provide financial advice. It is intended for general use only.
Money Supply Index (MSI) by zdmreThe primary objective of the states monetary policy is to maintain price stability with sustainable maximum economic growth. In anticipation of higher inflation , the Central Banks raise short-term interest rate thereby to reduce money supply. Conversely, the Central Banks reduce short-term interest rate to inject additional money into the economy in apprehension of unleashing recessionary forces. The stock markets usually respond negatively to interest rate increases and positively to interest rate decreases. The linkages between money market and stock market a wealth effect due to a change in money supply disturbs the equilibrium in the portfolio of investors.
This index indicates the long-run and short-run dynamic effects of broad money supply (M2) on U.S. stock market (this symbol is optional (Bitcoin, Gold or Oil or other markets etc.)).
#DYOR

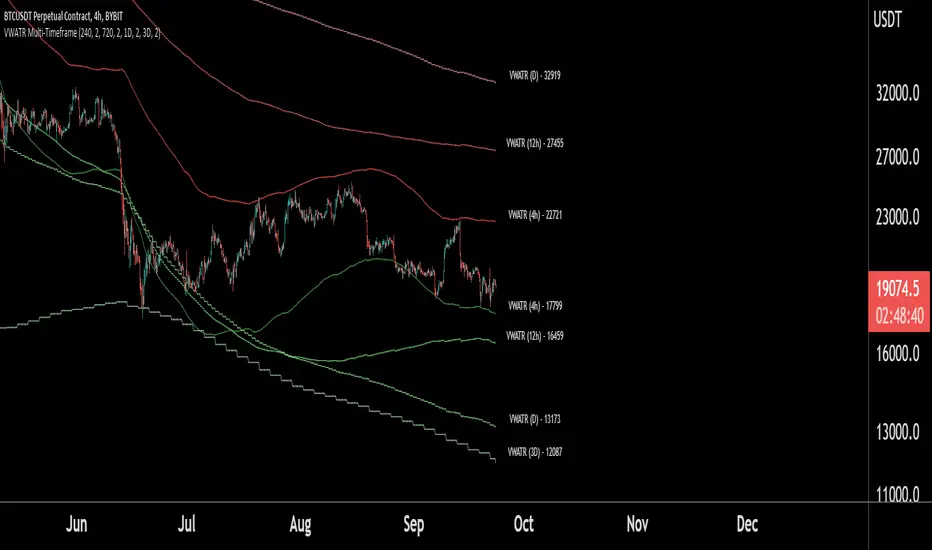
VWATR Multi-Timeframe RibbonThis script combines and averages Volume-Weighted Moving Averages in a specific way to make a unique ATR band that expands and retracts based on the volume in the current market.
This indicator allows for viewing up to 4 VWATR Bands on all the major trading timeframes.
This creates support and resistance levels that are fluid enough for traders to use these 4 methods:
- Identify a range to trade between in sideways markets.
- Identify when we are beginning a move(breaking out of the bands and using them as support to trade from).
- During a trend, traders can use higher timeframe VWATR Bands to identify take profits or potential rejection points.
- Identify when a trend may be over(losing the band as support after a breakout).
NOTE: This script will work fine on identifying crypto assets and stocks, but markets with different volume parameters will negatively affect the accuracy of this script.
Moving Average Directional IndexMADX is ADX-inspired indicator with moving averages that determines strength of a trend, as well as its direction. Indicator works following:
As the value of MADX increases, so does the strength of a trend
If MADX+ ( green line - bullish MADX ) crosses above MADX- ( red line - bearish MADX ) we consider trend as bullish and vice versa..
There will be situations where MADX- and MADX+ cross multiple times in a short period of time -> that will mean that market indecision is happening and big move will most likely happen after it.
For the calculation of MADX+ and MADX- we need Moving Averages or Exponential Moving Averages with three specific sources ( high, close, low ).
Now, the calculation of each MADX will differ
=> for MADX+: Moving Average (high) / Moving Average (close)
=> for MADX-: Moving Average (close) / Moving Average (low)
Length of Moving Average is editable.

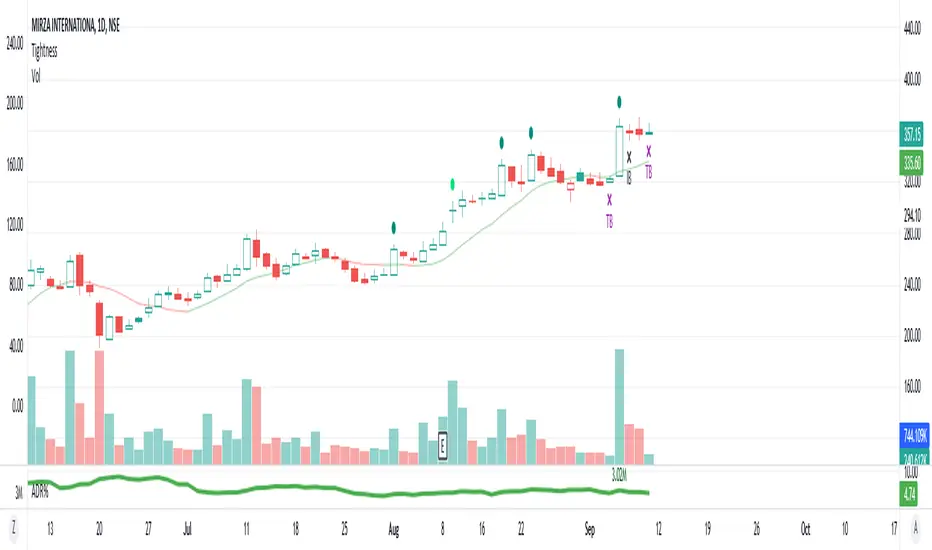
AS - Tightness4% up - stocks up 4% and close is in top 75% of days range
4.5% up - stocks up 4.5% and close is not in top 75% of days range
4% down - stocks down 4%
TB D - Inside Bar with days range of less than 2.5%
IB D - Inside Bar Daily
Rev D - lowest in 5 days and close in top 60% of days range
TB W - Inside Bar with weekly range of less than 6%
IB W - Inside Bar Weekly
3WTC - 3 Week Tight Close
showlast - no. of bars you want to see 4% up move and 4% down move
showlastib - no. of bars you want to see IB in Daily and Weekly
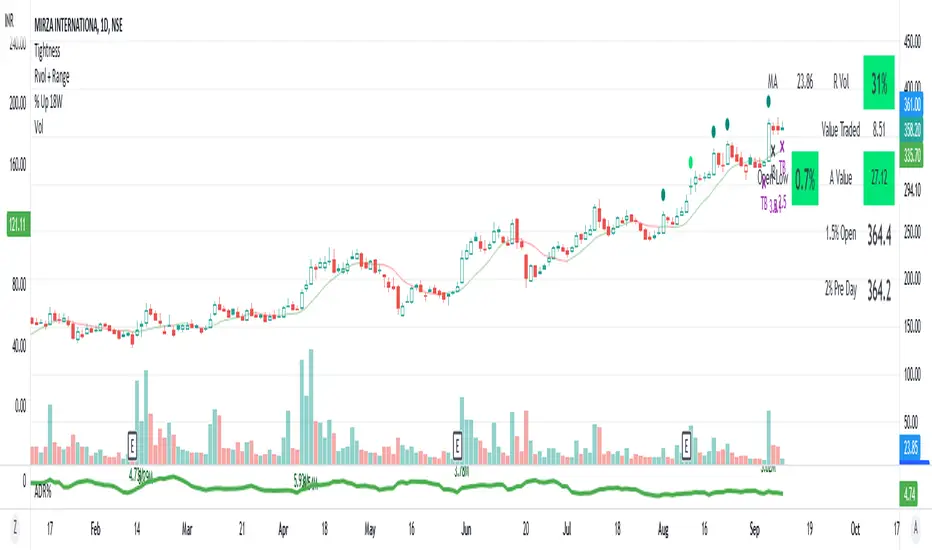
AS - Tightness4% up - stocks up 4% and close is in top 75% of days range
4.5% up - stocks up 4.5% and close is not in top 75% of days range
4% down - stocks down 4%
TB D - Inside Bar with days range of less than 2.5%
IB D - Inside Bar Daily
Rev D - lowest in 5 days and close in top 60% of days range
TB W - Inside Bar with days range of less than 6%
IB W - Inside Bar Weekly
3WTC - 3 Week Tight Close
Auto Fibonacci Levels + Auto Trend Line generatorAnother indicator for you guys!!!
This indicator consists of the 5 key Fibonacci retracement levels, plotted automatically to user input settings. I also have included an auto support/resistance trend line generator.
What is a Fibonacci retracement?
'Fibonacci retracement is a method of technical analysis for determining support and resistance levels. It is named after the Fibonacci sequence of numbers, whose ratios provide price levels to which markets tend to retrace a portion of a move before a trend continues in the original direction.' - Wikipedia
How to use the Fibonacci retracement?
- The Fibonacci levels are default. These percentiles from price to the average of the high in a sample and low in a sample give you a guideline of where a bottom may be, where a top may be, and where a range is being created.
- Look for the price to reject from 61.8% and 76.4%, and also look for price to bounce from 38.2% and 23.6%. If a lower low/higher high is made, the fib levels will follow and the percentiles within will be recalculated after a 5 candle offset period.
- If you see price trending towards the lower percentiles (38&23) and using the 50% as resistance, look for a break downwards and vice versa.
-This Fibonacci set as all others is subject to fake-out, always use this with another series indicator, or don't use it as a signal for entry at all (unless you have a backdated strategy)
How to use the trend line generator?
-The trend line generator will only plot when a lower low/higher high has taken place within the input amount of candles. It is also offset by a user amount.
-The check box will give the option to have the trend line's plot or not.
- If you see a green/red dot it means that that will be your first coordinate for the trend line, and until the computations are complete it will give you an idea of which direction it will be in (resistance or support)
-When opening this indicator zoom out all the way to connect any trend lines that do not load automatically.
Let me know if you have any questions, suggestions or issues! Thank you everyone!
-Cheatcode1 :)
SP:SPX TVC:DXY BMFBOVESPA:EUR1! CME:BTC1! BINANCE:BTCUSDT

Improved Lowry Up-Down Volume + Stocks Indicatordocs.cmtassociation.org
In Paul F. Desmond's award winning paper in 2002 entitled "Identifying Bear Market Bottoms and New Bull Markets", he proposed an indicator for panic buying and selling that can be used to determine major market bottoms.
The paper explains that in major bear markets, you should have at least one, or more than one multiple 90% down days. Recoveries out of bear markets, or beginnings of new bull markets, should have at least one of the following conditions:
1) At least one 90% up volume day
2) At least two back-to-back 80% up volume days
Up and Down volume are defined as:
1) 90% up volume - defined as 90% up volume / total volume (or 10% down volume / total volume)
2) 90% down volume - defined as 90% down volume / total volume (or 10% up volume / total volume)
Several scripts exist in Tradingview to show this indicator for Up and Down volume, along with arrows or indicators for green up days or red down days.
However, this script is an improved version as it allows you the option to customize a couple parameters:
1) You may chose whether you'd like to use volume or stocks - sometimes it's better to have confluence between volume and actual stocks at the 90% threshold
2) You may chose the exchanges to consider - in the paper the NYSE is discussed, but this allows the expansion into NYSE, NASDAQ, DOW, and even a combined NYSE + NASDAQ + DOW indicator
3) It uniquely codes in the ability to plot a buy signal for both 90% up days, but also two back-to-back 80% up days - which is in the spirit of the original paper
I hope you enjoy this script and please let me know if you'd like me to make any modifications or additions.
Thank you, sincerely,
Jim Bosse

Munich's Momentum Wave V2MUNICH'S MOMENTUM WAVE VERSION 2 IS LIVE!!!
There are a few big things to note with this one.
I decided to upload this as an entirely new script due to the number of changes differing from the first version, but as the last one, this will still work on ANY TIMEFRAME, ANY ASSET CLASS, ANY PRICE! .
This momentum wave indicator now will give you data for when trend could turn, and two momentum indicators to help you decide when to take an entry.
First off,
*I have added an alma ma (alma) that will track momentum alongside price action and further lead the indicator consisting of the Munich waves.
* The background feature will track the price using a method derived from the Bollinger bands, after calculations, it will color the background based on the average of the momentum's ema's, the alma ma, and also the alma in comparison to the alma's value pre offset ( the offset is 3, following the basis).
*There are now 5 basis values given from the increase in ema samples.
If anyone has any questions feel free to pm me or comment below. Thank you guys for the support! :)
INDEX:BTCUSD TVC:NDQ AMEX:SPY BITSTAMP:ETHUSD BINANCE:BTCUSDT FX:USDJPY NASDAQ:AAPL

München's Momentum WaveMUNICH'S MOMENTUM WAVE:
This momentum tracker has features sampled from Madrid's moving average ribbon but has differentiated many values, parameters, and usage of integers. It is derived using momentum and then creates moving averages and mean lengths to help support the strength of a move in price action, and also has the key mean length that helps determine HL/LH or rejections into trend continuation. This indicator works on ALL TIME FRAMES, ALL ASSET CLASSES ON ALL SETTINGS!!
HOW DO I USE IT?
*First off, I have arranged the input settings into groups based on the parts of the indicator it affects.
*You want to use the aqua/white/yellow (Munich's line) as your leading indicator, this is a combined average of the MoM indicator.
* When using Munich's line you want to look at the relation to the mean line (the flat line that adjusts based on price action. You will often see rejections of this line into trend continuation. I personally have caught perfect LH/HL bounce trades off of this indicator.
* Use the Background and other colored moving averages to help pre-determine moves based on the -3 offset value of Munich's line. This was by design not to create 'accurate' results, but to help predict momentum swings based on sharper moves in price action better than if all values lined up to the current bar.
Cheat Code's Notes:
I hope you guys find this indicator to be useful, this is most likely the best indicator that I have written. Simply for the fact it is useful on any chart, any timeframe with any setting. If you guys have any issues with it, shoot me a pm or drop a comment. Thanks!
-CheatCode1
BINANCE:BTCUSDT BITSTAMP:ETHUSD BITSTAMP:BTCUSD PEPPERSTONE:JPYX TVC:DXY TVC:NDQ AMEX:SPY

Inside Bar SetupScript Details
- This script plots Inside Bar for given day in selected time-frame (applicable only for Timeframes < Day)
- Basis plotted inside bar, relevant targets are marked on the chart
- Targets can be customised from script settings. Example, if range of mother candle is 10 points, then T1 is 10 * x above/below mother candle and T2 is 10 * y above/below mother candle. This x & y are configured via script settings
How to use this script ?
- This script works well on 10-15 mins timeframe for stocks, 15/30 mins timeframe for nifty index and 30/60 mins time frame for bank nifty index
- If mother candle high is broken, take long trade with SL of mother candle low and if low is broken, take short trade with SL of mother candle high
Remember:
1. Above logic is to be combined with support/resistances i.e. price action. This script is an add-on to price action analysis giving you more conviction.
2. If range of mother candle is very high, it is recommended to avoid the trade.
3. Basis inside bar formed on higher time frame, take trade on basis of lower time frame i.e if inside bar is formed on 60 mins, take trade on the basis of 10-15 mins time frame
Example:
1. As seen in the chart, Nifty is near it's resistance and we are seeing Inside Bar being formed, In such scenario, even if High of Mother Candle is broken, we should be more interested to short as we are near resistance and probability of getting our targets in long side is less.
2. So, if I see breakdown of mother candle i.e. price going below low of mother candle, we will short with SL of high of mother candle.
3. As seen in the chart, both the targets are achieved.
Additional Info:
1. Targets on Long/Short Side can be configured via settings. For indices 1 times/1.5 times the range works well.
2. This script plots targets basis the first inside bar formed in the day for selected time frame.
3. Inside bars formed through out the day are coloured separately but lines are plotted only on the basis of 1st formed inside bar as this strategy works well for the first formed inside bar)
4. Don't forget to check volume in case of breakout/breakdown.
Note:
1. Mother Candle - First Candle of Inside Bar
2. Child Candle - Candle formed inside Mother Candle (Second Candle of Inside Bar)
Happy Trading :)

[KRONOS] Gamma StrengthDescription
This indicator's main component is the signal line which represents a very responsive market strength value calculated from real time data and normalized into a range (0 - 0.5 - 1). Indicator is using Stochastic and RSI functions to get raw value filtered through a linear regression, helping users predict imminent market directions. Lastly, this value oscillation is converted into a range to notice overbought and oversold zones at a quick glance.
It includes
Divergence. Indicator plots R for regular divergence and H for hidden with minimal possible delay which can be used to notice irregularity in the market.
Extreme overbought and oversold areas. Colored background extreme areas are showing points where a reversal is approaching.
How to use?
Buy/Long when the indicator line goes out of the blue/oversold area.
Sell/Short when the indicator line goes out of the red/overbought area.
extra tip: you can use the zero line and overbought/oversold zones as either a take profit or an entry area.

Investing - Order HelperFYI: This idea is not new and I believe there is plenty of other indicator similar to this. I have used 'Scaled.orders' from @highewaterr and add in additional calculation.
This is for education purposes only, if you decide to use it LIVE and you lose money using it, it is not my fault. Do not risk what you can't afford to lose.
Order Helper was improved to better help simplify my investing journey.
It calculates each size and price automatically for me after inputting into the settings.
Unlike the common investing method (DCA Daily/Weekly/Monthly or Support & Resistance).
There is issue for these investing method.
DCA based on time is prompt to buying at higher price which will bring your average cost and your risk higher .
So why risk more when you have plenty of time to wait for the project/stocks to be at a discount?
Support & Resistance based can be a hustle to some investor like me.
Why?
1. Complication when drawing multiple support & resistance line / zone.
2. Time Consuming (Refer to point 1)
To reduce/eliminate the issue prompt by these 2 investing method, I use order helper.
It free up that few minutes of each chart, reduce the complexity in drawing support & resistance.
However, it bring method is prompt to 'missing out'.
IF I were to stick to the prices and size based on this indicator, my order might not be triggered and price just continue going.
But personally, I am fine with it. As I would rather miss out than putting my hard earned money in a higher risk.
---------------------------------------------------------------------------------------------------------------------------------
Main Component of this indicator
Scaling options is the main component of this indicator.
There is 4 options to this component:
Linear
Ease-in -> The amount of orders/size CLOSEST to the START price, will be higher.
Ease-out -> The amount of orders/size FURTHEREST to the START price, will be higher.
Ease-in-out -> It's a mixture of Ease-in and Ease-out.
How to use this indicator?
It is best for you to play around with the settings, as it will be easier to understand rather than reading how I do it.
There is no right or wrong method in using this indicator. But this is how I use it.
Go to a higher time frame (Weekly/Monthly)
Identify major support & resistance
Open up 'Order Helper' settings
Input your preferred options (Linear/Ease-in/Ease-out/Ease-in-out)
Input the start price -> referring to the first major support & resistance line (closes to the current price)
Input the end price -> referring to the last major support & resistance line (furtherest away from the current price)
Input the number of orders you preferred
Position Size that you wish to purchase
I decide not to share the source code of this as I do not fully understand the math calculation behind.
But if it works, and it helps me. Then those math calculation doesn't really matter.
Hopefully this will help simplify your investing journey.
If there is any question, feel free to comment it below and I will try my best to assist.

Investing - Correlation Table This correlation tables idea is nothing new, many sites provides it.
However, I couldn't find any simple correlation indicator on TradingView despite how simple this indicator is.
This indicator works as its called. Calculating the correlation between 2 projects (can be used in stocks as well) using the 'ta.correlation' feature built into pinescript.
When it comes to investing, we do not want our stocks / crypto project to be heavily correlated to each other.
If they are heavily correlated to each other, then there isn't much point in diversifying.
That being said, it can be useful for traders who trade multiple pairs.
-----------------------------------------------------------------------------------------------------------------------------------------------------------
In this indicator, consist of 5 primary input and 15 secondary input (Symbol List).
Correlation Source:
This input options allow you to change how the correlation is calculated. By default, it uses 'close'.
Correlation Percentage(%):
This input options allows you configure how many (%) of correlation is considered as 'decoupled'.
This correlation will only move between -100% ~ 100%.
100% refers to it moving together.
-100% refers to it moving the opposite direction.
For example, Project A rises in Price, what is the possibility of Project B following:
A 100% correlation between Project A and Project B, refers to Project B will follow Project A movement.
A 50% correlation between Project A and Project B, refers to there is only 50% chance for Project B to follow Project A movement.
A -20% correlation between Project A and Project B, refers to there is a 20% chance of Project B moving the opposite direction of Project A
(Refers to the table on chart above to better understand what the numbers means. DOT/USD has a 100% correlation to DOT/USD. However. MXCUSDT has a -37.2% correlation to DOT/USD.)
Amounts Bars To Check:
This input options will check the amount of bars since the last bar in the chart.
If you want to know the correlation of the past 100 days in a daily chart, you will enter '100' into this options and it will check only the past 100 days.
Symbol List
This will allow you to input all the project symbol ticker ID to add into the correlation table.
-----------------------------------------------------------------------------------------------------------------------------------------------------------
Originally, I wish to use for loop to go through the symbol list to reduce the amount of code required. However, due to limitation of 'request.security' feature, I had to abandon that idea and use hard-coded for requesting security and use a while loop to identify the symbol correlation value in the array set then set the table value accordingly.
If there is any script writer could improve this or any unclear explanation, feel free to drop a comment below.

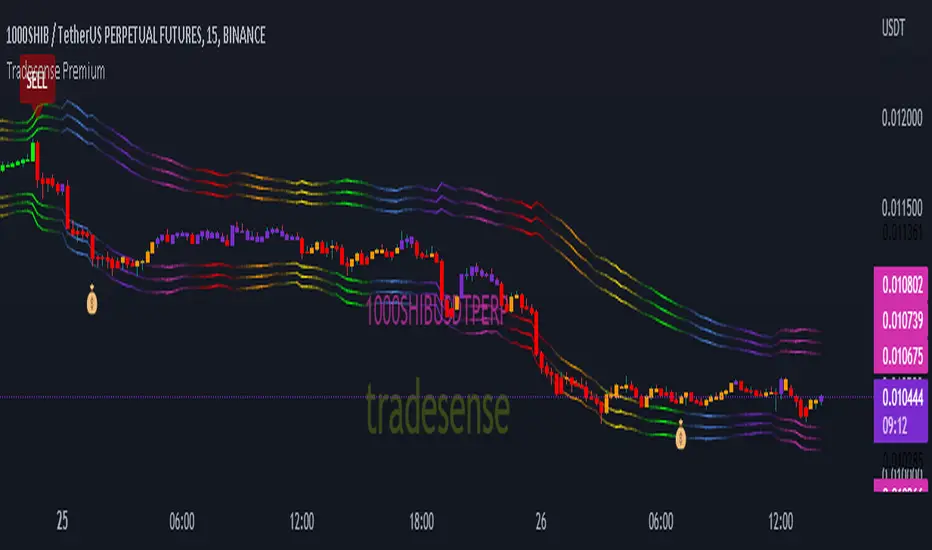
Tradesense PremiumTradesense Premium
Tradesense Premium indicator offers a buy & sell signal that is based from our senior analyst who have more than 10years of experience in Forex, Stock and Crypto trading and made it possible by our pine script developers.
Our script can detect market volatility based on the price direction and the absolute value of exponential moving average are multiplied to specific numbers to get a different trading style such as Scalper, Swing Trader and Trend Follower. We also filtered out all the signals using a different known indicators such as RSI, ATR, and ADX, and the results will allow you to enter a trade before the big moves occur. We also included all the important indicator which appears in real-time to get a competitive advantage in any market environment.
If you are a trader for a long time you should know that there is no way to avoid risk in trading. Every single trade could, theoretically at least, end up a loser. That is why our script also provides automatic risk management system which can gives you the ability to know exactly where to take the profit and to stop.
Trading style preset options - Will allows you to get the signals the way you wanted depending on your trading style. Ex. Scalper, Swing Trader or a Trend follower.
Bar color - Our bar colors are based on the price actions which detects the weakness of the bar or if the bar is ranging.
Reversal Zone - This indicator would identify possible price reversal zones.
Support & Resistance - This indicator draw a line at the pivot point to show possible support and resistance area.
Target Profit indicator based on price actions - This indicator will gives you an option to reduce your position or go out of the trade before the reversal happens.
Target Profit / Stop Loss based on ATR - This indicator will gives you a simple but effective risk management system to protect your capital. The TP/SL is based from the ATR.
Alert System - We are giving you an options to customize your alerts.
Our mission is to provide systematic way to build your success.
Release notes: Tradesense Premium V1.1
✅Trading style preset options
✅Bar color
✅Reversal Zone
✅Support & Resistance
✅Target Profit indicator based on price actions
✅Target Profit / Stop Loss based on ATR
✅Alert System
❓Trading style
Currently we have 3 sets of preset options that the user can use.
Scalp - this preset is made for the trader that wants a quick in and out of the trade. The best timeframe to this is 1min to 5mins chart.
Swing - this preset is for the trader who can wait a little bit longer in a trade. The best timeframe to use is 15mins to 1hour chart.
Trend - this preset is made for the busy people that can hold a trade more than a day. The best timeframe to use is 4hours to 1day chart.
❓Bar color
This options will change the color of your bars to lessen the noise of your chart.
Green Color is a bullish indicator
Red Color is a bearish indicator
Orange Color will signify that the trend is weakening
Purple Color is a consolidation/ranging price action
❓Reversal Zone
From the name it self, once the price is already hit the Reversal Zone the price will more likely to reverse or will make a correction.
❓Support & Resistance
When this option is enabled, the support and resistance levels will show up.
❓Target Profit indicator based on price actions
When this option is enabled, you will see a "💰" which means it's time to take profit or reduce your positions.
❓Target Profit / Stop Loss based on ATR
Most of the trader uses ATR as a stop loss level. When this option is enabled, the indicator for Stop Loss and Take Profit will show up and the TP/SL levels can be changed by changing the ATR Multiplier (Default is 1.8).
❓Alert System
Function alert is added and the user can customize it the way they want it.