[Joy] Aladdin Long Trading Strategy 1.0.0 AlphaAladdin's Long trading strategy is to test out Aladdin for long trades only
This strategy is mainly used to test whether Aladdin is suitable for a coin/stocks/futures or for any trading. The profitability, average drawdown, average profits, etc are used by me to decide whether to use it for trading.
What is Aladdin and what does it do?
Using the volume and gradual flow of non-interrupted data (wicks and body of the candles), it tries to detect the macro condition of the market so that one may know in which direction the market is flowing.
* Bearish / Sell sign: On the candle's close, I open a short position
* Bullish sign: On the candle's close, I open a long position
* I take at least 50% profit when the indicator indicates to do so. One can configure that value as desired from the configuration depending on one's risk/money management. I might even convert some portion of the position into stable coins.
FAQ
Q: Does it use some EMA /MA/etc.? Does it use any indicator with tweaked settings?
Answer: No.
Q: What does it mostly depend on?
Answer: Volume and gradual flow of non-interrupted data. The logic depends purely on volume , price bars and the wicks.
Q: Does it work with all coins, stocks, futures, instruments?
Answer: I prefer to use the exchange with the best possible data. Then backtest out to find the best possible timeframe, stop loss and target all derived from this script data.
Q: Can you make it free or make it open source?
Answer: There is no free lunch in this world. I will never reveal or share the source code!
Q: Do you provide ongoing support for the indicator?
Answer: Yes, as long as I can, I will continue updating the indicator
Q: Are the bullish /buy & the bearish/sell markers automatic?
Answer: I have no control over the markers. It is driven purely by logic from the script.
Q: Is this financial advice?
Answer: This is not financial advice. I do not guarantee any profit or loss. I am not responsible for any of your losses or profits. My indicators do not assure profit or loss. It also does not auto-open or auto-close a trade.
Assumptions:
Only long trades are opened and closed. No short trades.
Starting Capital: $20,000
Order Size: 20% of Capital
Data used: Whatever data is available from 2011 till today on Trading view
Findings:
INDEX: BTCUSD 83% profitability using 2day tf
54 closed trades
Profit factor: 16
Sortino Ratio: 5.2
Average Winning Trade: 30%
Average Losing Trade: 9.12%
Largest Winning Trade: 1218%
Largest Losing Trade: 20.25%
Below are the profitability rate for the timeframe and the coins listed as found by running the trading strategy over the following as of today (Aug 1st 2021 12:40 pm Sydney Time).
⚜️ INDEX:BTCUSD 83% using 2day tf
⚜️INDEX:ETHUSD 80% using 1day tf
⚜️FTTUSD 81% using 2day tf
⚜️SRMUSD 71% using 1day tf
⚜️ADAUSDT 81% using 2day tf
⚜️ALGOUSD > 90% using 2day tf
⚜️ALTPERP 81% using 2day tf
⚜️AVAXUSDT 75% using 1day tf
⚜️BANDUSD > 90% using 2day tf
⚜️BCHUSD 82% using 2day tf
⚜️BNBUSD 79% using 1day tf
⚜️BNBUSD 85% using 2day tf
⚜️CHZUSD 71% using 1day tf
⚜️COMPUSD 81% using 1day tf
⚜️DOGEUSD 77% using 1day tf
⚜️EXCHPERP 83% using 1day tf
⚜️FILUSD > 90% using 1day tf
⚜️FTMUSD 70% using 2day tf
⚜️HTUSDT 75% using 2day tf
⚜️KINUSD >90% using 2day tf
⚜️LINKPERP 85% using 2day tf
⚜️LTCUSD 80% using 2day tf
⚜️MATICUSD 77% using 2day tf
⚜️NEOUSD 80% using 1day tf
⚜️NEXOUSD > 90% using 1day tf
⚜️OKBUSD 71% using 1day tf
⚜️OMGUSD 75% using 1day tf
⚜️RSRUSD 87% using 1day tf
⚜️RUNEUSD > 90% using 1day tf
⚜️SHITPERP > 90% using 1day tf
⚜️SOLUSD 84% using 1day tf
⚜️SUSHIUSD 71% using 1day tf
⚜️THETAUSD > 90% using 2day tf
⚜️UNIPERP 83% using 1day tf
⚜️VERTPERP > 90% using 1day tf
⚜️XAUUSD 63% using 2day tf
⚜️XTZUSD 83% using 2day tf
⚜️ZECUSD 72% using 2day tf
Disclaimer:
No one knows what will happen in the future. DYOR and decide on your own conditions. Do realize that neither I nor my indicator can guarantee any profit or loss. And there is no assurance that any trade will ever result in any profit. It is not financial advice.
Saham

ATR with EOM and VORTEXThis is a strategy, designed for long trends for stock and crypto market.
Its made of ATR for volatility, EOM for volume and VORTEX for the trend direction.
In this case on the ATR, I applied an EMA to check if current position is above the EMA -> bull trend, below ema -> bear trend
For EOM I am using the positive and negative value scale, if its positive we are in a bull movement, otherwise a bear movement.
Lastly for VORTEX, I took the min and max, and made an average, after that I am using the average and compare it with 1 value. Above 1 -> bull, belowe 1-> bear.
This strategy only goes long.
If you have any questions, let me know.

Full CRYPTO pack macd, rsi, obv, ema strategyThis is a simple, yet very efficient crypto strategy, adapted to 4h time frame, on big coins like ETH and BTC. However it can be adapted to other markets, timeframes etc
For this strategy I use a combination of a trend line, an oscillator, price action and volume.
This strategy has both the opportunity to go long and short.
As well, it has a leverage simulator .
The rules are the next ones:
Long : we check that current candle is ascending and above the moving average, the macd is in positive range, rsi is below overbought level and volume is bigger than the moving avg of volume.
For short, we have the opposite long rules.
If you have any questions, please let me know !

MACD oscillator with EMA strategy 4H This is a simple, yet efficient strategy, which is made from a combination of an oscillator and a moving average.
Its setup for 4h candles with the current settings, however it can be adapted to other different timeframes.
It works nicely ,beating the buy and hold for both BTC and ETH over the last 3 years.
As well with some optimizations and modifications it can be adapted to futures market, indexes(NASDAQ,NIFTY etc), forex(GBPUSD), stocks and so on.
Components:
MACD
EMA
Time condition
Long/short option
For long/exit short we enter when we are above the ema, histogram is positive and current candle is higher than previous.
For short /exit long , when close below ema, histo negative and current candles smaller than previous
If you have any questions please let me know !

Volume RSI Crypto This is a special version RSI, in this case , I am using the volume, which is measuring the speed and change of volume to the price both up and down size.
Volume RSI attempts to gauge price trend changes via changes in bullish and bearish movements.
Its formula is :
VoRSI = 100 - 100 / (1 + VoRS)
where VoRS is Volume Relative Strength over specified period which is calculated as a ratio between averages of Up-Volumes and Down-Volumes:
VoRS = (Average Up-Volume) / (Average Down-Volume)
The logic for this strategy is simple
We entry long when we have a crossover with the Overbought level and we entry short when we have a crossunder with oversold level.
If you have any questions, please let me knw !

CRYPTOOO FOX (Trading System)CRYPTOOO FOX (Trading System)
---DISCRIPTION---
How Strategy Work :
--Strategy is working on higher time frame so i use two high time frame
the higher is ( 2 H or 3 H or 4 H or 8 H or 12 H or Daily ) and the highest is ( Daily ) Time frame .
-- When the higher time frame cross over the Daily time frame( the Highest ) this mean the TREND and
the PRICE also going UP this strategy is going to long position ( Buy position ) .
-- When the higher time frame cross under Daily time frame( the Highest ) this mean the TREND and
the PRICE also going DOWN strategy going to ( close position ) .
-- Notes :
--Strategy use some averages to calculate the higher time frame .
--Strategy use parabolic indicator to filter entries which name is ( Filter )
--Strategy use one more candle close to confirm entry ( Filter 2 )
--This the best time frame ( HIGHER , HIGHEST ) in this strategy in profit and draw down .
--Strategy is working only in Long position i am not recommend to use it in short positions .
--THIS IS NO REPAINT STRATEGY .
--DON'T use it in DAILY time frame
--I recommend so mush to use take profit and stop loss although the low draw down but some time
the market have a huge movements .
---- Strategy Settings which we publish now :
Fees = 0.1 the same as market fees .
Equity = 10 % and you can change it as you want .
Filter = 4 .
Filter 2 = true ( Just mark in check box beside Filter 2 ) .
Charts which working in these settings :
Eth/Usdt- 30 min/Binance ( Current image ) .
Btc/Usdt- 30 min/Binance .
Bch/Usdt- 30 min/Binance .
We do a lot of tests to get the best profit and also the lowest draw down
we will update the new settings for new charts

[astropark] Trend Skywalker V1 [strategy]Dear Followers,
today another awesome Swing and Scalping Trading Strategy indicator: Trend Skywalker !
It shows a trend cloud that reacts very fast to price action, so it's perfect for trending markets: it helps a lot to find out
when a trend is going to end and a new is going to start
when to enter again within a trending market
where to put your stoploss
In this example below you can see the three points above:
In fact in a trending market it will highlight that:
price consolidation within the could is a trend weakening signal , so you can easily spot when a trend is going to end and a new is going to start
bullish/bearish trend cloud retests are nice opportunity to re-enter within a trending market, especially if cloud is thick
where to put your stoploss ( below the cloud and/or recent low in a buy scenario , above the cloud and/or recent high in a sell scenario )
This strategy/indicator has the following options:
change analysis window (the lower, the more reactive; the higher, the less reactive)
enable/disable signals on chart
enable/disable "more confirmations" signals filter
enable/disable bars and background coloring based on trend
enable/disable an automatic Trailing Stop strategy option (Automatic Stops)
enable/disable a peak profit tracker (the max percentage profit labels)
enable/disable highlights of trend cloud retests
enable/disable highlights of trend cloud price breakouts
Here below some examples how the indicator works on many markets and timeframe.
ETH/USD 4h
EUR/USD 15m
LTC/BTC 1h
This strategy only trigger 1 buy (where to start a long trade) or 1 sell (for short trade).
Keep in mind that proper risk management and money management strategies are very important to manage your trades (DM me if you need any clarification on these points).
This script will let you backtest the strategy performance over the backtesting period you set in input (it may be a lower period, depending on tradingview candles limitation related to your account).
The one for setting alarms can be found by searching for the astropark's "Trend Skywalker" and then choosing the indicator with "alarms" suffix in the name.
Strategy results are calculated on the time window from February 2018 to now, so about 3 years, using 10000$ as initial capital and working at 1x leverage (so no leverage at all! If you like to use leverage, be sure to use a safe option, like 2x or 3x at most in order to have liquidation price very far).
This is not the "Holy Grail", so use proper money and risk management strategies.
This is a premium indicator , so send me a private message in order to get access to this script.

Heikin-Ashi Change Strategy/ Indicator
Today I bring you a simple and efficient indicator/strategy based only on HA.
Can be used together with other TA tools or alone.
The idea behind is simple :
We have to forms to calculate the candle, using inner HA candles or normal candles. Once we have that we apply certain rules to get the max high, min low, open and close(ohlc)
With that then we check for changing in the patters like for example
For long close is higher than open and the previos close is lower than open. For short is going to be the opposite of long condition.
For the purpose of this example, I only use long direction and exit once we have the short signal.
If you have any questions, please let me know in private chat !

MavilimW Strategy MTF EMA with HA CandlesThis is a strategy adapted initially for Mavilim moving average indicator, based on WMA MA.
It seems to works amazingly on long term markets, like stocks, some futures, some comodities and so on.
In this strategy, I form initially the candle, using EMA values, so I take the EMA of last 50 closes, open, highs and lows and form the candle
After this I take interally HA and convert the EMA candle to HA.
Then using the moving averages on multiple timeframes, like in this example we have a chart on 4h, but I use 1h and 1d moving averages.
For long condition we have : close is above moving average timeframe1 and oving average timeframe2 and oving average timeframe3
Initially short would be close below ma timeframe1, ma timeframe2 and timeframe3 -> but here I also convert it into a long signal.
So we actually go only long .
And we have 2 different exits : for first long if we have a crossdown of 1h ma with 1 day ma, and for second long if we have a cross up of 1h ma with 1 day ma in this example.
Message me if you have any questions about this strategy.

Heiken Ashi MTF Strategy- IndicatorHello, this is both a strategy and indicator that revolves around Heikin Ashi candles.
In this case we take 3 different time frames, in this example we use daily , weekly and monthly.
The conditions for entry are :
For long : we check that we have a green daily candle, at the same time we check that the weekly and monthly candles are also green.
For short : We check that all candles, daily, weekly and monthly and red.
For exit of long : as soon as 1 of the 3 candles, daily or weekly or monthly converts to red, we exit.
For exit of short : as soon as 1 of the 3 candles converts to green, we exit.
This strategy- indicator can be adapted to any type of market.

Profit MAX MTF HeatMapThis is a powerfull strategy which is made from combining 3 multi timeframes into one for profit max indicator
In this case we have daily, weekly and montly.
Our long conditions are the next ones :
if we have an uptrend on all 3 at the same time, we go long.
If we have a downtrend on all 3 of them at the same time we go short.
For exit, for long, as soon as one of the 3 converts into downtrend we exit the trade.
For exit, for short, as soon as one of the 3 converts into uptrend we exit the trade.
This tool can be used on all types of markets, and can also be changed the time frames.

Quansium Series A BacktestThis comes with preconfigured setups or strategies. Simply choose one from our list based on the timeframe it was made for. Leverage can be changed; to keep trading safe, a maximum of 2 is allowed. In our findings, this was able to trade crypto (specifically BTC ), MES (Micro E-mini S&P 500 Index Futures ), and stocks. It is important to know that setups A, B, C, and D use variable position sizing, and dynamic stop loss/trailing stop/take profit, these parameters are provided through the alerts. The rest of the strategies were created with a simpler approach in mind, just plainly entry/exits signals.
Quansium as a framework:
Price reformat: we take the price source (Open, Close, High, Low) and remove any noise that affects the accuracy of our signals.
Time awareness: we take several time periods of the data on the chart such as start, end, and whole. We use this to add more depth to our signals.
Position size: our backtest tries to recreate as much as the real world trades as possible so our position is determined by the current equity. We also use the volatility of the market to increase or decrease our exposure or risk.
Risk awareness: stop loss, take profit, trailing stop are the risk exits we use to provide our users some peace of mind. These parameters are totally dynamic and follow the same behavior of the market.
Signals filtering: to make almost non-existent any errors and increase the quality of our trades, our indicators go through multiple phases, this avoid double entries or early exits, and help maintain a record of what has transpired and what’s currently taking place.
Indicators: whenever we can we use custom code or our own functions instead of the defaults ones provided. This gives us total control of what we’re trying to achieve. In many cases we tend to combine several indicators’ logic into one creating a more personalized take on it.
Easiness: since we started our main goal has been to provide the easiest and fastest way to alerts’ creation. It has taken us years to reach this level where now we already provide a list of preset strategies so the user doesn’t have to spend much time tinkering with scripts and more on other matters, because we know life is more than just trading.
Raw signals: we provide the option to turn off as much of our advanced features such as stop loss, take profit, trailing stop, dynamic sizing, etc, etc for a simple approach. Trade signals still go through the signals filtering method mentioned above,
Timeframe pairing: we take trading very seriously, by no way we’ll want the user to lose money (although such thing is expected because past results aren’t an indicative of futures ones), through years of experience we have found what are usually common mistakes the user makes, this feature allows us to only activate the strategy if the right timeframe is chosen.
Trend filters: through the years we have improved the arts of the trend. We like to keep things simple but yet powerful. We observe the macro and micro trend of the security. This helps confirm we are entering at the desirable timing. We also incorporate volume and volatility into decision making, we simply programmed it to trade when these are increasing and higher than the average values observed in both the short and long term. Finally we take into account the strength of the pair to make our final choice of whether to enter or wait, and if anything flashes contrary movement then we cancel the upcoming signal and stop monitoring until the next one comes along.
Full automated risk: stop loss, take profit, and trailing stops usually are set in percentages, and optimized even more using the current market behavior to become more adaptive. But always remains some sort of fixation, so the user must choose a value somewhere. This is where our framework shines the most, as previously mentioned before when we take time into our calculations, we use several periods to observe performance and get values that keep our risk exits natural and closest to the flow of the market itself.
Setups:
A: Centered oscillator with the difference of several moving averages with more sensitive settings. Momentum focused.
B: Centered oscillator using simple moving averages. Trend-Following focused.
C: Centered oscillator using smoothed data with the help of faster moving averages. Trend-Following focused.
D: Centered oscillator with the difference of several moving averages with less sensitive settings. Trend-Following focused.
E: Centered oscillator with the difference of moving averages where the standard deviation is applied first. It uses less sensitive settings. Trend-Following focused.
F: Finds the relationship between multiple readings of the price’s relative strength to better pin-point downs and ups. Trend-Following focused.
G: Centered oscillator with the difference of moving averages where the standard deviation is applied first. It uses more sensitive settings. Momentum focused.
H: Multiple centered oscillators using various moving averages. Trend-Following focused.
I: Centered oscillator using simple moving averages. Momentum focused.
Note: The framework is composed of almost 1000 lines of code as compared to each indicator that makes up the setup which is around 10. The power from Quansium doesn't come from the strategies themselves but rather the overall system that turns simple signals into complex and advanced trades.
Strategy Tester:
Initial Capital: chosen value is $20,000, as an approximate to Bitcoin’s ATH (All-Time High). In previous iterations we noticed some trades won’t go through if the capital was less than the ATH.
Order Size: 100% of equity (although the script controls this, and this is of no regards to the results).
Pyramiding: 1, system doesn’t place multiple entries in a row, only one at a time.
Commission: This simulates order execution with custom trading fees. Commissions are turned off by default because this script works in various markets and each operates differently. In order to reach results that are close to real world conditions, it is imperative the user fills this based upon their broker or exchange data.
When we started, we were focused on finding the best indicator, or creating it ourselves. After years we came to realize that the secret is not in which indicator you use but the framework behind it. All strategies have bad, good, best, worst performance periods. The key of a good system is to help keep you safe when it’s down and maximize your potential when it’s up. We hope this material at the very minimum inspires you to keep going and not lose faith, because it is not the smartest who win but those who persevere.

GreenCrypto PR Strategy for Swing TradesThis is a very good strategy for Swing Trading, I have been using this strategy for very long time and made good amount of profit using this. This works great for both long trades and short trades, Stop loss and Take profit target is must while entering the trade, this make sure that the trade ends up in good profit and in case if the market revers, ends in only small loss.
This strategy works using the pivot points, we calculate the pivot point using the number of candles mentioned in the input field "leftBars" and "rightBars", if you add more number of bars then the frequency of the trade decreases. for example with the leftBars as 4 you will get less trades than the leftBar=2. Every trade entry is represented using "Buy" and "Sell" signals, whenever there is a new signal chart shows buy/sell signal for limit price, you need to add a limit order for the same price.
Parameters:
LeftBars = Number of left bars should be used for calculating the pivot pints, (more bars means less frequent trades)
RightBars = Number of right candle bars used for calculating the pivot points (more bars means less frequent trades)
Date/month/day : for selecting the right backtesting the period (currently it set to Jan 2018 to current day )
for this backtesting i have used 1000$ capital and with 10% capital used for each trade, free to modify it as per your needs.
This strategy works best on 4H time frame but you can also try backtesting on other time periods.
The default parameters present in the strategy is works best for most of famous cryptocurrencies on 4H time period.
Please DM me if you would like to tryout 7 Days free trail.

Swing/Daytrading strategy with reversal option
Hello, today I bring a swing reversal strategy that work on all financial markets.
It uses timeframes starting from 1h, the bigger the better.
Its very dangerous because it has no stop loss, neither a take profit. Our exit condition is based on the reversal on the entry .
For entry we have 2 types : normal and reversal
Lets say we want to go long , for that we check the last CLOSE of a candle with the previos HIGH. If its higher than that, and at the same time CLOSE is bigger than the moving average, we have a long entry.
For short we have CLOSE with the previous LOW. If its lower than that and at the same time is lower than moving average, we have a short entry.
For moving average we use T3 MA
For reversal what I do, is , I take the short condition and I apply it to long, and for long I apply the short condition.
On many cases I found out it work amazingly.
I forgot to add: it also has a time entry system, so we use the best hours/sessions for entries .
Exit a trade: lets say we enter short, when we find a long condition, we close short and enter into long. Viceversa for long.
If you have any questions, let me know.
Enjoy it :)

Long only strategy VWAP with BB and Golden Cross EMA50/200
This is strategy, mainly designed for stock markets
It makes uses of the EMA 50/ 200 ( Golden cross) and VWAP and Bollinger bands.
It only takes long positions. It can be adapted to all time frames, but preferably to be used with longer timeframes 1h +
The rules for entry are the next ones :
1. EMA50 > EMA 200
2. if current close > vwap session value
3. check if price dipped BB lower band for any of last 10 candles
EXIT RULE
1. price closes above BB upper
STOP LOSS EXIT
1. As configured --- default is set to 1%

[astropark] DMI/ADX strategy [strategy]Dear Followers,
today I'm happy to share with you my DMI / ADX Strategy .
It provides directional trend information, so if a bullish or a bearish trend is going to start. Statistically it works better on lower timeframes (from 5 minutes to 1 hour).
It is both a Swing and Scalping Strategy indicator , based on a simple trend following theory , good for trading FOREX, Indexes, Stocks, Commodities and Cryptocurrencies.
To help in Taking Profits, the strategy integrates 2 special other than bull/bear signals:
Overbought and Oversold RSI Signals , which appear both as darker background (the darker the color, the more the price is in overbought/oversold) and green "ob"-"tp" / red "os"-"tp" labels (they optionally pop up only on a configurable stronger overbought/oversold condition) (you can enable/disable it optionally)
Peak Profit Tracker , which resets every time a new trade starts and keeps track of price fluctuation during the trade: the message is don't be too greedy and take profits or lock them with a stoploss in profit (you can enable/disable it optionally)
You can edit many options in order to
have more/less bull/bear signals
enable/disable showing bull/bear signals
enable/disable showing RSI TP signals (you can edit RSI length, overbought (OB) and oversold (OS) levels)
enable/disable showing peak profits on each trade
The user who wants to use this strategy, especially via an automated bot, must always set a stoploss (example 150$ from entry on bitcoin ) or use a proper risk management strategy .
This is not the "Holy Grail", so use it with caution. It's highly suggested to use a proper money management .
This script will let you backtest performance of the indicator based on bear/bull signals.
You can find the alarms version by searching for my DMI / ADX Strategy and choosing the "alarms" named.
Here there are some examples how this DMI / ADX strategy works on many markets:
LTC/USDT 15m
BTC/USD 15m
BNB/BTC 15m
ETH/USD 15m
GOLD (XAU/USD) 15m
GOLD (XAU/USD) 1h
FB 15m
AAPL 15m
TSLA 1h
BANKNIFTY Index 5m
NIFTY 50 Index 5m
This is a premium indicator , so send me a private message in order to get access to this script .

Stock Market Strategy : VWAP, MACD, EMA, Breakout, BBHello there,
Today I bring you a stock market strategy, specialized in NASDAQ stocks.
Its a daytrading strategy, that can only do a max of 1 trade per day. In this case it only trades the first 2 opening hours of the market.
The rules are simple :
We follow the trend based on a big EMA, in this case 200, after that, we check for VWAP direction , then, we check histogram from MACD. This is the simple logic of the strategy.
Inside there is another strategy, that not just do the above, but also uses Bollinger bands, and checks for breakout of bottom or top line. Also it uses Average directional Index, for even a bigger criteria .
So for example a long condition it would be : candle is above the ema, and candle is above vwap, and histogram is positive, and candle break the top bb level and ADI < 40 -> long signal . The opposite works for short(ADI > 20).
In this case all this criterias are between the first 2 hours of market. So we enter between the first hour, and exit in the next hour. For this we need to use very short time frames.
Hope you enjoy it.
Let me know if you have any questions

Ichimoku with MACD/ CMF/ TSI This is a strategy made from ichimoku cloud , together with MACD, Chaiking Money FLOW and True Strenght Index.
It can be adapted to any timeframe and any type of financial markets.
The idea behind its very simple,
We combine the long / short strategy from ichimoku, like cross between lines and below/above cloud together with histogram from MACD for positive/negative level. We use the same criteria for TSI and CMF, to check if its above or below 0 level.
Based on that we have a long or a short entry. The exit happens when the next options triggers, like for example we had long signal, we exit when we receive the short signal and viceversa.
It can be adapted with a risk management to apply a tp/sl level.
For any suggestion or details , let me know.

ETF / Stocks / Crypto - DCA Strategy v1Simple "benchmark" strategy for ETFs, Stocks and Crypto! Super-easy to implement for beginners, a DCA (dollar-cost-averaging) strategy means that you buy a fixed amount of an ETF / Stock / Crypto every several months. For instance, to DCA the S&P 500 (SPY), you could purchase $10,000 USD every 12 months, irrespective of the market price. Assuming the macro-economic conditions of the underlying country remain favourable, DCA strategies will result in capital gains over a period of many years, e.g. 10 years. DCA is the safest strategy that beginners can employ to make money in the markets, and all other types of strategies should be "benchmarked" against DCA; if your strategy cannot outperform DCA, then your strategy is useless.
Recommended Chart Settings:
Asset Class: ETF / Stocks / Crypto
Time Frame: H1 (Hourly) / D1 (Daily) / W1 (Weekly) / M1 (Monthly)
Necessary ETF Macro Conditions:
1. Country must have healthy demographics, good ratio of young > old
2. Country population must be increasing
3. Country must be experiencing price-inflation
Necessary Stock Conditions:
1. Growing revenue
2. Growing net income
3. Consistent net margins
4. Higher gross/net profit margin compared to its peers in the industry
5. Growing share holders equity
6. Current ratios > 1
7. Debt to equity ratio (compare to peers)
8. Debt servicing ratio < 30%
9. Wide economic moat
10. Products and services used daily, and will stay relevant for at least 1 decade
Necessary Crypto Conditions:
1. Honest founders
2. Competent technical co-founders
3. Fair or non-existent pre-mine
4. Solid marketing and PR
5. Legitimate use-cases / adoption
Default Robot Settings:
Contribution (USD): $10,000
Frequency (Months): 12
*Robot buys $10,000 worth of ETF, Stock, Crypto, regardless of the market price, every 12 months since its founding time.*
*Equity curve can be seen from the bottom panel*
Risk Warning:
This strategy is low-risk, however it assumes you have a long time horizon of at least 5 to 10 years. The longer your holding-period, the better your returns. The only thing the user has to keep-in-mind are the macro-economic conditions as stated above. If unsure, please stick to ETFs rather than buying individual stocks or cryptocurrencies.

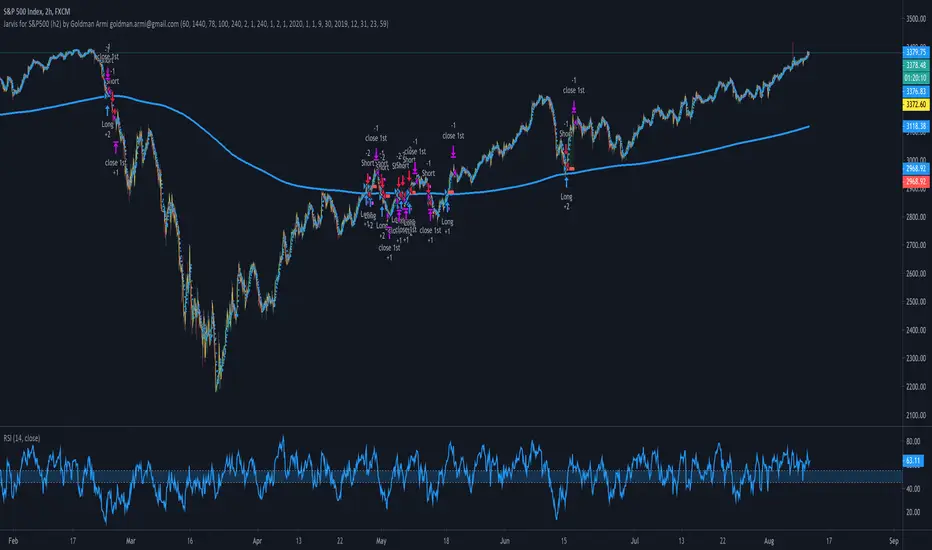
Jarvis for SPX500 (S&P500) by Goldman ArmiThis strategy is called JARVIS after the famous AI from the MARVEL movie Iron Man.
It is an improvement of the Copernicus Strategy to get better results. More exactly I was aiming to obtain over 50% of the number of trades profitable, for every pair provided (see the title).
The strategy tester does not include leverage trading, please keep that in mind and feel free to change the parameters of the volume for the position in the strategy settings to see the closer to reality results.
The setup for this strategy is more complicated because it includes 3 averages, all of them calculated with prices obtain by various formulas for each one of them and I call this: Sophisticated Moving Average (Copyright). Each of the 3 averages are applied to different timeframes and have different values. All of these parameters are configured separately for every trading pair and this is why I am publishing them separately.
There are not a lot of trades in this strategy, the average is around 3/month and the backtest you see here is from January 2020 until the time of this publication.
You can use the Tradingview alert services to configure this to execute (webhook) on your exchange/broker, because strategies have now the possibility to send alerts.
For other questions please send me a message.
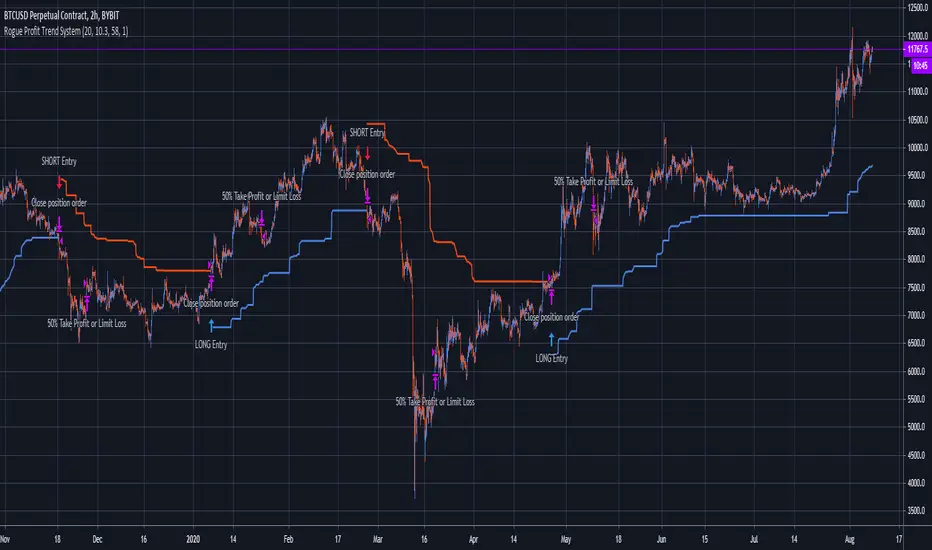
Rogue Profit Trend SystemThis system can be used for all assets. This script identifies trends and when to enter and exit. There is also built in risk management in the form of a take profit target or a reduction of risk to limit a losing trade. Inputs are variable and can be changed to better suit the asset and time frame you are trading. Since the risk management (take profit or limit loss) is calculated by 50% of your position, this system is designed to trade in multiples of two's. For example, you enter into a position with $100 at risk, when your risk management signal fires, it will reduce your position by 50% to either snag some profit or limit a loser leaving you with $50 in the position. Close the trade completely when the trend reverses for either a profit or loss.
Nothing about trading is easy. You will have losing trades. Managing your risk is the key to success which is why this system is so powerful. Markets are fluid and random so you will have to put some time and effort into adjusting the system inputs for each asset and the respective time frame you are trading and continue to adjust as time passes. This system will make you money if you manage it correctly and systematically.
Message me for two day trial access. Happy trading!
Aditya Signal-1.1 for Nifty and Bank NiftyThis is non-repainting indicator which can be used for Index, Stocks, Commodities and Bitcoin or any other securities depending upon the various parameter setting of the indicator. This particular strategy is for Nifty-50 Index which is traded on NSE(India).
The detailed description about the indicator is as follows:
Long Period: Period for calculating Primary Signal Line (Yellow).
Long Period Input Source: Input for calculating Primary Signal Line.
Short Period: Period for smoothing the Primary Signal Line.
Short Period MA: Method for smoothing the Primary Signal Line.
No. of ATR Bars: No. of ATR bars for calculating Primary Signal Line.
ATR Multiplier: ATR multiplier for ATR calculation.
Trade Trigger: Value above or below of Primary Signal Line for Long or Short signal. The dotted lines in Green and Red color represents the same.
Bar Crossover Input Source: Current bar input for additional signal confirmation above Primary Signal Line.
Bars Above Signal High: No. of bars closing above Secondary Signal Line (Blue)
Bars Below Signal Low: No. of bars closing above Secondary Signal Line (Purple)
No. of bars crossover method uses certain no. of bars for closing above High or Low of the crossover of closing price and the Primary Signal Line in combination with Trade Trigger. The idea behind this design is to avoid fake signal due sudden spike in price. Also, this ensures that price consolidates above High in case of Long signal confirmation and vice-versa. By increasing no. of such bars, we can anticipate, how much time it takes for short-term and long-term trend reversal.
Depending upon the time-frame, just by observing the High and Low of previous crossover of closing price and Primary Signal Line, we will have better understanding of undercurrent of market.
By using different combination of Trade Tigger value and no. of bars above and below, we can anticipate better trend confirmation.
The various combinations of price source of Long Period Input Source and Bar Crossover Input Source, the Short Period MA method shows promising results. Kindly PM me for these optimum settings for other financial instruments.
It always better to book partial profit after getting into the trade which increases the odds. The default trade quantity is 2. We book 1 quantity after our partial profit target is reached and let the remaining quantity be in the trade until the reversal of trend. By enabling or disabling the same we can determine the profit or loss from historical trade from when the trade quantity is 1. Just remember to change the default quantity to 1 in Order Size from properties when you disable the Take Partial Profit option.
Take Partial Profit: Whether to book partial or not as explained above.
Partial Profit Points: It always better to book partial profit after trend getting into the trade. The default trade quantity is 2. We book 1 quantity after our partial profit target is hit and let the remaining quantity in the trade until the reversal of trend.
Instrument Type: We can select the which instrument for analysis. By adjusting the Take Partial Profit value by selecting Other Option, you can analyze instrument of your choice other than mentioned in the list for Partial Profit depending upon stock tick value and lot quantity or you can PM me. I have adjusted value for Crude Oil and Silver for MCX(India) future contract values.
This is a premium indicator so send me a private message for 15 days free trial.
"Use the link below to obtain access to this indicator."
Disclaimer: This script/strategy is for educational purpose and individual use only. The author of this script/strategy will not accept any liability for loss or damage as a result of reliance on the information contained in the charts. Please be fully informed regarding the risks and costs associated with trading the financial markets.

Custom Screener with Alerts [QuantNomad]Some time ago I published an example of simple custom screener in PineScript:
The only thing this screener did is created a dynamic label with screener output.
Recently TradingView announced alerts from the strategy with the possibility to add custom messages to alerts.
So using it I was able to create a bit more advanced screener which sends results as alert messages. With tools like Alertatron, you can easily redirect them to Telegram if you want.
It works for 40 symbols (limitation of the number of security calls).
To create your own screener you need to change only screenerFunc. The logic of this function is very simple, it outputs value you want to display in screener and condition based on which your screener should filter your stocks.
To create alerts for this screener create an alert from strategy and use {{strategy.order.alert_message}} as alert message.
Do you know now how to make this screener better? Let me know.
Disclaimer
Please remember that past performance may not be indicative of future results.
Due to various factors, including changing market conditions, the strategy may no longer perform as good as in historical backtesting.
This post and the script don’t provide any financial advice.
