SAMURAI SWORDSamurai Sword is an add on tool for Ninja Scalper and the next evolution of the Trend Trade Indicator.
It auto plots the fib retracement to speed up target acquisition support and resistance areas based on the formula to increase the success rate of trade entry and exits.
None of this is to be taken as investment advice but rather Edutainment and infotainment
#TradeSocially
Stocktrading

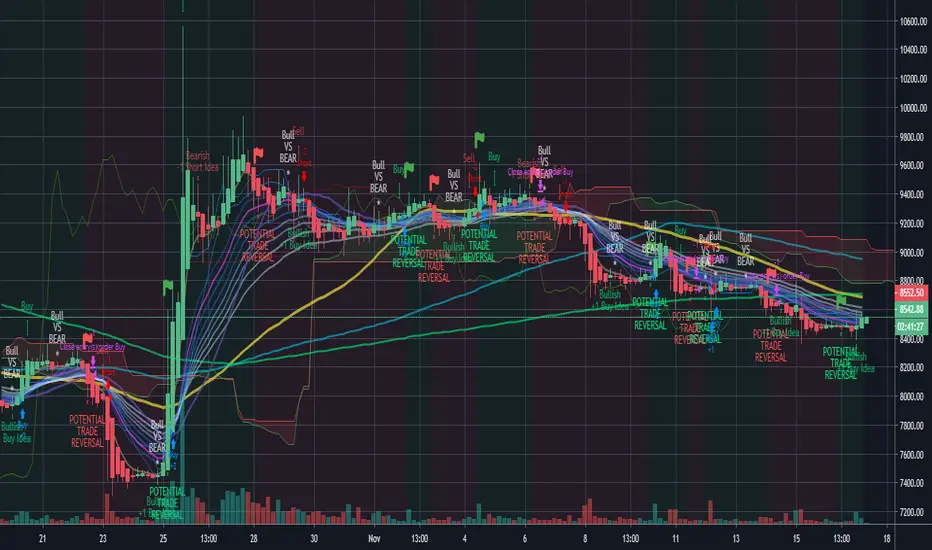
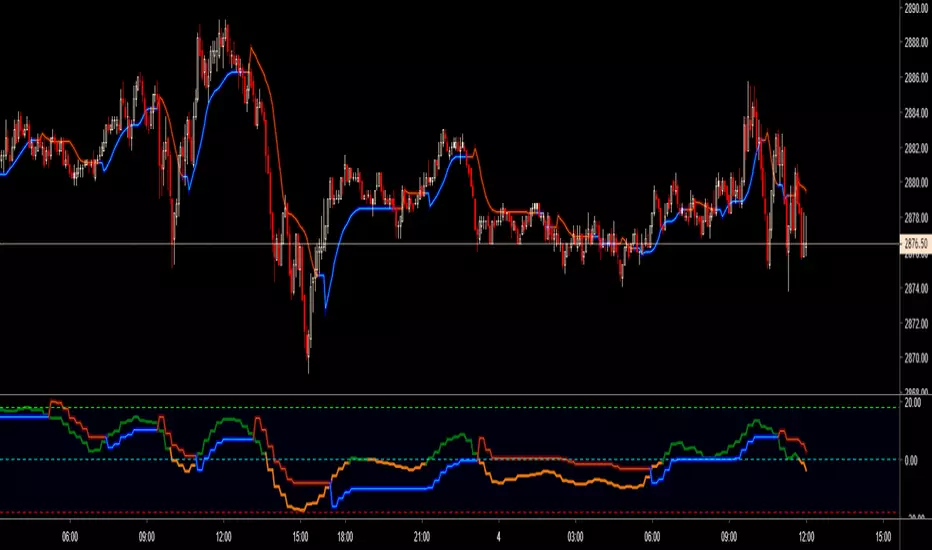
NINJA SCALPERNinja Scalper is the next evolution of the Trade Trend Indicator.
I have been trading for over 23 years now and these indicators are based on my trading style risk verse reward. The change in this is to make it more responsive and to integrate with Sword.
The background of this indicator is:
The original Trade Trend Indicator (indicator) has been the brain child of 23 years of trading experience rolled into a simple to understand all market setup alert system based solely on 5 high probability trade set ups with a 6th high risk. The hope is to provide something that is can assist traders in building confidence in their trades with a little assistance from the indicator.
This like any and all indicators is not a be all and end to trading, yes while back tested the indicator has produced fantastic profitable results; past performance is not a guarantee of future but which with human intervention can increase the return result exponentially.
You need to be able to chart simple candle sticks and you need to have an understanding of support and resistance areas to make sense of what you are doing in trading otherwise even this indicator won't help you.
While this may alert buy or sell / long or short entrance these are to be taken as educational points of reference and if you wish to trade you are understanding that you enter and exit at your own risk. Not many indicators will alert you to the possibility of a rogue wave spike / dump or both, this will but everything is perspective of the time frame you are on.
The indicator is designed for the 4hour time frame with trade entry on the 15min and managed on the 30min time frame. Alot can happen within these time frame but as we know not every trader can sit in front of a screen for hours at a time and this let's one trade for swings. Once you have your entry you place your exits and you set your stops. If you wait for the alert to exit you are in a draw down this should never reach that point pay yourself for being right.
The some set ups are simple:
1. Trend change from bearish to bullish buys are dip interim support entries.
2. Trend change from bullish to bearish sells are top interim resistance exits.
3. Blue buy is an entry position for a trade.
4. Blue long is an add position for a trade.
5. Red short is just that a short trade idea. (this is advanced and requires a manual cover target),
6. Green buy is a break out over the next candle to print above (highest risk)
All trades are based on a 5% to 10% of capital entry with no more than 40% ever in 1 trade goal is many consistent trade wins while limiting the losses and size.
Certain set ups such as longs over the Moving Averages but below the cloud can lead to strong rally returns as well as short in a bearish trend just above the Moving Averages can give prolonged selling pressure.
Pay attention to the golden dump line as it rises the closer to the candle it gets the higher the risk of the trade lacking continuation.
None of this is to be taken as investment advice but rather Edutainment and infotainment
#TradeSocially
Rolling Moving Average, SMA/EMA, for IPO stocksThe script replicates the standard EMA/SMA used by tradingview, but also adds an estimate for the first X periods, where X is the length of the moving average. This allows for an estimate of support resistance in IPO stocks, when fewer date is available

Relative Volume Combined With a Cumulative FunctionHi everyone
The today's script was suggested by a follower.
--------------------------------------
1 minute of Knowledge
--------------------------------------
Many traders look at volume as a pre-signal that a move may happen.
In trading, some say that "the volume precedes the movement".
This simply means that often volume will increase before a significant move in the stock.
Imagine if a unique trader is buying a crypto/stock. The volume is unlikely to move.
But, if all the mass goes to mass spot buy an asset, then we could see a volume spike announcing a potential upwards move.
---------------------------------------------
What's the story with that indicator?
---------------------------------------------
It's an interesting way of presenting the volume data.
Will show the total volume for the selected period.
You can choose between relative and cumulative presentation.
The users can display the consecutive rising volume above the 0 line and the failing volume below that line.
--------------------------------------
Mix knowledge with usefulness
--------------------------------------
A price making a higher/high (HH) or lower/low (LL) has a real and strong meaning- a HH or LL on a volume has a significant meaning also.
Increasing volume for a stock/crypto, could signify that buyers were willing to purchase a bigger number of shares at a higher price (comparatively to the day before)
Obviously, non-stop crazy buying/shorting won't work at some point - and that "some point" may hurt a bit.
Such volume indicator combined with others like momentum or strength indicators is a nice trading strategy.
The volume announces that a move may happen and the other indicators will confirm the prophecy :)
Peace
Dave
Gap Up and Gap DownIdentify gap ups and downs by percentage and amount.
Set alerts for:
Gap up/down by %
Gap up/down by $
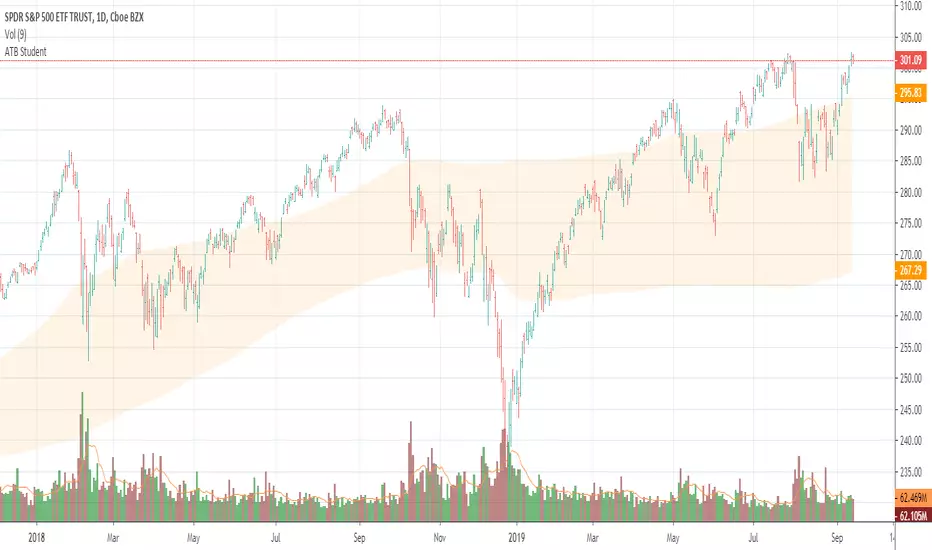
Apex Transformation Band StudentApex Transformation Band Student Version
Gauge the mean range of price on an annual/yearly basis of the market.
Determine if price is in an uptrend (above the zone), neutral (inside the zone) or downtrend (below the zone).
Works on 'Daily' time frame only.
Works only for SPY , QQQ , DIA , IWM , GLD , SLV , TLT and BTCUSD
Keep it simple.
PpSIgnal Quantile Band 3.0We made a multi indicator using the Quantile Band, the Rsi qqe, bollinguer band 10.1 and a sma 34 price per half.
Quentile band: In statistics and the theory of probability, quantiles are cutpoints dividing the range of a probability distribution into contiguous intervals with equal probabilities, or dividing the observations in a sample in the same way.
Quantitative Qualitative Estimation, is based on a rather complex calculation of the smoothed RSI indicators.
The QQE indicator consists of a smoothed Relative Strength Index (RSI) indicator and two volatility-based trailing levels (fast and slow). The Fast Trailing Level (TL) and Slow TL are constructed by calculating the ATR of the smoothed RSI over n-periods and then further smoothing the ATR using an additional n-periods Wilders smoothing function. This smoothed ATR of RSI is then multiplied by the Fast and Slow ATR Multipliers to calculate the final Fast and Slow Trailing Levels.
Bollinger band 13. 1: is the bb with 13 period and deviation 1, we can find the volatile when the price is above or below of the bb band.
the best enter
Buy: price above of quintile band 50, sma 35 and bollinger band.
Sell: invest of the buy signal.

Ppsignal GSV V1Entry pattern GSV (Greatest Swing Value)
We return with another Larry Williams pattern, the Greatest Swing Value or GSV, in principle this pattern was developed for the S & P 500, but it could be extrapolated to other markets, as with the previous pattern we will only explain it for long positions. First of all we have calculated the difference between the maximum and the opening of the last 4 bars and its average, that is to say: /4. Being H the maximum of each bar and the O the opening price of each bar. From this average we will extract 180%, that is, we will multiply it by 1.8. The value of this result will be the GSV.
The logic of this GSV entry pattern is as follows: a widely used way to enter the markets is the breaking of highs, but many times false breakdowns occur or what Larry Williams calls "failure swings", to avoid these false ruptures Larry invented the GSV, which is like a moving average applied to the Swing Value (the difference between the maximum and the opening price).
Once we have the GSV we must add it to the opening price of the current bar and the entry will occur when the price exceeds this level.
to determine the entrance we use bollinguer band and atr. In this way we enter the pattern with volatility.
Patrón de entrada GSV (Greatest Swing Value)
Para esta tecnica usamos la volatilidad para determinar entradas, bollinguer band 13.1 y atr...
Volvemos con otro patrón de Larry Williams, el Greatest Swing Value o GSV, en principio estepatrón fue desarrollado para el S&P 500, pero se podría extrapolar a otros mercados, al igual que con el patrón anterior solamente lo explicaremos para posiciones largas. Primero de todo hemos calculado la diferencia entre el máximo y la apertura de las 4 últimas barras y hacersu media, es decir: /4. Siendo H el máximo de cada barra y la O el precio de apertura de cada barra. De esta media sacaremos el 180%, es decir, lo multiplicaremos por 1.8. El valor de este resultado será el GSV.
La lógica de este patrón de entrada GSV es la siguiente: una forma bastante usada para entraren los mercados es la ruptura de máximos, pero muchas veces se producen rupturas falsas o loque Larry Williams llama "failure swings", para evitar estas rupturas falsas Larry inventó el GSV,que es como una media móvil aplicada al Swing Value (la diferencia entre el máximo y el preciode apertura).
Una vez tenemos el GSV deberemos sumárselo al precio de apertura de la barra actual y la entrada se producirá cuando el precio supere este nivel.
para determinar la entrada usamos bollinguer band y atr. des esta manera entramos al patron con volatilidad.

BOSS Smooth Stochastic-RSI And RSI Oscillators With Alerts THE BEST FOREX, BINARY OPTIONS, STOCK AND CRYPTO INDICATORS FOR TRADINGVIEW.COM
Our Smooth Stochastic RSI indicator and our RSI indicator all combined in one!
BACKGROUND AND BAR COLOR
Green=BULLISH
Yellow= NEUTRAL/TRANSITIONAL
Red= BEARISH
ALERTS
GET ALERTS FOR BULLISH AND BEARISH CROSSOVERS ON STOCHASTIC RSI
GET ALERTS WHEN RSI LINE IS GREEN AND RED

PpSignal quantiles BandIn statistics and the theory of probability, quantiles are cutpoints dividing the range of a probability distribution into contiguous intervals with equal probabilities, or dividing the observations in a sample in the same way. There is one less quantile than the number of groups created. Thus quartiles are the three cut points that will divide a dataset into four equal-size groups (cf. depicted example). Common quantiles have special names: for instance quartile, decile (creating 10 groups: see below for more). The groups created are termed halves, thirds, quarters, etc., though sometimes the terms for the quantile are used for the groups created, rather than for the cut points. q-Quantiles are values that partition a finite set of values into q subsets of (nearly) equal sizes. There are q − 1 of the q-quantiles, one for each integer k satisfying 0 < k < q. In some cases the value of a quantile may not be uniquely determined, as can be the case for the median (2-quantile) of a uniform probability distribution on a set of even size. Quantiles can also be applied to continuous distributions, providing a way to generalize rank statistics to continuous variables. When the cumulative distribution function of a random variable is known, the q-quantiles are the application of the quantile function (the inverse function of the cumulative distribution function) to the values {1/q, 2/q, …, (q − 1)/q}

PpSignal QQE Move Average Normal VersionQQE Move Average.
The indicator QQE, is an interesting tool based on a Relative Strength Index ( RSI ). While the original RSI is often used as a pointer for overbought or oversold market phases, the QQE provides additional information. Use the QQE to display trend direction and trend strength.
in this version we convert QQE oscilator to QQE move Averague.
PpSignal QQE Normal VersionThe indicator QQE, is an interesting tool based on a Relative Strength Index ( RSI ). While the original RSI is often used as a pointer for overbought or oversold market phases, the QQE provides additional information. Use the QQE to display trend direction and trend strength.

PpSignal QQE SmoothThe indicator QQE, is an interesting tool based on a Relative Strength Index ( RSI ). While the original RSI is often used as a pointer for overbought or oversold market phases, the QQE provides additional information. Use the QQE to display trend direction and trend strength.
We smoothing the QQe signal and we added MTF options

PerPro V7 V3 STOCK AND INDICESin this version Perpro V7 is only for trade indices and stock, the algorithm only send buy signal, the bes performance is in 1h time frame, 1 day and 1 w.
you need to find the best money management for stock or indices.

Kelleys Personal EntriesThis indicator uses moving averages along with Stock and RSI to find entries. Made for higher time frames, IE 12 hour or higher

PerPro V3 We have agreed PerPro Strategy and PerPro Indicator.
Remember to use other indicators, oscillators, fibonacci levels, support, resistances, etc. to confirm entries. THIS IS NOT THE HOLY GRAIL .
We adde EMA 64 /200 and Ppsignal Nuke too.
Recommendations.
Forex:
- Graphics 5 minutes TF 60 to 240
- Graphics 60 Minutes D
- Graphics 240 D or W.
Stock
-Graphics 5 minutes Tf 120 to D
-Graphics 1 H TF D or W
-Graphics 1D W Or M
You can look for the best combination. Remember that stocks or currencies do not all move the same.

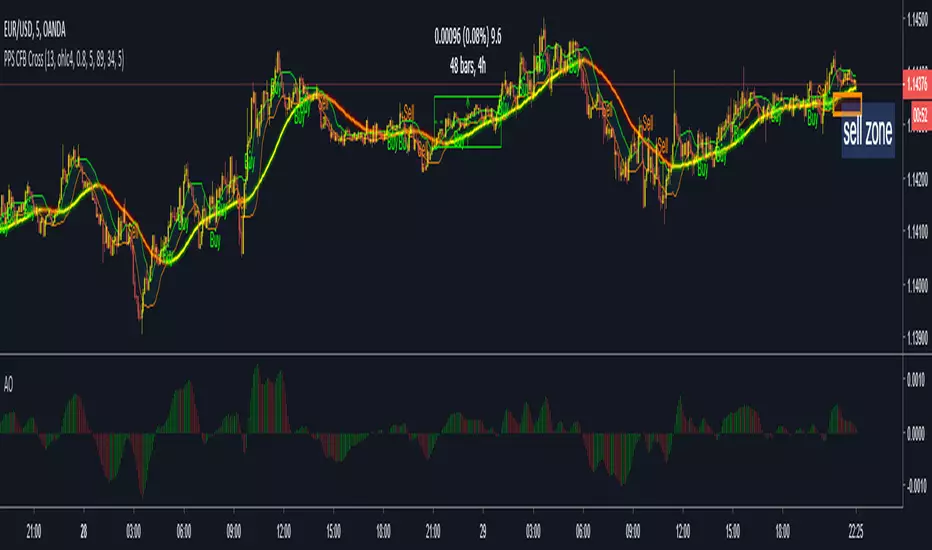
PpSignal Donchian Channels CFB and BB StrategyHere we are combine cfb with bollinger band and donichian midle line channel estrategy
This technique is for those who want the most simple method that is very effective. The best trade are during the busiest trading hours, 3am to 12am EST NY time. This method does not work in sideways markets, only in volatile trending markets.
Time Frames: 1, 5, 10, 15, 30 min.
Currency pairs: majors and btc
Essential chart indicator
-Ppsignal EWO BB, ( )
Other Chart indicators:
- Awesome Oscillator. ( )
- Optionally Add Squeeze Indicator ( )
- Bollinguer band period 13 desviation 1.
BUY SIGNAL
-Ewo above 0
-CFB crosses the middle donichian channel.
-CFB crosses ariiba from the upper band of bollinguer band.
SELL SIGNAL
- Ewo below 0
- CFB crosses below the middle channel
- CFB crosses below the signal bb.
Wath is CFB?
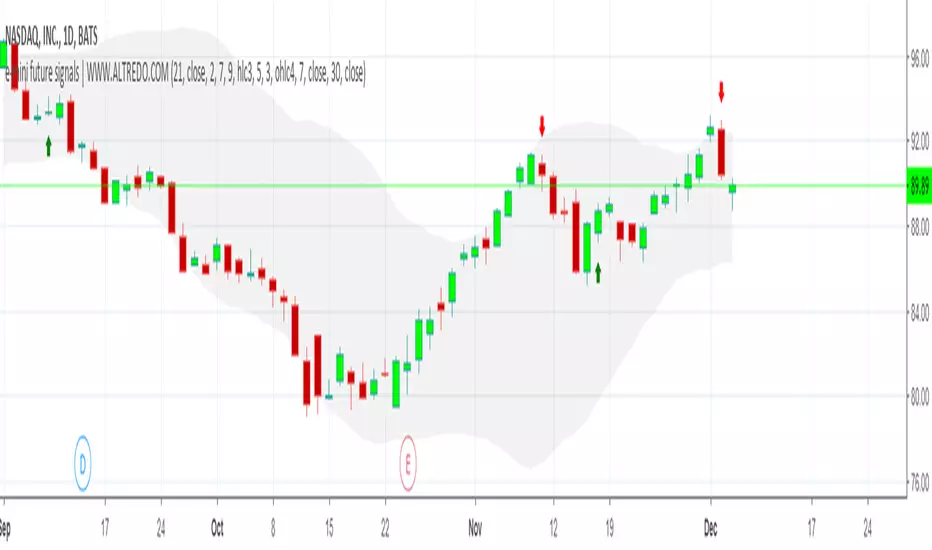
NASDAQ 1D TRADING SIGNALS | DAY TRADING SIGNALSNASDAQ 1D TRADING SIGNALS FOR SHORT-TERM AND MEDIUM-TERM TRADING!
✅ Based on trend analysis, includes Moving Average, Volatility indicators.
✅ This strategy can be used alone or alongside other strategies for better success.
✅ Real-time NASDAQ trading signals
The indicator provides an easy and fast way to determine the trend direction and possible reversals.
Green : Uptrend. Long trading
Red : Downtrend. Short trading
Stock Vn Signal Buy Sell Pro [PlungerMen]Vn Stock Signal Buy Sell Pro , mix 2 indicaror in it for exactly Signal
This Script is perfectly functional and works well by me and the best way to use this script is to use it with “Long Short" script, both compliment for each other. the "Long Short" script is Free, you can find it by searching
If you want to be more accurate and more efficient, more comfortable when you do not want to see too many other indicators, you can register for our Professional edition.
- The Professional Edition supports Level 1 and Level 2 commands ( display at chart : LONG+, long-, SHORT,+,short- ), which are very effective in allocating funds and optimizing your profits
Besides that,You will be supported by personal preferences, profit maximization -2.64% -1.30% -3.21% -3.33% -3.27% Scalping Pro and B Long Short Pro
- We will invite you to the signal channel Telgram with the announcement of the bottom and the peak of the BTC -3.11% -2.64% -1.30% -3.21% -3.33% -3.27% 0.60% -0.13% ,the big variable variable has exists
**We hope you enjoy this script. Your support will help us develop more good quality scripts in the future to serve the community **
**Remember, Like this script and posivite feedback if you are satisfied**
if you have any questions, post a comment ... below here
*********** Guide:
+ option for all frames : Click setting and input high and low for time inteval
+ hide wave trend : Click setting -> click Style --> Up trend Fill or Down trend fill
******
New features: this time we add two lines that can help traders trader safer. When the red line cross above the green line means we are in the downtrend and when the green line cross above the red line, which means we are in a uptrend. This new features will help traders do a safer trade at small time frame.
We have the Script free for the user pass, search keyword " Vn Stock Signal Buy Sell Pro "
-->> 0.2 eth/1 month will be used Script: Vn Stock Signal Buy Sell Pro Pro an Super Bot alert telegram <--
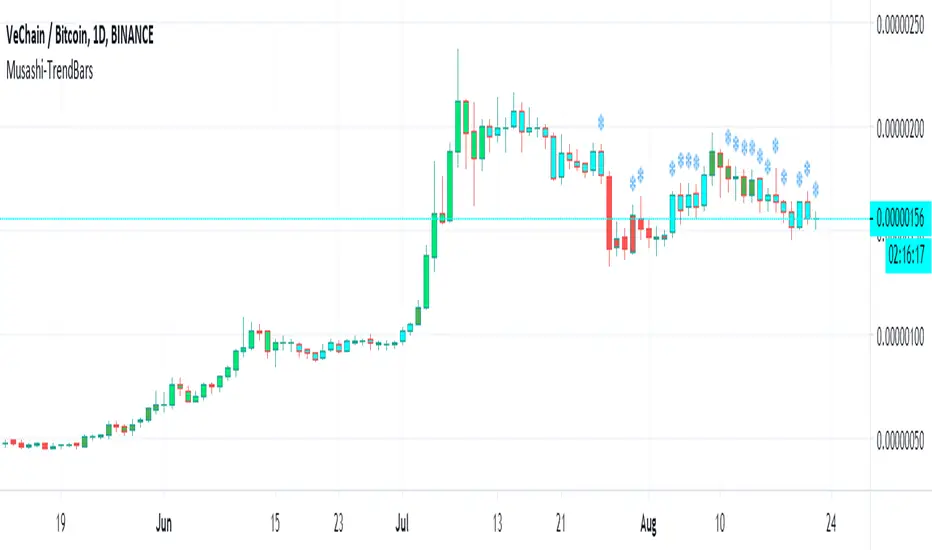
Musashi-TrendBarsThis is a script that has a unique approach to trending. This offers a multi-phase concept of trending, which is shown by a multitude of colors. This non-repainting indicator will predict the phases of trend change and progression. This script is under research at this point, and is considered an alpha version.
LEGAL STUFF:
Risk Disclosure
Futures , forex, stock, crypto and derivative trading contains substantial risk and is not for every investor. An investor could potentially lose all or more than the initial investment. Risk capital is money that can be lost without jeopardizing ones’ financial security or life style. Only risk capital should be used for trading and only those with sufficient risk capital should consider trading. Past performance is not necessarily indicative of future results
Hypothetical Performance Disclosure
Hypothetical performance results have many inherent limitations, some of which are described below. no representation is being made that any account will or is likely to achieve profits or losses similar to those shown; in fact, there are frequently sharp differences between hypothetical performance results and the actual results subsequently achieved by any particular trading program. One of the limitations of hypothetical performance results is that they are generally prepared with the benefit of hindsight. In addition, hypothetical trading does not involve financial risk, and no hypothetical trading record can completely account for the impact of financial risk of actual trading. for example, the ability to withstand losses or to adhere to a particular trading program in spite of trading losses are material points which can also adversely affect actual trading results. There are numerous other factors related to the markets in general or to the implementation of any specific trading program which cannot be fully accounted for in the preparation of hypothetical performance results and all which can adversely affect trading results
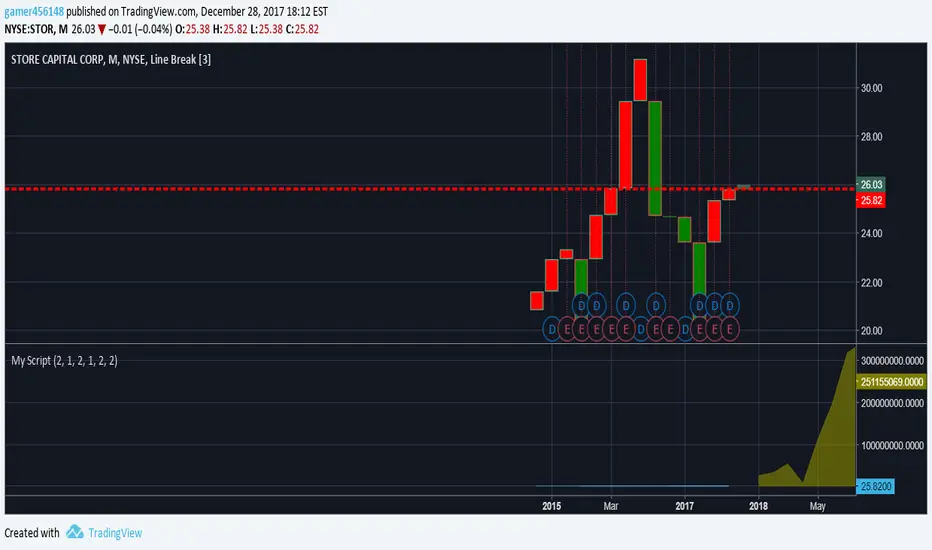
Stock Analysis IndicatorThis is a script for a line break study that includes my Accumulation/Distribution views, and utilizes the Alice study from Benjamin Lupton's repo. Also included is an SWMA moving average strategy, set bar resistance and color options. This is best utilized for predicting the rise of stocks post market as well as chart views for predictive analysis. This is one of the things I am building as a newbie to pinescript, so still improvements to be made. Use this indicator as an extension to your own strategy or custom chart views.
<50% Body CandleScript to identify candlesticks with less than 50% body of total high low candlestick. Places a dot inside the candle. Make sure indicator is moved in the top of Objects Tree so the dot will not be hidden behind the candlebar.
