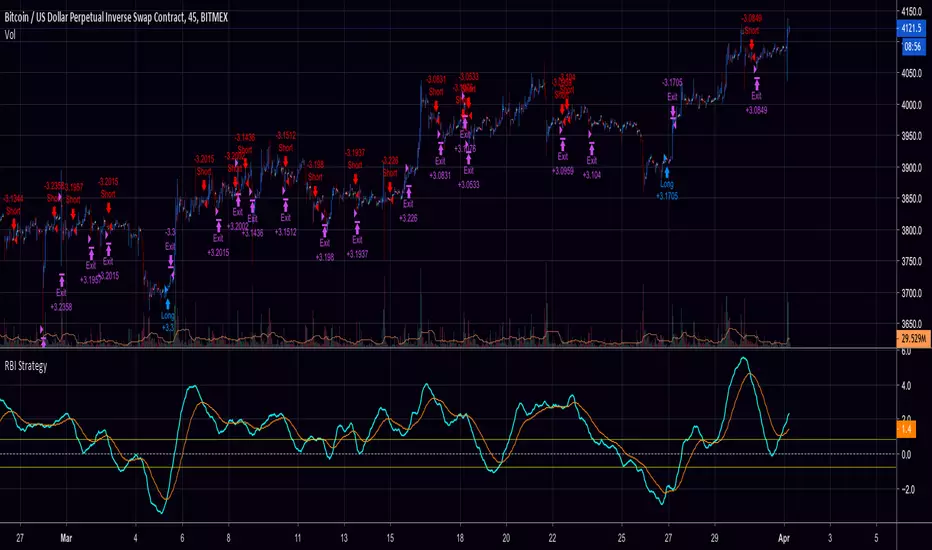
RBI Strategy /w TSSLThis is the Strategy with Backtest Date Range and Trailing Stop / Stop-Loss to vitelot's RBI indicator:
Strategy!
Al Po's Semaphore Trading StrategySemaphore Trading Strategy designed especially to test my day trading indicator that is right now in development
Conclusion: it is clearly better to trade with this indicator manually

[astropark - Premium] 5m Bitmex ScalperThis strategy is private for bitmex scalping on 5m - 15m.
News soon.
Thanks
-- astropark --

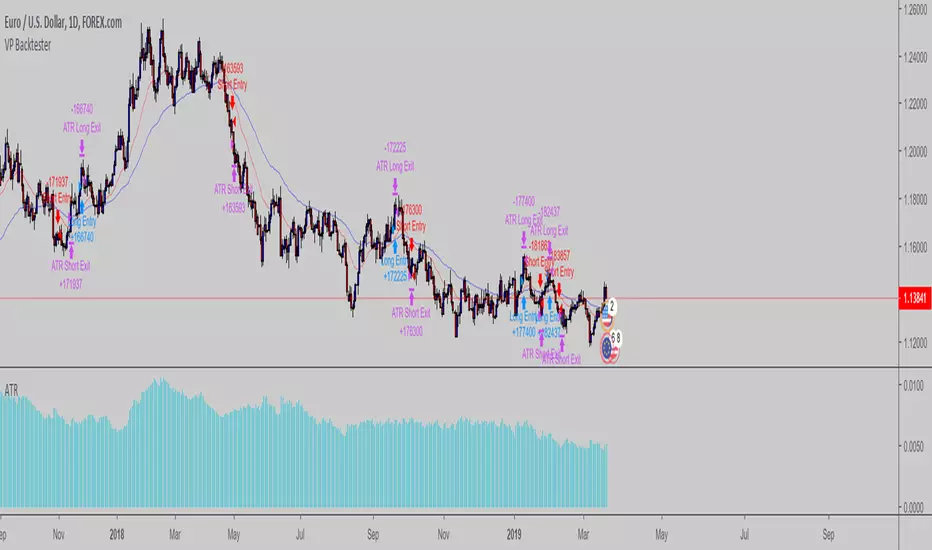
VP Backtester skeletonSimple backtesting skeleton script which uses ATR based stop & profit targets based on the no-nonsense forex way of trading
Icarus v2 [STRATEGY] - by @cryptomrdavis -This is the strategy version from the Icarus v2 indicator
Happy trading
+++ use this tool on your own risk. i'm not responsible for your loses. DYOR +++
____________________________________________________________________________
BTC: 1GVRDK3HHr9CKM5SF2CGpCNXFuavB3L4j9
ETH: 0x7b825fa752b9926D3E8397cDb1d9E5473D074646
XLM: GAXUQJSW55C7MAC4GI26NZUGIKSHFDVFRFKZCXPLMPY4HCADSDT55XK6
BCH: qz57n04ud6mn42u00aymqkku8tfh0lk4jv9c28mjvv
tippin.me
____________________________________________________________________________

MA cross strategyThis strategy uses simple moving average cross for entry signals, but it can be customized with 3 cases:
1- exit at take profit and stop loss;
2- exit when distance between close and moving average is above a user defined minimum;
3- use Renko candles to calculate the moving average without changing the graph candles.
The third case is the one with better results, but for non-pro users can be used only with daily time frame.
Look at profit factor and percent of winning trades.
You can test also on your favorite pair, but most important is setting correct brick size.
At request, I could share also a screener with alarms for finding which symbol statisfy entry rules.
Please use comment section for any feedback.
********************************** IMPORTANT*******************************
I have developed an expert advisor for metatrader4 (MT4): results of expert advisor form 2015-01-01 to today are very good with low drawdown and good profit.
********************************************************************************

SAR+RSI Strategy by cryptoторговая стратегия подходит, как для торговли внутри дня, так и для скальпа и замечательно ловит трендовые движения. конечно для более разумного использования нужны еще два индикатора, но они есть в общем доступе и я могу лишь поддсказать на что нужно обратить внимание. всем кто желает получить доступ пишите в телеграмм @JohnnieWallker

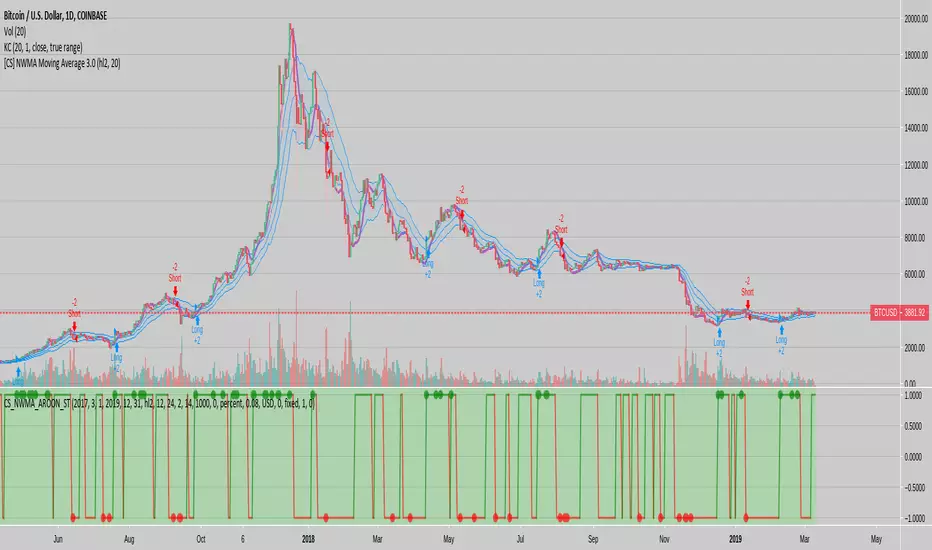
NWMA Aroon IFT Strategy applied to 2-years timeframe BTCThis is a two year strategy return of our 2-year strategy inspired to Manfred G. Dürschner Aroon-Oscillator-IFT-NWMA Trading System .
Even if our strategy is similar, Fast and Short NWMA MA crossover is specifically tuned from the original paper and we used an additional Force Filter and exit method.
Our opensource NWMA implementation in Pine Script is here (with references to Dürschne's original paper):
From the paper original paper:
The indicator is the Aroon-Oscillator (AO) , which is defined as the difference between the Aroon up and Aroon down .
The AO is not applied to a price series but to a NWMA applied to the price series: NWMA .
Cycle periods for the NWMA are n1 = 89 days and n2 = 21 days (λ = 4.2).
Cycle period for the AO is 5 days: AO .
An Inverse Fisher Transformation (IFT) is applied to the AO: IFT .
The IFT digitizes the AO witout lag.
Settings: Buy IFT > 0, sell IFT < 0 .
Note: this strategy takes as a reference Coinbase prices and takes long and short positions even if standard Coinbase does not allow the opening of short positions.
Coinbase was chosen because price series is more consistent and less prone to statistical flukes and flash crashes.
This strategy is Invite only, hope you enjoy
CryptoStatistical
[STRATEGY] MA Strategy Intraday - @CryptoNTezSimple & profitable Moving average Strategy.
Parameters are customizable.
Happy trading!

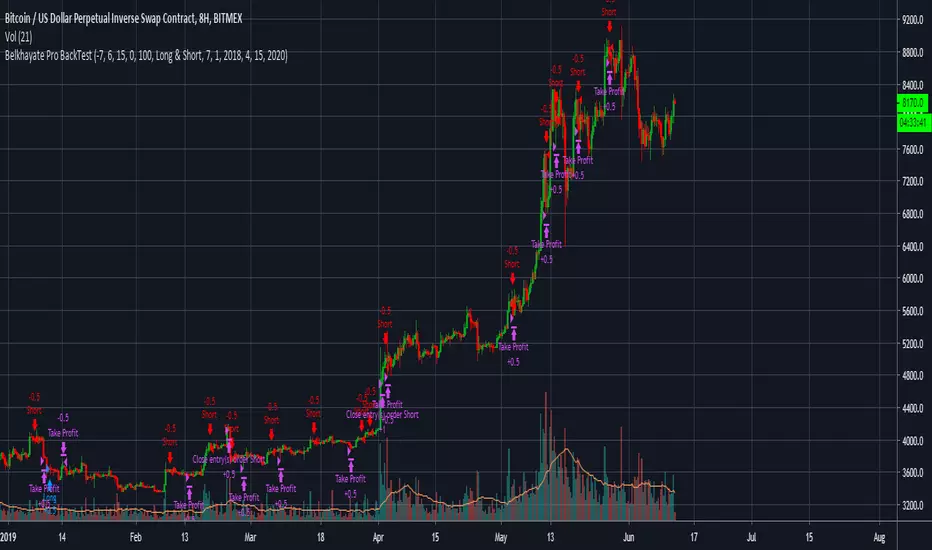
Belkhayate Pro BackTestHello Fellow Traders!
-------------------------------------------
This is the newest addition to Gnome Alerts PRO!
This Bot Script works on all Crypto, Leverage, Forex, & Traditional Exchanges.
FEATURES
------------------------
*Autoview Ready*
- Easy to Use
- Backtesting Included |
-Take Profit
- Stop Loss
Learn more by visiting my bio.
Strategy designed for NG 15min-1h timeframeHi guys I hope you like the strategy I made today for NG futures contract trading. 15m and 1h recommended timeframes.
Let me your comments if it works to you

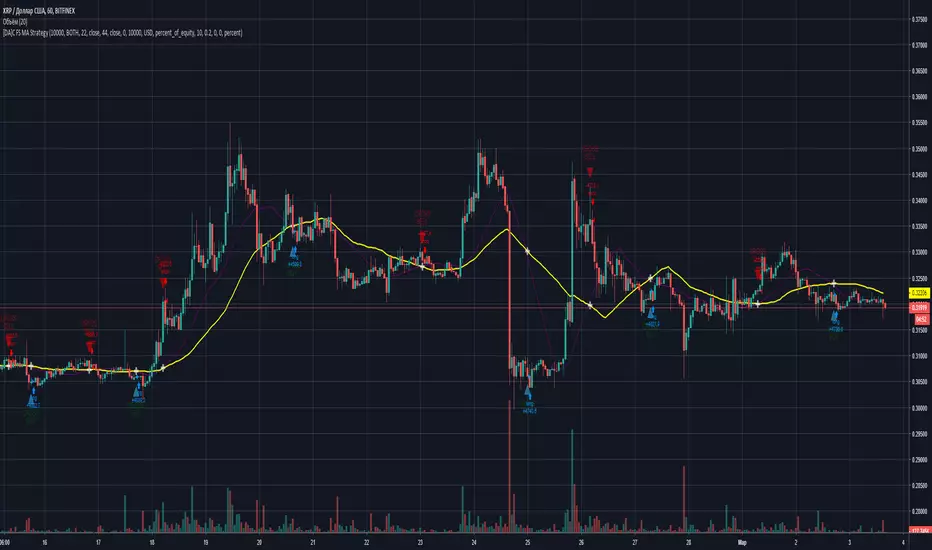
[DA]Cross Fast Slow MA StrategyThis script is for testing moving averages. Recommended settings are set by default and timeframe 12 hour.
RSI-ATR Divine Strategy (Backtesting)Live, non-repainting strategy using ATR and RSI mixed together to multiple types of long and short positions.
- Features -
Live entry direction with trade warnings and alerts
Live trade building buy and sell stops (for buy/sell stop limits)
Entry location icons as well as pyramid entries (to add to existing position)
2 separate targets based on the ATR setting and entry location
1 scalp target based on the ATR setting and entry location
2 separate trailing stops, 1 for "absolute stop" and 1 for "scalp trades"
Alert conditions for every update and condition change of the strategy (Provided by indicator study )
4 pre-built color themes, including candlestick coloring
This strategy is best used with my RSI Shaded Indicator using the identical RSI settings.
The linked script is identical and used solely for alerts, because Trading View still after 3 years of requesting does not provide the ability to use alert conditions inside a strategy script, only an indicator script. This strategy should be used to backtest your settings.
The approach to this strategy uses several parallel trades of different types. In order to generate multiple trade types the "pyramid trades" setting of the strategy (second tab of the settings that lets you adjust the number of pyramid contracts) should be used.
- Trade Types -
Swing: This trade is entered on the solid arrows after the RSI has become oversold or overbought. It is key that all trades wait for some degree of pullback before entering, even after the trend flips between positive and negative. This trade is held until stopped out or an opposite trade is triggered that reverses the position.
Target: These trades are entered at both the initial swing trade, or any subsequent pyramid/greedy trades that present themselves along the way while the trend remains in the same direction. The difference between these trades and the swing trade is that they have targets calculated as: Target = +/- * ATR. Until the target price is reached it does not change. When exceeded the next target trade will have a new target price.
Scalp: These trades have a limit buy/sell entry and a target. The target is very similar to the ATR Multiplier calculation for Target trades, but uses the instead.
Turning on/off the different trade types (strategy only) is simple done by decreasing the number of contracts used for that trade type to zero. When the quantity is set to zero, that trade is not considered.
- Session -
The session filter is used to narrow trade executions by only allowing trades that are inside the session boundaries. This can be used to isolate the London or New York session for example. The default is 24 x 7 which filters no trades (Trading View has a bug when resetting this, so simply reset the indicator to get it back to 24x7).
All feature requests or bug reports are welcome either by direct messaging or comments on this page or the linked indicator page.
Please PM for access. Cheers.

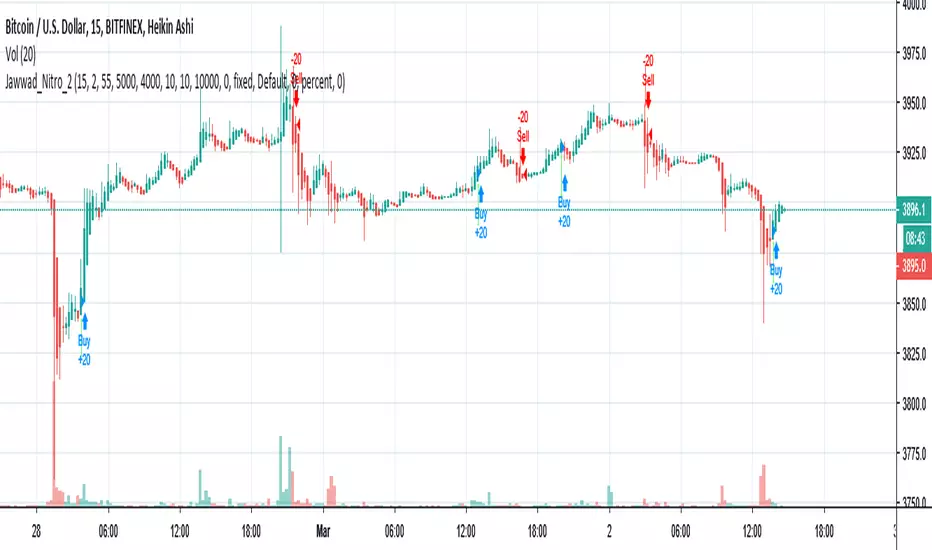
Jawwad Nitro_2 Crypto Forex Strategy - Highly ProfitableThis strategy is tested on selected crypto and forex pairs. It seems to be highly profitable and non-repainting. You can make some good money until you are following it properly and not playing with the settings.
1. Use 15 minute Heiken-ashi chart.
2. Apply the strategy.
3. Enjoy!!!
If this strategy works for you, please don't forget to buy me a cup of coffee... If you find anything wrong, please let me know. I shall be happy to fix it for you.
Cheers,
Jawwad
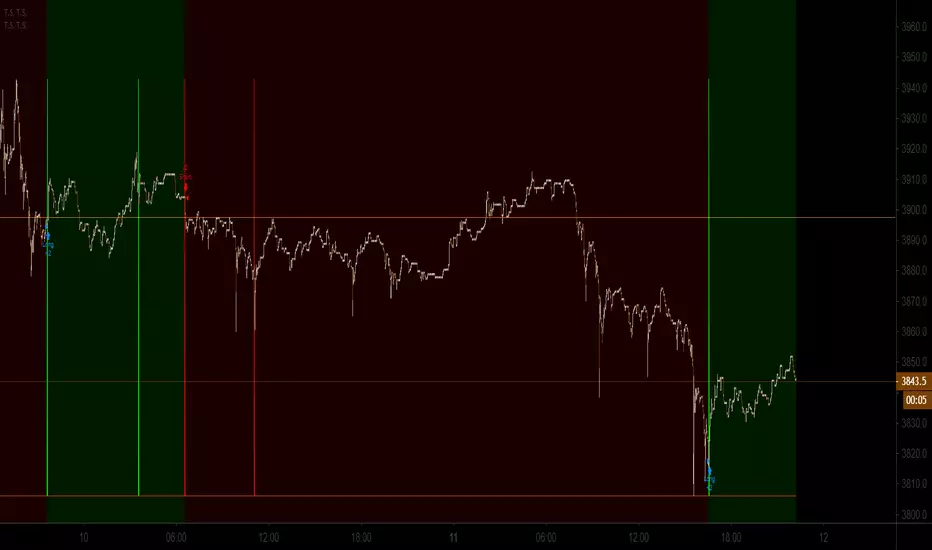
Trader Set - Trading SignalDON'T EVEN ASK FOR ACCESS !!!!
This is the result of years of experience, combination of multi strategy / condition techniques.
The result talks for itself.
If it works on Bitmex, it'll work everywhere !
Soon will use it outside of trading view and will give info on how you can use this in comment section.
The purple markers are liquid place with leverage 10 when the price goes against the signal. Here are the results :
1- You can't find a trade that WON'T pass commissions of both side taker fee on Bitmex ! (2* 0.075 = 0.15%)
2- There is absolutely 0 losing trade !!!!
3- The system fixes it's bad signals soon enough and even those signal fixing passes the commissions first !
The result on the published script is not accurate because I chose hourly chart so that you can see all the trades in one picture. Not sure how trading view calculates those results, but as you see in the picture, I marked all the trades, no looser.
Setting the time frame on 15 minute shows the accurate result !
prntscr.com
For lazy guys, here is what you can see on the linked picture :
Net Profit : 8.07 %
Total Closed Trades : 26
Percent Profitable : 100 !!!!
Max Drawdown : 0 !!!!
Avg Trade : 0.31%
Avg Bars in Trades : 418
This is a money making machine.
Again : DON'T EVEN ASK FOR ACCESS !!!!
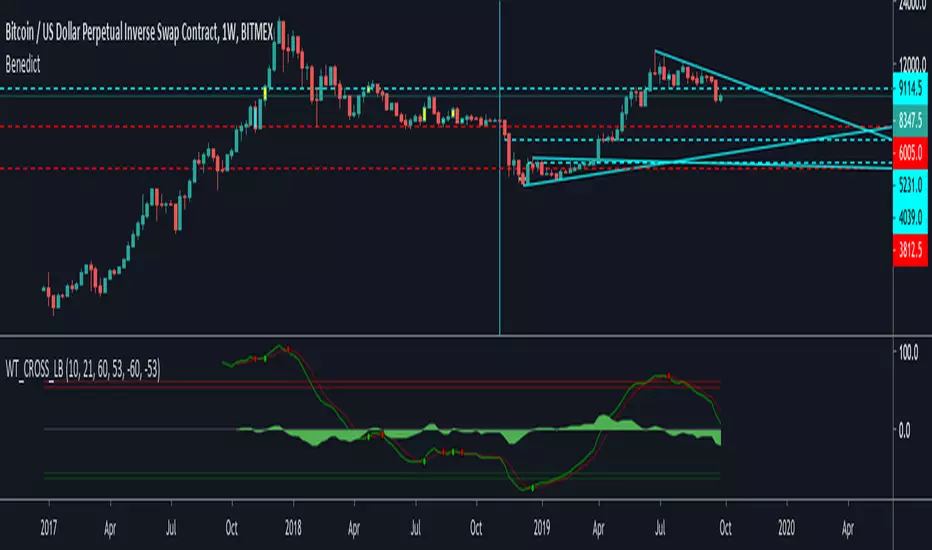
+1200% Mr. Benedict ETH/USD 2H Strategie öffentlichDies ist eine Probe des Mr. Benedict ETH/USD 2H Bot.
Diese Strategie wurde nur für ETH/USD 2H entwickelt und sollte nur dort angewendet werden.
COINBASE:ETHUSD
Es kann frei am Zeitraum herumgestellt werden, um vergangene Ergebnisse zu überprüfen.
Ergebnis in 2018 ist zum Beispiel 1200%
Für den Kurs sollte Coinbase genutzt werden, da Bitmex erst Daten seit August 2018 hat und Bitfinex falsche Ergebnisse erzeugt.
Die Strategie geht von einer Investition von 100% des Kapitals aus und Gebühren sind bereits abgezogen (0,075% Bitmex)

Scalping Grid at Pivot Point FibonacciThis strategy sets a grid of stop orders once price touch one Fibonacci weekly pivots.
This works very well for scalping as the price touch a pivot level.
Take care when you work with grids because drawdown could be very high.
Study with alarms is available at request.
Please use comment section for any feedback.
Next improvement (only to whom is interested to this script and follows me): study with alerts on multiple tickers all at one. Leave a comment if you want to have access to study.
********************************** IMPORTANT*******************************
I have developed an expert advisor for metatrader4 (MT4) and for jforex platform: results of expert advisor form 2015-01-01 to 2018-11-25 are very good with low drawdown and good profit.
********************************************************************************

MACD Enhanced Strategy MTF with Stop Loss [LTB]I developed this script to analyse MACD, MACD Signal, MACD Histogram movements by using current and higher time frame. Script calculates higher time frame automatically, no manuel entry. I also added trailing stop loss line. You can change the parameters as you wish ;)
btw. you should know that MACD is more successful when there is trend.
If you like it please comment and check out my other scripts.

Fisher Transform Multi-Timeframe (Backtest)This is the Backtest Strategy for mortdiggiddy's "Fisher Transform Multi-Timeframe"
For more details check his study:

13utc EUR/USD TariHi guys,
this new strategy is on 1hr chart eur/usd.
It's very easy to follow, becuase you will get 1 signal at 13Utc (1pm utc)
You have only to set Stop Loss @50 and Take Profit@60 (pips not ticks!), but to avoid mistakes green or red lines will appear on the chart to have a better view of Sl and TP.
So, what more? Nothing! Subscribe!
Enjoy your Wallet!
Tari.

El Tangonator StrategyStrategy for my El Tangonator indicator. Optimized for Bitmex XBTUSD 4h chart. It includes pointers for entry, target and stop loss.
Available only to TRI members.

Ichimoku trendfollowingIchimoku più che un indicatore potrebbe essere considerato un sistema di trading.
Ho quindi voluto implementare una strategia che utilizzasse soltanto i segnali che offre per l'ingresso ed uscita per verificarne l'efficacia nel lungo periodo su i diversi strumenti.
I segnali che offre sono i seguenti:
1) il prezzo taglia la tenkan (segnale molto debole per un ingresso)
2) il prezzo taglia la kijun (possibile trade in controtrend fino alla kumo)
3) tenkan incrocia la linea kijun
4) uscita della linea chikou span dal prezzo: se la linea è sotto il prezzo valutare solo short, se sopra valutare solo long, se sopra il prezzo si è in correzione ed è meglio restare flat
5) prezzo entra dentro la kumo. (Non si entra in posizione dentro la kuno)
6) la kumo cambia colore (conferma direzione del trend in atto)
7) uscita dal prezzo dalla kumo
8) uscita della tenkan dalla kumo (conferma situazione)
9) uscita kijun dalla kumo (conferma situazione)
10) trend in corso con chiusura del prezzo fra la chikou span da una parte, tenkan, kijun e kumo dall'altra.
Ichimoku è solitamente utilizzato come sistema trendfollowing, quindi considererò solo i segenti possibili ingressi:
1) breakout kumo (inizio trend di lungo periodo)
2) pullback (inizio trend di medio periodo o ripresa trend dopo correzione profonda con pullback su kumo)
le uscite tradizionali sono:
1) prezzo chiude sotto la kijun
2) SL inizialmente su minimo candela che rompe il livello
Filtri da applicare ai singoli ingressi:
Filtro long:
Close>kumo and chikou span > prezzo corrispondente and
Filtro short
Close
