3x Supertrend (for Vietnamese stock market and vn30f1m)The 4Vietnamese 3x Supertrend Strategy is an advanced trend-following trading system developed in Pine Script™ and designed for publication on TradingView as an open-source strategy under the Mozilla Public License 2.0. This strategy leverages three Supertrend indicators with different ATR lengths and multipliers to identify optimal trade entries and exits while dynamically managing risk.
Key Features:
Option to build and hold long term positions with entry stop order. Try this to avoid market complex movement and retain long term investment style's benefits.
Advanced Entry & Exit Optimization: Includes configurable stop-loss mechanisms, pyramiding, and exit conditions tailored for different market scenarios.
Dynamic Risk Management: Implements features like selective stop-loss activation, trade window settings, and closing conditions based on trend reversals and loss management.
This strategy is particularly suited for traders seeking a systematic and rule-based approach to trend trading. By making it open-source, we aim to provide transparency, encourage community collaboration, and help traders refine and optimize their strategies for better performance.
License:
This script is released under the Mozilla Public License 2.0, allowing modifications and redistribution while maintaining open-source integrity.
Happy trading!
Strategy!

Twitter Model ICT [TradingFinder] MMXM ERL D + FVG + M15 MSS/SMT🔵 Introduction
The Twitter Model ICT is a trading approach based on ICT (Inner Circle Trader) models, focusing on price movement between external and internal liquidity in lower timeframes. This model integrates key concepts such as Market Structure Shift (MSS), Smart Money Technique (SMT) divergence, and CISD level break to identify precise entry points in the market.
The primary goal of this model is to determine key liquidity levels, such as the previous day’s high and low (PDH/PDL) and align them with the Fair Value Gap (FVG) in the 1-hour timeframe. The overall strategy involves framing trades around the 1H FVG and using the M15 Market Structure Shift (MSS) for entry confirmation.
The Twitter Model ICT is designed to utilize external liquidity levels, such as PDH/PDL, as key entry zones. The model identifies FVG in the 1-hour timeframe, which acts as a magnet for price movement. Additionally, traders confirm entries using M15 Market Structure Shift (MSS) and SMT divergence.
Bullish Twitter Model :
In a bullish setup, the price sweeps the previous day’s low (PDL), and after confirming reversal signals, buys are executed in internal liquidity zones. Conversely, in a bearish setup, the price sweeps the previous day’s high (PDH), and after confirming weakness signals, sells are executed.
Bearish Twitter Model :
In short setups, entries are only executed above the Midnight Open, while in long setups, entries are taken below the Midnight Open. Adhering to these principles allows traders to define precise entry and exit points and analyze price movement with greater accuracy based on liquidity and market structure.
🔵 How to Use
The Twitter Model ICT is a liquidity-based trading strategy that analyzes price movements relative to the previous day’s high and low (PDH/PDL) and Fair Value Gap (FVG). This model is applicable in both bullish and bearish directions and utilizes the 1-hour (1H) and 15-minute (M15) timeframes for entry confirmation.
The price first sweeps an external liquidity level (PDH or PDL) and then provides an entry opportunity based on Market Structure Shift (MSS) and SMT divergence. Additionally, the entry should be positioned relative to the Midnight Open, meaning long entries should occur below the Midnight Open and short entries above it.
🟣 Bullish Twitter Model
In a bullish setup, the price first sweeps the previous day’s low (PDL) and reaches an external liquidity level. Then, in the 1-hour timeframe (1H), a bullish Fair Value Gap (FVG) forms, which serves as the price target.
To confirm the entry, a Market Structure Shift (MSS) in the 15-minute timeframe (M15) should be observed, signaling a trend reversal to the upside. Additionally, SMT divergence with correlated assets can indicate weakness in selling pressure.
Under these conditions, a long position is taken below the Midnight Open, with a stop-loss placed at the lowest point of the recent bearish move. The price target for this trade is the FVG in the 1-hour timeframe.
🟣 Bearish Twitter Model
In a bearish setup, the price first sweeps the previous day’s high (PDH) and reaches an external liquidity level. Then, in the 1-hour timeframe (1H), a bearish Fair Value Gap (FVG) is identified, serving as the trade target.
To confirm entry, a Market Structure Shift (MSS) in the 15-minute timeframe (M15) should form, signaling a trend shift to the downside. If an SMT divergence is present, it can provide additional confirmation for the trade.
Once these conditions are met, a short position is taken above the Midnight Open, with a stop-loss placed at the highest level of the recent bullish move. The trade's price target is the FVG in the 1-hour timeframe.
🔵 Settings
Bar Back Check : Determining the return of candles to identify the CISD level.
CISD Level Validity : CISD level validity period based on the number of candles.
Daily Position : Determines whether only the first signal of the day is considered or if signals are evaluated throughout the entire day.
Session : Specifies in which trading sessions the indicator will be active.
Second Symbol : This setting allows you to select another asset for comparison with the primary asset. By default, "XAUUSD" (Gold) is set as the second symbol, but you can change it to any currency pair, stock, or cryptocurrency. For example, you can choose currency pairs like EUR/USD or GBP/USD to identify divergences between these two assets.
Divergence Fractal Periods : This parameter defines the number of past candles to consider when identifying divergences. The default value is 2, but you can change it to suit your preferences. This setting allows you to detect divergences more accurately by selecting a greater number of candles.
The indicator allows displaying sessions based on various time zones. The user can select one of the following options :
UTC (Coordinated Universal Time)
Local Time of the Session
User’s Local Time
Show Open Price : Displays the New York market opening price.
Show PDH / PDL : Displays the previous day’s high and low to identify potential entry points.
Show SMT Divergence : Displays lines and labels for bullish ("+SMT") and bearish ("-SMT") divergences.
🔵 Conclusion
The Twitter Model ICT is an effective approach for analyzing and executing trades in financial markets, utilizing a combination of liquidity principles, market structure, and SMT confirmations to identify optimal entry and exit points.
By analyzing the previous day’s high and low (PDH/PDL), Fair Value Gaps (FVG), and Market Structure Shift (MSS) in the 1H and M15 timeframes, traders can pinpoint liquidity-driven trade opportunities. Additionally, considering the Midnight Open level helps traders avoid random entries and ensures better trade placement.
By applying this model, traders can interpret market movements based on liquidity flow and structural changes, allowing them to fine-tune their trading decisions with higher precision. Ultimately, the Twitter Model ICT provides a structured and logical approach for traders who seek to trade based on liquidity behavior and trend shifts in the market.

Statistical Arbitrage Pairs Trading - Long-Side OnlyThis strategy implements a simplified statistical arbitrage (" stat arb ") approach focused on mean reversion between two correlated instruments. It identifies opportunities where the spread between their normalized price series (Z-scores) deviates significantly from historical norms, then executes long-only trades anticipating reversion to the mean.
Key Mechanics:
1. Spread Calculation: The strategy computes Z-scores for both instruments to normalize price movements, then tracks the spread between these Z-scores.
2. Modified Z-Score: Uses a robust measure combining the median and Median Absolute Deviation (MAD) to reduce outlier sensitivity.
3. Entry Signal: A long position is triggered when the spread’s modified Z-score falls below a user-defined threshold (e.g., -1.0), indicating extreme undervaluation of the main instrument relative to its pair.
4. Exit Signal: The position closes automatically when the spread reverts to its historical mean (Z-score ≥ 0).
Risk management:
Trades are sized as a percentage of equity (default: 10%).
Includes commissions and slippage for realistic backtesting.

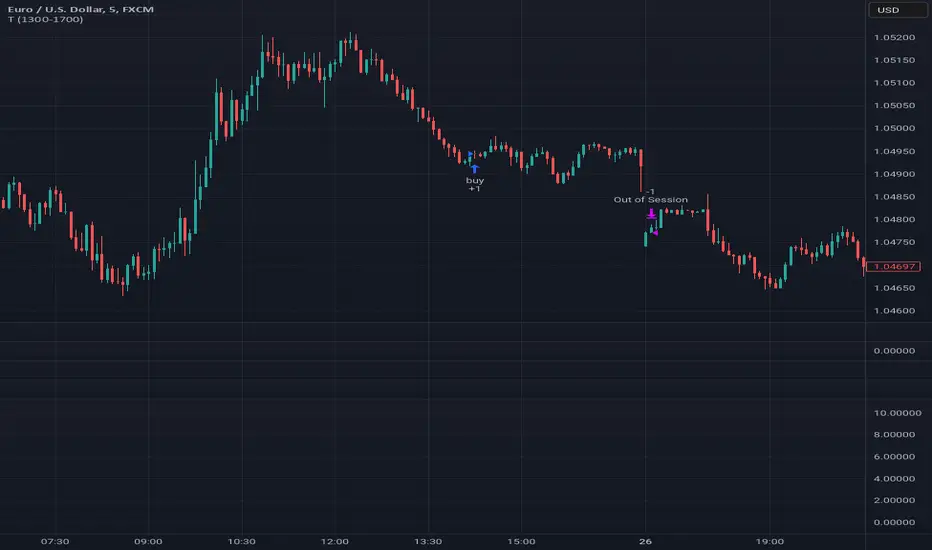
Tutorial - Adding sessions to strategiesA simple script to illustrate how to add sessions to trading strategies.
In this interactive tutorial, you'll learn how to add trading sessions to your strategies using Pine Script. By the end of this session (pun intended!), you'll be able to create custom trading windows that adapt to changing market conditions.
What You'll Learn:
Defining Trading Sessions: Understand how to set up specific time frames for buying and selling, tailored to your unique trading style.
RSI-Based Entry Signals: Discover how to use the Relative Strength Index (RSI) as a trigger for buy and sell signals, helping you capitalize on market trends.
Combining Session Logic with Trading Decisions: Learn how to integrate session-based logic into your strategy, ensuring that trades are executed only during designated times.
By combining these elements, we create an interactive strategy that:
1. Generates buy and sell signals based on RSI levels.
2. Checks if the market is open during a specific trading session (e.g., 1300-1700).
3. Executes trades only when both conditions are met.
**Tips & Variations:**
* Experiment with different RSI periods, thresholds, and sessions to optimize your strategy for various markets and time frames.
* Consider adding more advanced logic, such as stop-losses or position sizing, to further refine your trading approach.
Get ready to take your Pine Script skills to the next level!
~Description partially generated with Llama3_8B
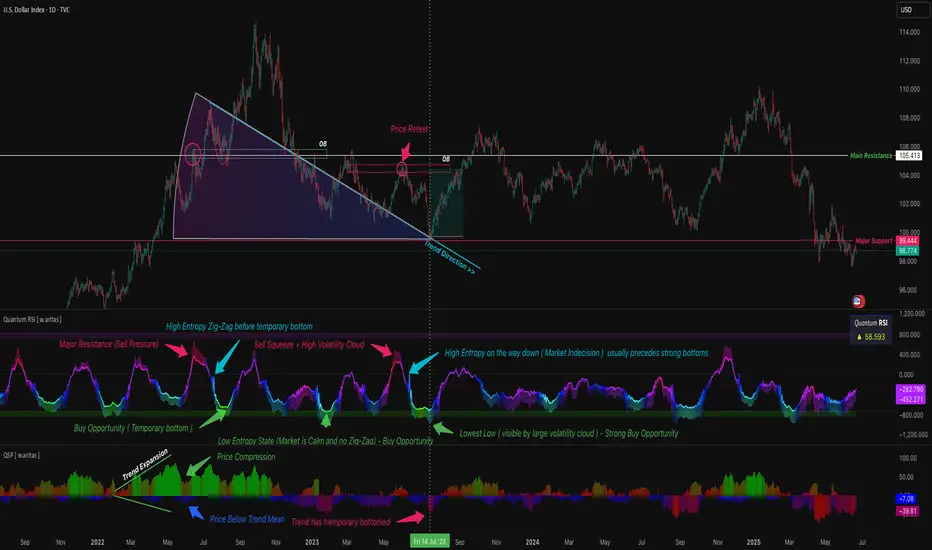
QT RSI [ W.ARITAS ]The QT RSI is an innovative technical analysis indicator designed to enhance precision in market trend identification and decision-making. Developed using advanced concepts in quantum mechanics, machine learning (LSTM), and signal processing, this indicator provides actionable insights for traders across multiple asset classes, including stocks, crypto, and forex.
Key Features:
Dynamic Color Gradient: Visualizes market conditions for intuitive interpretation:
Green: Strong buy signal indicating bullish momentum.
Blue: Neutral or observation zone, suggesting caution or lack of a clear trend.
Red: Strong sell signal indicating bearish momentum.
Quantum-Enhanced RSI: Integrates adaptive energy levels, dynamic smoothing, and quantum oscillators for precise trend detection.
Hybrid Machine Learning Model: Combines LSTM neural networks and wavelet transforms for accurate prediction and signal refinement.
Customizable Settings: Includes advanced parameters for dynamic thresholds, sensitivity adjustment, and noise reduction using Kalman and Jurik filters.
How to Use:
Interpret the Color Gradient:
Green Zone: Indicates bullish conditions and potential buy opportunities. Look for upward momentum in the RSI plot.
Blue Zone: Represents a neutral or consolidation phase. Monitor the market for trend confirmation.
Red Zone: Indicates bearish conditions and potential sell opportunities. Look for downward momentum in the RSI plot.
Follow Overbought/Oversold Boundaries:
Use the upper and lower RSI boundaries to identify overbought and oversold conditions.
Leverage Advanced Filtering:
The smoothed signals and quantum oscillator provide a robust framework for filtering false signals, making it suitable for volatile markets.
Application: Ideal for traders and analysts seeking high-precision tools for:
Identifying entry and exit points.
Detecting market reversals and momentum shifts.
Enhancing algorithmic trading strategies with cutting-edge analytics.
CHAKRA RISS ENGULFING CANDLESTICK STRATEGYChakra RISS Engulfing Candlestick Strategy
Type: Technical Indicator & Strategy
Platform: TradingView
Script Version: Pine Script v6
Overview:
The Chakra RISS Engulfing Candlestick Strategy combines a momentum-based approach using the Relative Strength Index (RSI) with Engulfing Candlestick Patterns to generate buy and sell signals. The strategy filters trades based on price movement relative to a 50-period Simple Moving Average (SMA), making it a trend-following strategy.
The indicator uses color-coded bars to visually represent market conditions, helping traders easily identify bullish and bearish trends. The strategy is designed to be dynamic, adapting to changing market conditions and filtering out noise using key technical indicators.
How It Works:
RSI-Based Color Conditions:
Green Bars: When the RSI crosses above a specified UpLevel (default: 50), indicating a bullish momentum and signaling potential buy conditions.
Red Bars: When the RSI crosses below a specified DownLevel (default: 50), indicating a bearish momentum and signaling potential sell conditions.
Buy Signal:
Triggered when the following conditions are met:
RSI crosses from below the UpLevel (default: 50) to above it, signaling increasing bullish momentum.
The close price is above the 50-period Simple Moving Average (SMA), confirming an uptrend.
The Buy Signal is plotted below the bar with a green arrow and a "BUY" label.
Sell Signal:
Triggered when the following conditions are met:
RSI crosses from above the DownLevel (default: 50) to below it, signaling increasing bearish momentum.
The close price is below the 50-period Simple Moving Average (SMA), confirming a downtrend.
The Sell Signal is plotted above the bar with a red arrow and a "SELL" label.
Stop Loss and Take Profit:
For long trades (buy signals), the stop loss is placed below the previous bar's low, and the take profit is set at 3% above the entry price.
For short trades (sell signals), the stop loss is placed above the previous bar's high, and the take profit is set at 3% below the entry price.
Dynamic Bar Coloring:
The bar colors change dynamically based on RSI levels:
Green Bars: Indicating a potential uptrend (bullish).
Red Bars: Indicating a potential downtrend (bearish).
These visual cues help traders quickly identify market trends and potential reversals.
Trend Filtering:
The 50-period Simple Moving Average (SMA) is used to filter trades based on the overall market trend:
Buy signals are only considered when the price is above the moving average, indicating an uptrend.
Sell signals are only considered when the price is below the moving average, indicating a downtrend.
Alerting System:
Alerts can be set for both buy and sell signals. These alerts notify traders in real-time when potential trades are generated, allowing them to act promptly.
Alerts can be configured to send notifications through email, SMS, or a webhook for integration with other services like IFTTT or Zapier.
Key Features:
RSI and Moving Average-Based Signals: Combines RSI with a moving average for more accurate trade signals.
Stop Loss and Take Profit: Dynamic risk management with custom stop loss and take profit levels based on previous high and low prices.
Buy and Sell Alerts: Provides real-time alerts when a buy or sell signal is triggered.
Trend Confirmation: Uses the 50-period Simple Moving Average to filter signals and confirm the direction of the trend.
Visual Bar Color Changes: Makes it easy to identify bullish or bearish trends with color-coded bars.
Usage:
This strategy is suitable for traders who prefer a trend-following approach and want to combine momentum indicators (RSI) with price action (Engulfing Candlestick patterns). It is particularly useful in volatile markets where quick identification of trend changes can lead to profitable trades.
Best Used For: Day trading, swing trading, and trend-following strategies.
Timeframes: Works well on various timeframes, from 1-minute charts for scalping to daily charts for swing trading.
Markets: Can be applied to any market with sufficient liquidity (stocks, forex, crypto, etc.).
Settings:
UpLevel: The RSI level above which the market is considered bullish (default: 50).
DownLevel: The RSI level below which the market is considered bearish (default: 50).
SMA Length: The period of the Simple Moving Average used to filter trades (default: 50).
Risk Management: Customizable stop loss and take profit settings based on price action (default: 3% above/below the entry price).

Dynamic Market Structure DetectorTitle: Dynamic Market Structure Detector – Real-Time BoS & ChoCH Signals
Short Description:
Identify market structure dynamically with real-time Break of Structure (BoS) and Change of Character (ChoCH) signals. Highlight untested support and resistance zones to improve trading precision.
Full Description:
The Dynamic Market Structure Detector is a powerful TradingView indicator designed for traders who want to automate the identification of key market structure levels. This indicator simplifies market analysis by dynamically tracking swing highs and lows, marking critical Break of Structure (BoS) and Change of Character (ChoCH) points, and highlighting untested support and resistance zones.
Key Features:
1. Real-Time Signals:
• Marks Break of Structure (BoS) and Change of Character (ChoCH) points as they occur.
• Automatically updates as the market evolves.
2. Dynamic Swing Highs and Lows:
• Tracks swing highs and lows based on user-defined sensitivity (Swing Length).
• Adjust swing length to tailor signals for intraday or swing trading.
3. Untested Zones Highlight:
• Visualize untested support and resistance zones dynamically.
• Opacity settings allow customization for better chart readability.
4. Customizable Inputs:
• Swing Length:
Adjust the sensitivity of BoS and ChoCH signals.
• Smaller Swing Length values (e.g., 3–5): Capture short-term market movements, ideal for intraday trading.
• Larger Swing Length values (e.g., 10–20): Focus on significant market structure changes for swing or positional trading.
Experiment with these values to find the best fit for your trading style.
• Untested Zone Opacity:
Control the visibility of highlighted support and resistance zones.
• Lower opacity values (e.g., 10–50): Make the zones more prominent, helpful for darker chart backgrounds.
• Higher opacity values (e.g., 70–90): Provide subtle highlights, better suited for lighter chart setups.
• A value of 100% renders the zones completely transparent (invisible).
Use this setting to customize the visual appearance of your chart while still retaining key zone information.
5. User-Friendly Visualization:
• Color-coded labels for BoS (Green) and ChoCH (Red).
• Highlight zones for untested areas using customizable colors (Support: Blue, Resistance: Orange).
Why Use This Indicator?
• Simplifies market structure analysis by automating key calculations.
• Helps traders identify potential trend reversals and continuation points.
• Reduces the need for manual charting, saving time and effort.
• Provides visual clarity on untested zones for better decision-making.
Recommended Usage:
• Intraday Traders: Use smaller Swing Length values (e.g., 3–5) to capture short-term market movements.
• Swing Traders: Opt for higher Swing Length values (e.g., 10–20) to focus on larger market structure changes.
• Monitor untested zones for potential price reactions, enhancing your trade entries and exits.
Notes :
This indicator is best suited for traders who prefer price action trading and market structure analysis. While the indicator provides reliable insights, it is recommended to use it in conjunction with other analysis tools for a holistic trading approach.
Credits:
Developed by TradeTech Analysis to empower traders with automated tools for smarter trading decisions.

Mean Reversion Pro Strategy [tradeviZion]Mean Reversion Pro Strategy : User Guide
A mean reversion trading strategy for daily timeframe trading.
Introduction
Mean Reversion Pro Strategy is a technical trading system that operates on the daily timeframe. The strategy uses a dual Simple Moving Average (SMA) system combined with price range analysis to identify potential trading opportunities. It can be used on major indices and other markets with sufficient liquidity.
The strategy includes:
Trading System
Fast SMA for entry/exit points (5, 10, 15, 20 periods)
Slow SMA for trend reference (100, 200 periods)
Price range analysis (20% threshold)
Position management rules
Visual Elements
Gradient color indicators
Three themes (Dark/Light/Custom)
ATR-based visuals
Signal zones
Status Table
Current position information
Basic performance metrics
Strategy parameters
Optional messages
📊 Strategy Settings
Main Settings
Trading Mode
Options: Long Only, Short Only, Both
Default: Long Only
Position Size: 10% of equity
Starting Capital: $20,000
Moving Averages
Fast SMA: 5, 10, 15, or 20 periods
Slow SMA: 100 or 200 periods
Default: Fast=5, Slow=100
🎯 Entry and Exit Rules
Long Entry Conditions
All conditions must be met:
Price below Fast SMA
Price below 20% of current bar's range
Price above Slow SMA
No existing position
Short Entry Conditions
All conditions must be met:
Price above Fast SMA
Price above 80% of current bar's range
Price below Slow SMA
No existing position
Exit Rules
Long Positions
Exit when price crosses above Fast SMA
No fixed take-profit levels
No stop-loss (mean reversion approach)
Short Positions
Exit when price crosses below Fast SMA
No fixed take-profit levels
No stop-loss (mean reversion approach)
💼 Risk Management
Position Sizing
Default: 10% of equity per trade
Initial capital: $20,000
Commission: 0.01%
Slippage: 2 points
Maximum one position at a time
Risk Control
Use daily timeframe only
Avoid trading during major news events
Consider market conditions
Monitor overall exposure
📊 Performance Dashboard
The strategy includes a comprehensive status table displaying:
Strategy Parameters
Current SMA settings
Trading direction
Fast/Slow SMA ratio
Current Status
Active position (Flat/Long/Short)
Current price with color coding
Position status indicators
Performance Metrics
Net Profit (USD and %)
Win Rate with color grading
Profit Factor with thresholds
Maximum Drawdown percentage
Average Trade value
📱 Alert Settings
Entry Alerts
Long Entry (Buy Signal)
Short Entry (Sell Signal)
Exit Alerts
Long Exit (Take Profit)
Short Exit (Take Profit)
Alert Message Format
Strategy name
Signal type and direction
Current price
Fast SMA value
Slow SMA value
💡 Usage Tips
Consider starting with Long Only mode
Begin with default settings
Keep track of your trades
Review results regularly
Adjust settings as needed
Follow your trading plan
⚠️ Disclaimer
This strategy is for educational and informational purposes only. It is not financial advice. Always:
Conduct your own research
Test thoroughly before live trading
Use proper risk management
Consider your trading goals
Monitor market conditions
Never risk more than you can afford to lose
📋 Release Notes
14 January 2025
Added New Fast & Slow SMA Options:
Fibonacci-based periods: 8, 13, 21, 144, 233, 377
Additional period: 50
Complete Fast SMA options now: 5, 8, 10, 13, 15, 20, 21, 34, 50
Complete Slow SMA options now: 100, 144, 200, 233, 377
Bug Fixes:
Fixed Maximum Drawdown calculation in the performance table
Now using strategy.max_drawdown_percent for accurate DD reporting
Previous version showed incorrect DD values
Performance metrics now accurately reflect trading results
Performance Note:
Strategy tested with Fast/Slow SMA 13/377
Test conducted with 10% equity risk allocation
Daily Timeframe
For Beginners - How to Modify SMA Levels:
Find this line in the code:
fastLength = input.int(title="Fast SMA Length", defval=5, options= )
To add a new Fast SMA period: Add the number to the options list, e.g.,
To remove a Fast SMA period: Remove the number from the options list
For Slow SMA, find:
slowLength = input.int(title="Slow SMA Length", defval=100, options= )
Modify the options list the same way
⚠️ Note: Keep the periods that make sense for your trading timeframe
💡 Tip: Test any new combinations thoroughly before live trading
"Trade with Discipline, Manage Risk, Stay Consistent" - tradeviZion

[3Commas] Alligator StrategyThe Alligator Strategy
🔷 What it does: This script implements the Alligator Strategy, a trend-following method created by Bill Williams. It uses three customizable moving averages (SMMAs or RMAs) "Jaws," "Teeth," and "Lips" to identify market trends and potential trade opportunities. Additionally, it includes built-in stop-loss and take-profit options for enhanced risk management.
🔷 Who is it for:
Trend Traders: Those who prefer trading in markets with clear directional movement.
Advanced Users: Traders who require customizable tools and dynamic risk management features.
Beginners: Accessible to those new to trading, thanks to its intuitive visual representation of trends and pre-configured settings.
Bot Users: Supports direct signal integration for bot automation, including entries, take-profits, and stop-losses.
🔷 How does it work: The Alligator Jaws, Teeth, and Lips are smoothed moving averages (SMA, EMA, RMA, or WMA) calculated based on the selected source price ( hl2 = (high+low)/2 by default). Their lengths and offsets are customizable:
Jaws: Length 21 , offset 13.
Teeth: Length 13, offset 8.
Lips: Length 8 , offset 5.
When the lines align and spread apart (e.g., Lips > Teeth > Jaws for an uptrend), the strategy identifies a trending market.
Entry Conditions:
Long Trades: Triggered when Close > Lips > Teeth > Jaws.
Short Trades: Triggered when Close < Lips < Teeth < Jaws.
🔷 Why it’s unique:
Customization: Flexible settings for moving average types and lengths to adapt to different market conditions and strategy tester configurations.
Built-in Filters: Trend filters that can reduce false signals in certain scenarios, making it more reliable for trending markets.
Take Profit and Stop Loss:
Configurable as either percentage-based or dynamic.
Stop-loss levels adjust dynamically using the Alligator lines.
Fast exit logic moves the stop-loss closer to the price when trades are in profit.
3Commas Bot Compatibility: Designed for automated trading, allowing traders to configure and execute the strategy seamlessly.
🔷 Considerations Before Using the Indicator
🔸Why the Forward Offset: By shifting the averages forward, the Alligator helps traders focus on established trends while filtering out short-term market noise.
The standard configurations of 13-8, 8-5, and 5-3 were selected based on Bill Williams’ studies of market behavior. However, these values can be adjusted to suit different market conditions:
Volatile Markets: Faster settings (e.g., 10-6, 6-4, 3-2) may provide earlier signals.
Less Volatile Markets: Slower settings (e.g., 21-13, 13-8, 8-5) can help avoid noise and reduce false signals.
🔸Best Timeframes to Use: The Alligator can be applied across all timeframes, but certain timeframes offer better reliability.
Higher Timeframes (H4, D1, W1): Ideal for identifying significant trends and for swing or position trading.
Lower Timeframes: Not recommended due to increased noise but may work for scalping with additional confirmation tools.
🔸Disadvantages of the Alligator Strategy:
Exhausted Entry Levels: High buying levels or low selling levels can lead to momentum exhaustion and potential pullbacks.
False Signals in Ranges: Consolidating markets can produce unreliable signals.
Lagging Indicator: As it is based on moving averages, it may delay reacting to sudden price changes.
🔸Advantages of the Alligator Strategy:
Trend Focused: Simplifies the identification of trending markets.
Noise Reduction: Forward shifts and smoothed averages help filter out short-term price fluctuations.
Broad Applicability: Suitable for forex, crypto, stocks, and commodities.
🔸Important Considerations:
While the Alligator Strategy provides a systematic way to analyze markets, it does not guarantee successful outcomes. Results in trading depend on multiple factors, including market conditions, trader discipline, and risk management. Past performance of the strategy does not ensure future success, and traders should always approach the market with caution.
Risk Management: Define stop-loss levels, position size, and profit targets before entering any trade. Be prepared for the possibility of losses and ensure that your approach aligns with your overall trading plan.
🔷 STRATEGY PROPERTIES
Symbol: BINANCE:BTCUSDT (Spot).
Timeframe: 1D (Daily Timeframe).
Test Period: All historical data available.
Initial Capital: 10000 USDT.
Order Size per Trade: 1% of Capital, you can use a higher value e.g. 5%, be cautious that the Max Drawdown does not exceed 10%, as it would indicate a very risky trading approach.
Commission: Binance commission 0.1%, adjust according to the exchange being used, lower numbers will generate unrealistic results. By using low values e.g. 5%, it allows us to adapt over time and check the functioning of the strategy.
Slippage: 5 ticks, for pairs with low liquidity or very large orders, this number should be increased as the order may not be filled at the desired level.
Margin for Long and Short Positions: 100%.
Indicator Settings: Default Configuration.
Alligator: Source hl2 | Calculation RMA | Jaw 21-13, Teeth 13-8, Lips 8-5.
Strategy: Long & Short.
Max Stop Loss per Trade: 10% of Trade Size.
Exit trades on opposite signal: Enable.
Alligator Stop Loss: Enable.
Alligator Fast Exit: Enable.
🔷 STRATEGY RESULTS
⚠️ Remember, past results do not guarantee future performance.
Net Profit: +355.68 USDT (+3.56%).
Total Closed Trades: 103.
Percent Profitable: 47.57%.
Profit Factor: 1.927.
Max Drawdown: -57.99 USDT (-0.56%).
Average Trade: +3.45 USDT (+3.41%).
Average # Bars in Trades: 16.
🔷 HOW TO USE
🔸Adjust the Alligator Settings:
The default values generally work well: Source hl2 | Calculation RMA | Jaw 21-13, Teeth 13-8, Lips 8-5. However, if you want to use it on timeframes smaller than 4H (4 hours), consider increasing the values to better filter market noise.
Please review the "Indicator Settings" section for configuration.
🔸Choose a Symbol that Typically Trends:
Select an asset that tends to create trends. However, the Strategy Tester results may display poor performance, making it less suitable for sending signals to bots.
🔸Add Trend Filters:
You can enable trend filters like MA and SuperTrend. By default, these are disabled as they are often unnecessary, but you can experiment with their configuration to see if they optimize the strategy's results.
Please review the "Indicator Settings" section for configuration.
🔸Enable Stop Loss Levels:
Activate Stop Loss features, such as Stop Loss % or Alligator Stop Loss. If both are enabled, the one closest to the price during the trade will be applied.
Please review the "Indicator Settings" section for configuration.
🔸Enable Take Profit Levels:
Activate Take Profit options, such as Take Profit % or Alligator Fast Exit. If both are enabled, the one that triggers first will be executed.
Please review the "Indicator Settings" section for configuration.
This is an example with the default settings and how Alligator Stop Loss and Alligator Fast Exit are activated:
In this example, we additionally enable the Take Profit at 10%. We can observe that the Alligator Stop Loss is the active one since it is closer to the price. When the price moves 10% in favor or against the trade, the position is closed. Although the Alligator Fast Exit is enabled, it does not activate because the trades are closed beforehand.
🔸Results Review:
It is important to check the Max Drawdown. This value should ideally not exceed 10% of your capital. Consider adjusting the trade size to ensure this threshold is not surpassed.
Remember to include the correct values for commission and slippage according to the symbol and exchange where you are conducting the tests. Otherwise, the results will not be realistic.
If you are satisfied with the results, you may consider automating your trades. However, it is strongly recommended to use a small amount of capital or a demo account to test proper execution before committing real funds.
🔸Create alerts to trigger the DCA Bot
Verify Messages: Ensure the message matches the one specified by the DCA Bot.
Multi-Pair Configuration: For multi-pair setups, enable the option to add the symbol in the correct format.
Signal Settings: Enable whether you want to receive long or short signals (Entry | TP | SL), copy and paste the the messages for the DCA Bots configured in 3Commas.
Alert Setup:
When creating an alert, set the condition to the indicator and choose "alert() function call only.
Enter any desired Alert Name.
Open the Notifications tab, enable Webhook URL, and paste the Webhook URL from 3Commas.
For more details, refer to the 3Commas section: "How to use TradingView Custom Signals.
Finalize Alerts: Click Create, you're done! Alerts will now be sent automatically in the correct format to 3Commas.
🔷 INDICATOR SETTINGS
🔸Alligator Settings
MA's source: Source price for Alligator moving averages.
MA's Type: Type of calculation for MA's.
Jaw and Offset: Jaw length and offset to the right.
Teeth and Offset: Teethlength and offset to the right.
Lips and Offset: Lips length and offset to the right.
🔸Alligator Style
Plot Alligator: Show Alligator Ribbon.
Plot MA's: Show Alligator MA's.
Colors: Main and Gradient Colors for Bullish Alligator, Berish Alligator, Neutral Alligator. For gradient colors it is recommended to use an opacity of 15.
🔸MA & SuperTrend Filters
MA & Plot: Activate MA Filter and Plot MA on the chart.
Long Entries: When activated, it will only execute entries if the price is above the MA
Short Entries: When activated, it will only execute entries if the price is below the MA.
Source: Source price for moving average calculations.
Length: Candles to be used by the MA calculations.
Type: Type of calculation for MA.
Timeframe: Here you can select a larger timeframe for the filter.
ST & Plot: Activate SuperTrend Filter and Plot SuperTrend on the chart.
Long Entries: When activated, it will only execute entries if the price is above the SuperTrend.
Short Entries: When activated, it will only execute entries if the price is below the SuperTrend.
Source: Source price for SuperTrend calculations.
Length: Candles to be used by the SuperTrend calculations.
Factor: ATR multiplier of the SuperTrend.
Timeframe: Here you can select a larger timeframe for the filter.
🔸Strategy Tester
Strategy: Order Type direction in which trades are executed.
Take Profit %: When activated, the entered value will be used as the Take Profit in percentage from the entry price level.
Stop Loss %: When activated, the entered value will be used as the Stop Loss in percentage from the entry price level. If Alligator Stop Loss is activated, the closest one to the price will be used.
Exit trades on opposite signal: This option closes the trade if the opposite condition is met. For instance, if we are in a long position and a sell signal is triggered, the long position will be closed, and a short position will be opened. The same applies inversely.
Alligator Stop Loss: In a long trade, the lower part of the Alligator indicator will be used as a dynamic stop loss. Similarly, in a short trade, the upper part of the indicator will be used.
Alligator Fast Exit: Its purpose is to attempt to protect movements in favor of the trade's direction. In the case of long trades, once the price and the upper part of the Alligator indicator are above the trade's entry price, the stop loss will be moved to the upper part. For short trades, once the price and the lower part of the Alligator indicator are below the trade's entry price, the stop loss will be moved to the lower part of the Alligator indicator.
Alligator Squeeze Entry: When activated, entries will only be executed if they meet the condition after a neutral zone of the Alligator indicator.
Alligator Squeeze Exit: When this option is activated, any open trades will be closed when the Alligator indicator enters a neutral mode.
Use Custom Test Period: When enabled signals only works in the selected time window. If disabled it will use all historical data available on the chart.
Test Start and End: Once the Custom Test Period is enabled, here you select the start and end date that you want to analyze.
🔸3Commas DCA Bot Signals
Check Messages: Enable the table to review the messages to be sent to the bot.
Entry | TP | SL: Enable this options to send Buy Entry, Take Profit (TP), and Stop Loss (SL) signals to 3Commas.
Deal Entry and Deal Exit : Copy and paste the message for the deal start signal and close order at Market Price of the DCA Bot you created in 3Commas. This is the message that will be sent with the alert to the Bot, you must verify that it is the same as the 3Commas bot so that it can process properly so that it executes and starts the trade.
DCA Bot Multi-Pair: You must activate it if you want to use the signals in a DCA Bot Multi-pair in the text box you must enter (using the 3Commas format) the symbol in which you are creating the alert, you can check the format of each symbol when you create the bot.
🔷 CONCLUSION
The Alligator Strategy is a valuable tool for identifying potential trends and improving decision-making. However, no trading strategy is foolproof. Careful consideration of market conditions, proper risk management, and personal trading goals are essential. Use the Alligator as part of a broader trading system, and remember that consistent learning and discipline are key to success in trading.
👨🏻💻💭 We hope this tool helps enhance your trading. Your feedback is invaluable, so feel free to share any suggestions for improvements or new features you'd like to see implemented.
____________________________________________________________________
The information and publications within the 3Commas TradingView account are not meant to be and do not constitute financial, investment, trading, or other types of advice or recommendations supplied or endorsed by 3Commas and any of the parties acting on behalf of 3Commas, including its employees, contractors, ambassadors, etc.

Xmaster Formula Indicator [TradingFinder] No Repaint Strategies🔵 Introduction
The Xmaster Formula Indicator is a powerful tool for forex trading, combining multiple technical indicators to provide insights into market trends, support and resistance levels, and price reversals. Developed in the early 2010s, it is widely valued for generating reliable buy and sell signals.
Key components include Exponential Moving Averages (EMA) for identifying trends and price momentum, and MACD (Moving Average Convergence Divergence) for analyzing trend strength and direction.
The Stochastic Oscillator and RSI (Relative Strength Index) enhance accuracy by signaling potential price reversals. Additionally, the Parabolic SAR assists in identifying trend reversals and managing risk.
By integrating these tools, the Xmaster Formula Indicator provides a comprehensive view of market conditions, empowering traders to make informed decisions.
🔵 How to Use
The Xmaster Formula Indicator offers two distinct methods for generating signals: Standard Mode and Advance Mode. Each method caters to different trading styles and strategies.
Standard Mode :
In Standard Mode, the indicator uses normalized moving average data to generate buy and sell signals. The difference between the short-term (10-period) and long-term (38-period) EMAs is calculated and normalized to a 0-100 scale.
Buy Signal : When the normalized value crosses above 55, accompanied by the trend line turning green, a buy signal is generated.
Sell Signal : When the normalized value crosses below 45, and the trend line turns red, a sell signal is issued.
This mode is simple, making it ideal for traders looking for straightforward signals without the need for additional confirmations.
Advance Mode :
Advance Mode combines multiple technical indicators to provide more detailed and robust signals.
This method analyzes trends by incorporating :
🟣 MACD
Buy Signal : When the MACD histogram bars are positive.
Sell Signal : When the MACD histogram bars are negative.
🟣 RSI
Buy Signal : When RSI is below 30, indicating oversold conditions.
Sell Signal : When RSI is above 70, suggesting overbought conditions.
🟣 Stochastic Oscillator
Buy Signal : When Stochastic is below 20.
Sell Signal : When Stochastic is above 80.
🟣 Parabolic SAR
Buy Signal : When SAR is below the price.
Sell Signal : When SAR is above the price.
A signal is generated in Advance Mode only when all these indicators align :
Buy Signal : All conditions point to a bullish trend.
Sell Signal : All conditions indicate a bearish trend.
This mode is more comprehensive and suitable for traders who prefer deeper analysis and stronger confirmations before executing trades.
🔵 Settings
Method :
Choose between "Standard" and "Advance" modes to determine how signals are generated. In Standard Mode, signals are based on normalized moving average data, while in Advance Mode, signals rely on the combination of MACD, RSI, Stochastic Oscillator, and Parabolic SAR.
Moving Average Settings :
Short Length : The period for the short-term EMA (default is 10).
Mid Length : The period for the medium-term EMA (default is 20).
Long Length : The period for the long-term EMA (default is 38).
MACD Settings :
Fast Length : The period for the fast EMA in the MACD calculation (default is 12).
Slow Length : The period for the slow EMA in the MACD calculation (default is 26).
Signal Line : The signal line period for MACD (default is 9).
Stochastic Settings :
Length : The period for the Stochastic Oscillator (default is 14).
RSI Settings :
Length : The period for the Relative Strength Index (default is 14).
🔵 Conclusion
The Xmaster Formula Indicator is a versatile and reliable tool for forex traders, offering both simplicity and advanced analysis through its Standard and Advance modes. In Standard Mode, traders benefit from straightforward signals based on normalized moving average data, making it ideal for quick decision-making.
Advance Mode, on the other hand, provides a more detailed analysis by combining multiple indicators like MACD, RSI, Stochastic Oscillator, and Parabolic SAR, delivering stronger confirmations for critical market decisions.
While the Xmaster Formula Indicator offers valuable insights and reliable signals, it is important to use it alongside proper risk management and other analytical methods. By leveraging its capabilities effectively, traders can enhance their trading strategies and achieve better outcomes in the dynamic forex market.

MMXM ICT [TradingFinder] Market Maker Model PO3 CHoCH/CSID + FVG🔵 Introduction
The MMXM Smart Money Reversal leverages key metrics such as SMT Divergence, Liquidity Sweep, HTF PD Array, Market Structure Shift (MSS) or (ChoCh), CISD, and Fair Value Gap (FVG) to identify critical turning points in the market. Designed for traders aiming to analyze the behavior of major market participants, this setup pinpoints strategic areas for making informed trading decisions.
The document introduces the MMXM model, a trading strategy that identifies market maker activity to predict price movements. The model operates across five distinct stages: original consolidation, price run, smart money reversal, accumulation/distribution, and completion. This systematic approach allows traders to differentiate between buyside and sellside curves, offering a structured framework for interpreting price action.
Market makers play a pivotal role in facilitating these movements by bridging liquidity gaps. They continuously quote bid (buy) and ask (sell) prices for assets, ensuring smooth trading conditions.
By maintaining liquidity, market makers prevent scenarios where buyers are left without sellers and vice versa, making their activity a cornerstone of the MMXM strategy.
SMT Divergence serves as the first signal of a potential trend reversal, arising from discrepancies between the movements of related assets or indices. This divergence is detected when two or more highly correlated assets or indices move in opposite directions, signaling a likely shift in market trends.
Liquidity Sweep occurs when the market targets liquidity in specific zones through false price movements. This process allows major market participants to execute their orders efficiently by collecting the necessary liquidity to enter or exit positions.
The HTF PD Array refers to premium and discount zones on higher timeframes. These zones highlight price levels where the market is in a premium (ideal for selling) or discount (ideal for buying). These areas are identified based on higher timeframe market behavior and guide traders toward lucrative opportunities.
Market Structure Shift (MSS), also referred to as ChoCh, indicates a change in market structure, often marked by breaking key support or resistance levels. This shift confirms the directional movement of the market, signaling the start of a new trend.
CISD (Change in State of Delivery) reflects a transition in price delivery mechanisms. Typically occurring after MSS, CISD confirms the continuation of price movement in the new direction.
Fair Value Gap (FVG) represents zones where price imbalance exists between buyers and sellers. These gaps often act as price targets for filling, offering traders opportunities for entry or exit.
By combining all these metrics, the Smart Money Reversal provides a comprehensive tool for analyzing market behavior and identifying key trading opportunities. It enables traders to anticipate the actions of major players and align their strategies accordingly.
MMBM :
MMSM :
🔵 How to Use
The Smart Money Reversal operates in two primary states: MMBM (Market Maker Buy Model) and MMSM (Market Maker Sell Model). Each state highlights critical structural changes in market trends, focusing on liquidity behavior and price reactions at key levels to offer precise and effective trading opportunities.
The MMXM model expands on this by identifying five distinct stages of market behavior: original consolidation, price run, smart money reversal, accumulation/distribution, and completion. These stages provide traders with a detailed roadmap for interpreting price action and anticipating market maker activity.
🟣 Market Maker Buy Model
In the MMBM state, the market transitions from a bearish trend to a bullish trend. Initially, SMT Divergence between related assets or indices reveals weaknesses in the bearish trend. Subsequently, a Liquidity Sweep collects liquidity from lower levels through false breakouts.
After this, the price reacts to discount zones identified in the HTF PD Array, where major market participants often execute buy orders. The market confirms the bullish trend with a Market Structure Shift (MSS) and a change in price delivery state (CISD). During this phase, an FVG emerges as a key trading opportunity. Traders can open long positions upon a pullback to this FVG zone, capitalizing on the bullish continuation.
🟣 Market Maker Sell Model
In the MMSM state, the market shifts from a bullish trend to a bearish trend. Here, SMT Divergence highlights weaknesses in the bullish trend. A Liquidity Sweep then gathers liquidity from higher levels.
The price reacts to premium zones identified in the HTF PD Array, where major sellers enter the market and reverse the price direction. A Market Structure Shift (MSS) and a change in delivery state (CISD) confirm the bearish trend. The FVG then acts as a target for the price. Traders can initiate short positions upon a pullback to this FVG zone, profiting from the bearish continuation.
Market makers actively bridge liquidity gaps throughout these stages, quoting continuous bid and ask prices for assets. This ensures that trades are executed seamlessly, even during periods of low market participation, and supports the structured progression of the MMXM model.
The price’s reaction to FVG zones in both states provides traders with opportunities to reduce risk and enhance precision. These pullbacks to FVG zones not only represent optimal entry points but also create avenues for maximizing returns with minimal risk.
🔵 Settings
Higher TimeFrame PD Array : Selects the timeframe for identifying premium/discount arrays on higher timeframes.
PD Array Period : Specifies the number of candles for identifying key swing points.
ATR Coefficient Threshold : Defines the threshold for acceptable volatility based on ATR.
Max Swing Back Method : Choose between analyzing all swings ("All") or a fixed number ("Custom").
Max Swing Back : Sets the maximum number of candles to consider for swing analysis (if "Custom" is selected).
Second Symbol for SMT : Specifies the second asset or index for detecting SMT divergence.
SMT Fractal Periods : Sets the number of candles required to identify SMT fractals.
FVG Validity Period : Defines the validity duration for FVG zones.
MSS Validity Period : Sets the validity duration for MSS zones.
FVG Filter : Activates filtering for FVG zones based on width.
FVG Filter Type : Selects the filtering level from "Very Aggressive" to "Very Defensive."
Mitigation Level FVG : Determines the level within the FVG zone (proximal, 50%, or distal) that price reacts to.
Demand FVG : Enables the display of demand FVG zones.
Supply FVG : Enables the display of supply FVG zones.
Zone Colors : Allows customization of colors for demand and supply FVG zones.
Bottom Line & Label : Enables or disables the SMT divergence line and label from the bottom.
Top Line & Label : Enables or disables the SMT divergence line and label from the top.
Show All HTF Levels : Displays all premium/discount levels on higher timeframes.
High/Low Levels : Activates the display of high/low levels.
Color Options : Customizes the colors for high/low lines and labels.
Show All MSS Levels : Enables display of all MSS zones.
High/Low MSS Levels : Activates the display of high/low MSS levels.
Color Options : Customizes the colors for MSS lines and labels.
🔵 Conclusion
The Smart Money Reversal model represents one of the most advanced tools for technical analysis, enabling traders to identify critical market turning points. By leveraging metrics such as SMT Divergence, Liquidity Sweep, HTF PD Array, MSS, CISD, and FVG, traders can predict future price movements with precision.
The price’s interaction with key zones such as PD Array and FVG, combined with pullbacks to imbalance areas, offers exceptional opportunities with favorable risk-to-reward ratios. This approach empowers traders to analyze the behavior of major market participants and adopt professional strategies for entry and exit.
By employing this analytical framework, traders can reduce errors, make more informed decisions, and capitalize on profitable opportunities. The Smart Money Reversal focuses on liquidity behavior and structural changes, making it an indispensable tool for financial market success.

Phase Cross Strategy with Zone### Introduction to the Strategy
Welcome to the **Phase Cross Strategy with Zone and EMA Analysis**. This strategy is designed to help traders identify potential buy and sell opportunities based on the crossover of smoothed oscillators (referred to as "phases") and exponential moving averages (EMAs). By combining these two methods, the strategy offers a versatile tool for both trend-following and short-term trading setups.
### Key Features
1. **Phase Cross Signals**:
- The strategy uses two smoothed oscillators:
- **Leading Phase**: A simple moving average (SMA) with an upward offset.
- **Lagging Phase**: An exponential moving average (EMA) with a downward offset.
- Buy and sell signals are generated when these phases cross over or under each other, visually represented on the chart with green (buy) and red (sell) labels.
2. **Phase Zone Visualization**:
- The area between the two phases is filled with a green or red zone, indicating bullish or bearish conditions:
- Green zone: Leading phase is above the lagging phase (potential uptrend).
- Red zone: Leading phase is below the lagging phase (potential downtrend).
3. **EMA Analysis**:
- Includes five commonly used EMAs (13, 26, 50, 100, and 200) for additional trend analysis.
- Crossovers of the EMA 13 and EMA 26 act as secondary buy/sell signals to confirm or enhance the phase-based signals.
4. **Customizable Parameters**:
- You can adjust the smoothing length, source (price data), and offset to fine-tune the strategy for your preferred trading style.
### What to Pay Attention To
1. **Phases and Zones**:
- Use the green/red phase zone as an overall trend guide.
- Avoid taking trades when the phases are too close or choppy, as it may indicate a ranging market.
2. **EMA Trends**:
- Align your trades with the longer-term trend shown by the EMAs. For example:
- In an uptrend (price above EMA 50 or EMA 200), prioritize buy signals.
- In a downtrend (price below EMA 50 or EMA 200), prioritize sell signals.
3. **Signal Confirmation**:
- Consider combining phase cross signals with EMA crossovers for higher-confidence trades.
- Look for confluence between the phase signals and EMA trends.
4. **Risk Management**:
- Always set stop-loss and take-profit levels to manage risk.
- Use the phase and EMA zones to estimate potential support/resistance areas for exits.
5. **Whipsaws and False Signals**:
- Be cautious in low-volatility or sideways markets, as the strategy may generate false signals.
- Use additional indicators or filters to avoid entering trades during unclear market conditions.
### How to Use
1. Add the strategy to your chart in TradingView.
2. Adjust the input settings (e.g., smoothing length, offsets) to suit your trading preferences.
3. Enable the strategy tester to evaluate its performance on historical data.
4. Combine the signals with your own analysis and risk management plan for best results.
This strategy is a versatile tool, but like any trading method, it requires proper understanding and discretion. Always backtest thoroughly and trade with discipline. Let me know if you need further assistance or adjustments to the strategy!

Adaptive Trend Flow Strategy with Filters for SPXThe Adaptive Trend Flow Strategy with Filters for SPX is a complete trading algorithm designed to identify traits and offer actionable alerts for the SPX index. This Pine Script approach leverages superior technical signs and user-described parameters to evolve to marketplace conditions and optimize performance.
Key Features and Functionality
Dynamic Trend Detection: Utilizes a dual EMA-based totally adaptive method for fashion calculation.
The script smooths volatility the usage of an EMA filter and adjusts sensitivity through the sensitivity enter. This allows for real-time adaptability to market fluctuations.
Trend Filters for Precision:
SMA Filter: A Simple Moving Average (SMA) guarantees that trades are achieved best while the rate aligns with the shifting average trend, minimizing false indicators.
MACD Filter: The Moving Average Convergence Divergence (MACD) adds some other layer of confirmation with the aid of requiring alignment among the MACD line and its sign line.
Signal Generation:
Long Signals: Triggered when the fashion transitions from bearish to bullish, with all filters confirming the pass.
Short Signals: Triggered while the trend shifts from bullish to bearish, imparting opportunities for final positions.
User Customization:
Adjustable parameters for EMAs, smoothing duration, and sensitivity make certain the strategy can adapt to numerous buying and selling patterns.
Enable or disable filters (SMA or MACD) based totally on particular market conditions or consumer possibilities.
Leverage and Position Sizing: Incorporates a leverage aspect for dynamic position sizing.
Automatically calculates the exchange length based on account fairness and the leverage element, making sure hazard control is in area.
Visual Enhancements: Plots adaptive fashion ranges (foundation, top, decrease) for actual-time insights into marketplace conditions.
Color-coded bars and heritage to visually represent bullish or bearish developments.
Custom labels indicating crossover and crossunder occasions for clean sign visualization.
Alerts and Automation: Configurable alerts for each lengthy and quick indicators, well matched with automated buying and selling structures like plugpine.Com.
JSON-based alert messages consist of account credentials, motion type, and calculated position length for seamless integration.
Backtesting and Realistic Assumptions: Includes practical slippage, commissions, and preliminary capital settings for backtesting accuracy.
Leverages excessive-frequency trade sampling to make certain strong strategy assessment.
How It Works
Trend Calculation: The method derives a principal trend basis with the aid of combining fast and gradual EMAs. It then uses marketplace volatility to calculate adaptive upper and decrease obstacles, creating a dynamic channel.
Filter Integration: SMA and MACD filters work in tandem with the fashion calculation to ensure that handiest excessive-probability signals are accomplished.
Signal Execution: Signals are generated whilst the charge breaches those dynamic tiers and aligns with the fashion and filters, ensuring sturdy change access situations.
How to Use
Setup: Apply the approach to SPX or other well suited indices.
Adjust person inputs, together with ATR length, EMA smoothing, and sensitivity, to align together with your buying and selling possibilities.
Enable or disable the SMA and MACD filters to test unique setups.
Alerts: Configure signals for computerized notifications or direct buying and selling execution through third-celebration systems.
Use the supplied JSON payload to integrate with broking APIs or automation tools.
Optimization:
Experiment with leverage, filter out settings, and sensitivity to find most effective configurations to your hazard tolerance and marketplace situations.
Considerations and Best Practices
Risk Management: Always backtest the method with realistic parameters, together with conservative leverage and commissions.
Market Suitability: While designed for SPX, this method can adapt to other gadgets by means of adjusting key parameters.
Limitations: The method is trend-following and can underperform in enormously risky or ranging markets. Regularly evaluate and modify parameters primarily based on recent market conduct.
If you have any questions please let me know - I'm here to help!

BullBear with Volume-Percentile TP - Strategy [presentTrading] Happy New Year, everyone! I hope we have a fantastic year ahead.
It's been a while since I published an open script, but it's time to return.
This strategy introduces an indicator called Bull Bear Power, combined with an advanced take-profit system, which is the main innovative and educational aspect of this script. I hope all of you find some useful insights here. Welcome to engage in meaningful exchanges. This is a versatile tool suitable for both novice and experienced traders.
█ Introduction and How it is Different
Unlike traditional strategies that rely solely on price or volume indicators, this approach combines Bull Bear Power (BBP) with volume percentile analysis to identify optimal entry and exit points. It features a dynamic take-profit mechanism based on ATR (Average True Range) multipliers adjusted by volume and percentile factors, ensuring adaptability to diverse market conditions. This multifaceted strategy not only improves signal accuracy but also optimizes risk management, distinguishing it from conventional trading methods.
BTCUSD 6hr performance
Disable the visualization of Bull Bear Power (BBP) to clearly view the Z-Score.
█ Strategy, How it Works: Detailed Explanation
The BBP Strategy with Volume-Percentile TP utilizes several interconnected components to analyze market data and generate trading signals. Here's an overview with essential equations:
🔶 Core Indicators and Calculations
1. Exponential Moving Average (EMA):
- **Purpose:** Smoothens price data to identify trends.
- **Formula:**
EMA_t = (Close_t * (2 / (lengthInput + 1))) + (EMA_(t-1) * (1 - (2 / (lengthInput + 1))))
- Usage: Baseline for Bull and Bear Power.
2. Bull and Bear Power:
- Bull Power: `BullPower = High_t - EMA_t`
- Bear Power: `BearPower = Low_t - EMA_t`
- BBP:** `BBP = BullPower + BearPower`
- Interpretation: Positive BBP indicates bullish strength, negative indicates bearish.
3. Z-Score Calculation:
- Purpose: Normalizes BBP to assess deviation from the mean.
- Formula:
Z-Score = (BBP_t - bbp_mean) / bbp_std
- Components:
- `bbp_mean` = SMA of BBP over `zLength` periods.
- `bbp_std` = Standard deviation of BBP over `zLength` periods.
- Usage: Identifies overbought or oversold conditions based on thresholds.
🔶 Volume Analysis
1. Volume Moving Average (`vol_sma`):
vol_sma = (Volume_1 + Volume_2 + ... + Volume_vol_period) / vol_period
2. Volume Multiplier (`vol_mult`):
vol_mult = Current Volume / vol_sma
- Thresholds:
- High Volume: `vol_mult > 2.0`
- Medium Volume: `1.5 < vol_mult ≤ 2.0`
- Low Volume: `1.0 < vol_mult ≤ 1.5`
🔶 Percentile Analysis
1. Percentile Calculation (`calcPercentile`):
Percentile = (Number of values ≤ Current Value / perc_period) * 100
2. Thresholds:
- High Percentile: >90%
- Medium Percentile: >80%
- Low Percentile: >70%
🔶 Dynamic Take-Profit Mechanism
1. ATR-Based Targets:
TP1 Price = Entry Price ± (ATR * atrMult1 * TP_Factor)
TP2 Price = Entry Price ± (ATR * atrMult2 * TP_Factor)
TP3 Price = Entry Price ± (ATR * atrMult3 * TP_Factor)
- ATR Calculation:
ATR_t = (True Range_1 + True Range_2 + ... + True Range_baseAtrLength) / baseAtrLength
2. Adjustment Factors:
TP_Factor = (vol_score + price_score) / 2
- **vol_score** and **price_score** are based on current volume and price percentiles.
Local performance
🔶 Entry and Exit Logic
1. Long Entry: If Z-Score crosses above 1.618, then Enter Long.
2. Short Entry: If Z-Score crosses below -1.618, then Enter Short.
3. Exiting Positions:
If Long and Z-Score crosses below 0:
Exit Long
If Short and Z-Score crosses above 0:
Exit Short
4. Take-Profit Execution:
- Set multiple exit orders at dynamically calculated TP levels based on ATR and adjusted by `TP_Factor`.
█ Trade Direction
The strategy determines trade direction using the Z-Score from the BBP indicator:
- Long Positions:
- Condition: Z-Score crosses above 1.618.
- Short Positions:
- Condition: Z-Score crosses below -1.618.
- Exiting Trades:
- Long Exit: Z-Score drops below 0.
- Short Exit: Z-Score rises above 0.
This approach aligns trades with prevailing market trends, increasing the likelihood of successful outcomes.
█ Usage
Implementing the BBP Strategy with Volume-Percentile TP in TradingView involves:
1. Adding the Strategy:
- Copy the Pine Script code.
- Paste it into TradingView's Pine Editor.
- Save and apply the strategy to your chart.
2. Configuring Settings:
- Adjust parameters like EMA length, Z-Score thresholds, ATR multipliers, volume periods, and percentile settings to match your trading preferences and asset behavior.
3. Backtesting:
- Use TradingView’s backtesting tools to evaluate historical performance.
- Analyze metrics such as profit factor, drawdown, and win rate.
4. Optimization:
- Fine-tune parameters based on backtesting results.
- Test across different assets and timeframes to enhance adaptability.
5. Deployment:
- Apply the strategy in a live trading environment.
- Continuously monitor and adjust settings as market conditions change.
█ Default Settings
The BBP Strategy with Volume-Percentile TP includes default parameters designed for balanced performance across various markets. Understanding these settings and their impact is essential for optimizing strategy performance:
Bull Bear Power Settings:
- EMA Length (`lengthInput`): 21
- **Effect:** Balances sensitivity and trend identification; shorter lengths respond quicker but may generate false signals.
- Z-Score Length (`zLength`): 252
- **Effect:** Long period for stable mean and standard deviation, reducing false signals but less responsive to recent changes.
- Z-Score Threshold (`zThreshold`): 1.618
- **Effect:** Higher threshold filters out weaker signals, focusing on significant market moves.
Take Profit Settings:
- Use Take Profit (`useTP`): Enabled (`true`)
- **Effect:** Activates dynamic profit-taking, enhancing profitability and risk management.
- ATR Period (`baseAtrLength`): 20
- **Effect:** Shorter period for sensitive volatility measurement, allowing tighter profit targets.
- ATR Multipliers:
- **Effect:** Define conservative to aggressive profit targets based on volatility.
- Position Sizes:
- **Effect:** Diversifies profit-taking across multiple levels, balancing risk and reward.
Volume Analysis Settings:
- Volume MA Period (`vol_period`): 100
- **Effect:** Longer period for stable volume average, reducing the impact of short-term spikes.
- Volume Multipliers:
- **Effect:** Determines volume conditions affecting take-profit adjustments.
- Volume Factors:
- **Effect:** Adjusts ATR multipliers based on volume strength.
Percentile Analysis Settings:
- Percentile Period (`perc_period`): 100
- **Effect:** Balances historical context with responsiveness to recent data.
- Percentile Thresholds:
- **Effect:** Defines price and volume percentile levels influencing take-profit adjustments.
- Percentile Factors:
- **Effect:** Modulates ATR multipliers based on price percentile strength.
Impact on Performance:
- EMA Length: Shorter EMAs increase sensitivity but may cause more false signals; longer EMAs provide stability but react slower to market changes.
- Z-Score Parameters:*Longer Z-Score periods create more stable signals, while higher thresholds reduce trade frequency but increase signal reliability.
- ATR Multipliers and Position Sizes: Higher multipliers allow for larger profit targets with increased risk, while diversified position sizes help in securing profits at multiple levels.
- Volume and Percentile Settings: These adjustments ensure that take-profit targets adapt to current market conditions, enhancing flexibility and performance across different volatility environments.
- Commission and Slippage: Accurate settings prevent overestimation of profitability and ensure the strategy remains viable after accounting for trading costs.
Conclusion
The BBP Strategy with Volume-Percentile TP offers a robust framework by combining BBP indicators with volume and percentile analyses. Its dynamic take-profit mechanism, tailored through ATR adjustments, ensures that traders can effectively capture profits while managing risks in varying market conditions.

DCA Buy v1Key Features
1. Selective Entry Filters
Trend Filter
Enabled through "Enable Trend Filter?" using the "EMA Length" setting to ensure entries align with prevailing trends.
Momentum Filter
Configured using "Enable Momentum Filter?" combined with "RSI Length" and "RSI Source" to detect oversold conditions.
Bollinger Filter
Activated via "Enable Bollinger Filter?" along with "BB Length" and "BB Multiplier" to focus entries on deeper price dips below Bollinger Bands.
2. DCA Configuration
Base Order Settings
Choose between a percentage ("Base Order % of Equity/Initial Capital") or fixed value ("Base Order Value ($)").
Safety Order Settings
Fine-tune "Initial Deviation (%)" and "Price Deviation Multiplier" to control the spacing of safety orders.
Use "Volume Scaling Factor (Qty)" to scale the size of each subsequent safety order.
Customize the "First Safety Order Type" as either value-based or a multiplier of the base order using "1st Safety Order Value ($)" or "1st Safety Order Multiplier (Qty)".
Set the maximum number of safety orders through "Max Safety Orders".
3. Profit and Risk Management
Take Profit Settings
"Take Profit (%)" triggers a sell when a specific profit percentage above the average entry is reached.
Use "Trailing Take Profit (%)" to lock in profits while capturing additional upside if prices continue to rise.
Stop Loss Settings
Configure "Stop Loss (%)" to prevent excessive drawdowns by closing all positions when prices drop below a defined percentage.
4. Time Control & Visualization
Time Filters
Define trading windows with "Start Time" and "End Time".
Use "Cooldown (Seconds)" to avoid frequent entries during rapid price movements.
Visualization
Enable "Show Average Entry Price", "Show Take Profit Level", and "Show Stop Loss Level" to plot key levels on the chart for better monitoring.
5. Performance Metrics
Built-in performance tracking includes:
Net Profit (%): Measures overall profitability.
Win Rate (%): Displays the ratio of winning trades.
Max Drawdown (%): Tracks the largest equity decline.
Trading Days: Calculates the duration of active trades.
Profit/Day (%): Evaluates daily returns.
The performance table also shows average cycle duration and utilization of available capital.

TradeShields Strategy Builder🛡 WHAT IS TRADESHIELDS?
This no-code strategy builder is designed for traders on TradingView, offering an intuitive platform to create, backtest, and automate trading strategies. While identifying signals is often straightforward, the real challenge in trading lies in managing risk and knowing when not to trade. It equips users with advanced tools to address this challenge, promoting disciplined decision-making and structured trading practices.
This is not just a collection of indicators but a comprehensive toolkit that helps identify high-quality opportunities while placing risk management at the core of every strategy. By integrating customizable filters, robust controls, and automation capabilities, it empowers traders to align their strategies with their unique objectives and risk tolerance.
_____________________________________
🛡 THE GOAL: SHIELD YOUR STRATEGY
The mission is simple: to shield your strategy from bad trades . Whether you're a seasoned trader or just starting, the hardest part of trading isn’t finding signals—it’s avoiding trades that can harm your account. This framework prioritizes quality over quantity , helping filter out suboptimal setups and encouraging disciplined execution.
With tools to manage risk, avoid overtrading, and adapt to changing market conditions, it protects your strategy against impulsive decisions and market volatility.
_____________________________________
🛡 HOW TO USE IT
1. Apply Higher Timeframe Filters
Begin by analyzing broader market trends using tools like the 200 EMA, Ichimoku Cloud, or Supertrend on higher timeframes (e.g., daily or 4-hour charts).
- Example: Ensure the price is above the 200 EMA on the daily chart for long trades or below it for short trades.
2. Identify the Appropriate Entry Signal
Choose an entry signal that aligns with your model and the asset you're trading. Options include:
Supertrend changes for trend reversals.
Bollinger Band touches for mean-reversion trades.
RSI strength/weakness for overbought or oversold conditions.
Breakouts of key levels (e.g., daily or weekly highs/lows) for momentum trades.
MACD and TSI flips.
3. Determine Take-Profit and Stop-Loss Levels
Set clear exit strategies to protect your capital and lock in profits:
Use single, dual, or triple take-profit levels based on percentages or price levels.
Choose a stop-loss type, such as fixed percentage, ATR-based, or trailing stops.
Optionally, set breakeven adjustments after hitting your first take-profit target.
4. Apply Risk Management Filters
Incorporate risk controls to ensure disciplined execution:
Limit the number of trades per day, week, or month to avoid overtrading.
Use time-based filters to trade during specific sessions or custom windows.
Avoid trading around high-impact news events with region-specific filters.
5. Automate and Execute
Leverage the advanced automation features to streamline execution. Alerts are tailored specifically for each supported platform, ensuring seamless integration with tools like PineConnector, 3Commas, Zapier, and more.
_____________________________________
🛡 CORE FOCUS: RISK MANAGEMENT, AUTOMATION, AND DISCIPLINED TRADING
This builder emphasizes quality over quantity, encouraging traders to approach markets with structure and control. Its innovative tools for risk management and automation help optimize performance while reducing effort, fostering consistency and long-term success.
_____________________________________
🛡 KEY FEATURES
General Settings
Theme Customization : Light and dark themes for a tailored interface.
Timezone Adjustment : Align session times and news schedules with your local timezone.
Position Sizing : Define lot sizes to manage risk effectively.
Directional Control : Choose between long-only, short-only, or both directions for trading.
Time Filters
Day-of-Week Selection : Enable or disable trading on specific days.
Session-Based Trading : Restrict trades to major market sessions (Asia, London, New York) or custom windows.
Custom Time Windows : Precisely control the timeframes for trade execution.
Risk Management Tools
Trade Limits : Maximum trades per day, week, or month to avoid overtrading.
Automatic Trade Closures : End-of-session, end-of-day, or end-of-week options.
Duration-Based Filters : Close trades if take-profit isn’t reached within a set timeframe or if they remain unprofitable beyond a specific duration.
Stop-Loss and Take-Profit Options : Fixed percentage or ATR-based stop-losses, single/dual/triple take-profit levels, and breakeven stop adjustments.
Economic News Filters
Region-Specific Filters : Exclude trades around major news events in regions like the USA, UK, Europe, Asia, or Oceania.
News Avoidance Windows : Pause trades before and after high-impact events or automatically close trades ahead of scheduled news releases.
Higher Timeframe Filters
Multi-Timeframe Tools : Leverage EMAs, Supertrend, or Ichimoku Cloud on higher timeframes (Daily, 4-hour, etc.) for trend alignment.
Chart Timeframe Filters
Precision Filtering : Apply EMA or ADX-based conditions to refine trade setups on current chart timeframes.
Entry Signals
Customizable Options : Choose from signals like Supertrend, Bollinger Bands, RSI, MACD, Ichimoku Cloud, or EMA pullbacks.
Indicator Parameter Overrides : Fine-tune default settings for specific signals.
Exit Settings
Flexible Take-Profit Targets : Single, dual, or triple targets. Exit at significant levels like daily/weekly highs or lows.
Stop-Loss Variability : Fixed, ATR-based, or trailing stop-loss options.
Alerts and Automation
Third-Party Integrations : Seamlessly connect with platforms like PineConnector, 3Commas, Zapier, and Capitalise.ai.
Precision-Formatted Alerts : Alerts are tailored specifically for each platform, ensuring seamless execution. For example:
- PineConnector alerts include risk-per-trade parameters.
- 3Commas alerts contain bot-specific configurations.
_____________________________________
🛡 PUBLISHED CHART SETTINGS: 15m COMEX:GC1!
Time Filters : Trades are enabled from Tuesday to Friday, as Mondays often lack sufficient data coming off the weekend, and weekends are excluded due to market closures. Custom time sessions are turned off by default, allowing trades throughout the day.
Risk Filters : Risk is tightly controlled by limiting trades to a maximum of 2 per day and enabling a mechanism to close trades if they remain open too long and are unprofitable. Weekly trade closures ensure that no positions are carried over unnecessarily.
Economic News Filters : By default, trades are allowed during economic news periods, giving traders flexibility to decide how to handle volatility manually. It is recommended to enable these filters if you are creating strategies on lower timeframes.
Higher Timeframe Filters : The setup incorporates confluence from higher timeframe indicators. For example, the 200 EMA on the daily timeframe is used to establish trend direction, while the Ichimoku cloud on the 30-minute timeframe adds additional confirmation.
Entry Signals : The strategy triggers trades based on changes in the Supertrend indicator.
Exit Settings : Trades are configured to take partial profits at three levels (1%, 2%, and 3%) and use a fixed stop loss of 2%. Stops are moved to breakeven after reaching the first take profit level.
_____________________________________
🛡 WHY CHOOSE THIS STRATEGY BUILDER?
This tool transforms trading from reactive to proactive, focusing on risk management and automation as the foundation of every strategy. By helping users avoid unnecessary trades, implement robust controls, and automate execution, it fosters disciplined trading.

Milvetti_Pineconnector_LibraryLibrary "Milvetti_Pineconnector_Library"
This library has methods that provide practical signal transmission for Pineconnector.Developed By Milvetti
buy(licenseId, symbol, risk, sl, tp, beTrigger, beOffset, trailTrig, trailDist, trailStep, atrTimeframe, atrTrigger, atrPeriod, atrMultiplier, atrShift, spread, accFilter, secret, comment)
Create a buy order message
Parameters:
licenseId (string) : License Id. This is a unique identifier found in the Pineconnector Licensing Dashboard.
symbol (string) : Symbol. Default is syminfo.ticker
risk (float) : Risk. Function depends on the “Volume Type” selected in the EA
sl (float) : StopLoss. Place stop-loss. Computation is based on the Target Type selected in the EA. Default is 0(inactive)
tp (float) : TakeProfit. Place take-profit. Computation is based on the Target Type selected in the EA. Default is 0(inactive)
beTrigger (float) : Breakeven will be activated after the position gains this number of pips. Ensure > 0
beOffset (float) : Offset from entry price. 0 means the SL will be placed exactly at entry price. 1 means 1 pip above the entry price for buy trades and 1 pip below for sell trades.
trailTrig (int) : Trailing stop-loss will be activated after a trade gains this number of pips. Default is 0(inactive)
trailDist (int) : SL will be opened at traildist after trailtrig is met, even if you do not have a SL placed.. Default is 0(inactive)
trailStep (int) : Moves trailing stop-loss once price moves to favourable by a specified number of pips. Default is 0(inactive)
atrTimeframe (string) : ATR Trailing Stop will be based on the specified timeframe in minutes and will only update once per bar close. Default is Timeframe.Period
atrTrigger (float) : Activate the trigger of ATR Trailing after market moves favourably by a number of pips. Default is 0(inactive)
atrPeriod (int) : ATR averaging period. Default is 0
atrMultiplier (float) : Multiple of ATR to utilise in the new SL computation. Default is 1
atrShift (float) : Relative shift of price information, 0 uses latest candle, 1 uses second last, etc. Default is 0
spread (float) : Enter the position only if the spread is equal or less than the specified value in pips. Default is 0(inactive)
accFilter (float) : Enter the position only if the account requirement is met. Default is 0(inactive)
secret (string)
comment (string) : Comment. Add a string into the order’s comment section. Default is "Symbol+Timeframe"
sell(licenseId, symbol, risk, sl, tp, beTrigger, beOffset, trailTrig, trailDist, trailStep, atrTimeframe, atrTrigger, atrPeriod, atrMultiplier, atrShift, spread, accFilter, secret, comment)
Create a buy order message
Parameters:
licenseId (string) : License Id. This is a unique identifier found in the Pineconnector Licensing Dashboard.
symbol (string) : Symbol. Default is syminfo.ticker
risk (float) : Risk. Function depends on the “Volume Type” selected in the EA
sl (float) : StopLoss. Place stop-loss. Computation is based on the Target Type selected in the EA. Default is 0(inactive)
tp (float) : TakeProfit. Place take-profit. Computation is based on the Target Type selected in the EA. Default is 0(inactive)
beTrigger (float) : Breakeven will be activated after the position gains this number of pips. Ensure > 0
beOffset (float) : Offset from entry price. 0 means the SL will be placed exactly at entry price. 1 means 1 pip above the entry price for buy trades and 1 pip below for sell trades.
trailTrig (int) : Trailing stop-loss will be activated after a trade gains this number of pips. Default is 0(inactive)
trailDist (int) : SL will be opened at traildist after trailtrig is met, even if you do not have a SL placed.. Default is 0(inactive)
trailStep (int) : Moves trailing stop-loss once price moves to favourable by a specified number of pips. Default is 0(inactive)
atrTimeframe (string) : ATR Trailing Stop will be based on the specified timeframe in minutes and will only update once per bar close. Default is Timeframe.Period
atrTrigger (float) : Activate the trigger of ATR Trailing after market moves favourably by a number of pips. Default is 0(inactive)
atrPeriod (int) : ATR averaging period. Default is 0
atrMultiplier (float) : Multiple of ATR to utilise in the new SL computation. Default is 1
atrShift (float) : Relative shift of price information, 0 uses latest candle, 1 uses second last, etc. Default is 0
spread (float) : Enter the position only if the spread is equal or less than the specified value in pips. Default is 0(inactive)
accFilter (float) : Enter the position only if the account requirement is met. Default is 0(inactive)
secret (string)
comment (string) : Comment. Add a string into the order’s comment section. Default is "Symbol+Timeframe"
buyLimit(licenseId, symbol, pending, risk, sl, tp, beTrigger, beOffset, trailTrig, trailDist, trailStep, atrTimeframe, atrTrigger, atrPeriod, atrMultiplier, atrShift, spread, accFilter, secret, comment)
Create a buy limit order message
Parameters:
licenseId (string) : License Id. This is a unique identifier found in the Pineconnector Licensing Dashboard.
symbol (string) : Symbol. Default is syminfo.ticker
pending (float) : Computing pending order entry price. EA Options: Pips, Specified Price, Percentage
risk (float) : Risk. Function depends on the “Volume Type” selected in the EA
sl (float) : StopLoss. Place stop-loss. Computation is based on the Target Type selected in the EA. Default is 0(inactive)
tp (float) : TakeProfit. Place take-profit. Computation is based on the Target Type selected in the EA. Default is 0(inactive)
beTrigger (float) : Breakeven will be activated after the position gains this number of pips. Ensure > 0
beOffset (float) : Offset from entry price. 0 means the SL will be placed exactly at entry price. 1 means 1 pip above the entry price for buy trades and 1 pip below for sell trades.
trailTrig (int) : Trailing stop-loss will be activated after a trade gains this number of pips. Default is 0(inactive)
trailDist (int) : SL will be opened at traildist after trailtrig is met, even if you do not have a SL placed.. Default is 0(inactive)
trailStep (int) : Moves trailing stop-loss once price moves to favourable by a specified number of pips. Default is 0(inactive)
atrTimeframe (string) : ATR Trailing Stop will be based on the specified timeframe in minutes and will only update once per bar close. Default is Timeframe.Period
atrTrigger (float) : Activate the trigger of ATR Trailing after market moves favourably by a number of pips. Default is 0(inactive)
atrPeriod (int) : ATR averaging period. Default is 0
atrMultiplier (float) : Multiple of ATR to utilise in the new SL computation. Default is 1
atrShift (float) : Relative shift of price information, 0 uses latest candle, 1 uses second last, etc. Default is 0
spread (float) : Enter the position only if the spread is equal or less than the specified value in pips. Default is 0(inactive)
accFilter (float) : Enter the position only if the account requirement is met. Default is 0(inactive)
secret (string)
comment (string) : Comment. Add a string into the order’s comment section. Default is "Symbol+Timeframe"
buyStop(licenseId, symbol, pending, risk, sl, tp, beTrigger, beOffset, trailTrig, trailDist, trailStep, atrTimeframe, atrTrigger, atrPeriod, atrMultiplier, atrShift, spread, accFilter, secret, comment)
Create a buy stop order message
Parameters:
licenseId (string) : License Id. This is a unique identifier found in the Pineconnector Licensing Dashboard.
symbol (string) : Symbol. Default is syminfo.ticker
pending (float) : Computing pending order entry price. EA Options: Pips, Specified Price, Percentage
risk (float) : Risk. Function depends on the “Volume Type” selected in the EA
sl (float) : StopLoss. Place stop-loss. Computation is based on the Target Type selected in the EA. Default is 0(inactive)
tp (float) : TakeProfit. Place take-profit. Computation is based on the Target Type selected in the EA. Default is 0(inactive)
beTrigger (float) : Breakeven will be activated after the position gains this number of pips. Ensure > 0
beOffset (float) : Offset from entry price. 0 means the SL will be placed exactly at entry price. 1 means 1 pip above the entry price for buy trades and 1 pip below for sell trades.
trailTrig (int) : Trailing stop-loss will be activated after a trade gains this number of pips. Default is 0(inactive)
trailDist (int) : SL will be opened at traildist after trailtrig is met, even if you do not have a SL placed.. Default is 0(inactive)
trailStep (int) : Moves trailing stop-loss once price moves to favourable by a specified number of pips. Default is 0(inactive)
atrTimeframe (string) : ATR Trailing Stop will be based on the specified timeframe in minutes and will only update once per bar close. Default is Timeframe.Period
atrTrigger (float) : Activate the trigger of ATR Trailing after market moves favourably by a number of pips. Default is 0(inactive)
atrPeriod (int) : ATR averaging period. Default is 0
atrMultiplier (float) : Multiple of ATR to utilise in the new SL computation. Default is 1
atrShift (float) : Relative shift of price information, 0 uses latest candle, 1 uses second last, etc. Default is 0
spread (float) : Enter the position only if the spread is equal or less than the specified value in pips. Default is 0(inactive)
accFilter (float) : Enter the position only if the account requirement is met. Default is 0(inactive)
secret (string)
comment (string) : Comment. Add a string into the order’s comment section. Default is "Symbol+Timeframe"
sellLimit(licenseId, symbol, pending, risk, sl, tp, beTrigger, beOffset, trailTrig, trailDist, trailStep, atrTimeframe, atrTrigger, atrPeriod, atrMultiplier, atrShift, spread, accFilter, secret, comment)
Create a sell limit order message
Parameters:
licenseId (string) : License Id. This is a unique identifier found in the Pineconnector Licensing Dashboard.
symbol (string) : Symbol. Default is syminfo.ticker
pending (float) : Computing pending order entry price. EA Options: Pips, Specified Price, Percentage
risk (float) : Risk. Function depends on the “Volume Type” selected in the EA
sl (float) : StopLoss. Place stop-loss. Computation is based on the Target Type selected in the EA. Default is 0(inactive)
tp (float) : TakeProfit. Place take-profit. Computation is based on the Target Type selected in the EA. Default is 0(inactive)
beTrigger (float) : Breakeven will be activated after the position gains this number of pips. Ensure > 0
beOffset (float) : Offset from entry price. 0 means the SL will be placed exactly at entry price. 1 means 1 pip above the entry price for buy trades and 1 pip below for sell trades.
trailTrig (int) : Trailing stop-loss will be activated after a trade gains this number of pips. Default is 0(inactive)
trailDist (int) : SL will be opened at traildist after trailtrig is met, even if you do not have a SL placed.. Default is 0(inactive)
trailStep (int) : Moves trailing stop-loss once price moves to favourable by a specified number of pips. Default is 0(inactive)
atrTimeframe (string) : ATR Trailing Stop will be based on the specified timeframe in minutes and will only update once per bar close. Default is Timeframe.Period
atrTrigger (float) : Activate the trigger of ATR Trailing after market moves favourably by a number of pips. Default is 0(inactive)
atrPeriod (int) : ATR averaging period. Default is 0
atrMultiplier (float) : Multiple of ATR to utilise in the new SL computation. Default is 1
atrShift (float) : Relative shift of price information, 0 uses latest candle, 1 uses second last, etc. Default is 0
spread (float) : Enter the position only if the spread is equal or less than the specified value in pips. Default is 0(inactive)
accFilter (float) : Enter the position only if the account requirement is met. Default is 0(inactive)
secret (string)
comment (string) : Comment. Add a string into the order’s comment section. Default is "Symbol+Timeframe"
sellStop(licenseId, symbol, pending, risk, sl, tp, beTrigger, beOffset, trailTrig, trailDist, trailStep, atrTimeframe, atrTrigger, atrPeriod, atrMultiplier, atrShift, spread, accFilter, secret, comment)
Create a sell stop order message
Parameters:
licenseId (string) : License Id. This is a unique identifier found in the Pineconnector Licensing Dashboard.
symbol (string) : Symbol. Default is syminfo.ticker
pending (float) : Computing pending order entry price. EA Options: Pips, Specified Price, Percentage
risk (float) : Risk. Function depends on the “Volume Type” selected in the EA
sl (float) : StopLoss. Place stop-loss. Computation is based on the Target Type selected in the EA. Default is 0(inactive)
tp (float) : TakeProfit. Place take-profit. Computation is based on the Target Type selected in the EA. Default is 0(inactive)
beTrigger (float) : Breakeven will be activated after the position gains this number of pips. Ensure > 0
beOffset (float) : Offset from entry price. 0 means the SL will be placed exactly at entry price. 1 means 1 pip above the entry price for buy trades and 1 pip below for sell trades.
trailTrig (int) : Trailing stop-loss will be activated after a trade gains this number of pips. Default is 0(inactive)
trailDist (int) : SL will be opened at traildist after trailtrig is met, even if you do not have a SL placed.. Default is 0(inactive)
trailStep (int) : Moves trailing stop-loss once price moves to favourable by a specified number of pips. Default is 0(inactive)
atrTimeframe (string) : ATR Trailing Stop will be based on the specified timeframe in minutes and will only update once per bar close. Default is Timeframe.Period
atrTrigger (float) : Activate the trigger of ATR Trailing after market moves favourably by a number of pips. Default is 0(inactive)
atrPeriod (int) : ATR averaging period. Default is 0
atrMultiplier (float) : Multiple of ATR to utilise in the new SL computation. Default is 1
atrShift (float) : Relative shift of price information, 0 uses latest candle, 1 uses second last, etc. Default is 0
spread (float) : Enter the position only if the spread is equal or less than the specified value in pips. Default is 0(inactive)
accFilter (float) : Enter the position only if the account requirement is met. Default is 0(inactive)
secret (string)
comment (string) : Comment. Add a string into the order’s comment section. Default is "Symbol+Timeframe"

Milvetti_TraderPost_LibraryLibrary "Milvetti_TraderPost_Library"
This library has methods that provide practical signal transmission for traderpost.Developed By Milvetti
cancelOrders(symbol)
This method generates a signal in JSON format that cancels all orders for the specified pair. (If you want to cancel stop loss and takeprofit orders together, use the “exitOrder” method.
Parameters:
symbol (string)
exitOrders(symbol)
This method generates a signal in JSON format that close all orders for the specified pair.
Parameters:
symbol (string)
createOrder(ticker, positionType, orderType, entryPrice, signalPrice, qtyType, qty, stopLoss, stopType, stopValue, takeProfit, profitType, profitValue, timeInForce)
This function is designed to send buy or sell orders to traderpost. It can create customized orders by flexibly specifying parameters such as order type, position type, entry price, quantity calculation method, stop-loss, and take-profit. The purpose of the function is to consolidate all necessary details for opening a position into a single structure and present it as a structured JSON output. This format can be sent to trading platforms via webhooks.
Parameters:
ticker (string) : The ticker symbol of the instrument. Default value is the current chart's ticker (syminfo.ticker).
positionType (string) : Determines the type of order (e.g., "long" or "buy" for buying and "short" or "sell" for selling).
orderType (string) : Defines the order type for execution. Options: "market", "limit", "stop". Default is "market"
entryPrice (float) : The price level for entry orders. Only applicable for limit or stop orders. Default is 0 (market orders ignore this).
signalPrice (float) : Optional. Only necessary when using relative take profit or stop losses, and the broker does not support fetching quotes to perform the calculation. Default is 0
qtyType (string) : Determines how the order quantity is calculated. Options: "fixed_quantity", "dollar_amount", "percent_of_equity", "percent_of_position".
qty (float) : Quantity value. Can represent units of shares/contracts or a dollar amount, depending on qtyType.
stopLoss (bool) : Enable or disable stop-loss functionality. Set to `true` to activate.
stopType (string) : Specifies the stop-loss calculation type. Options: percent, "amount", "stopPrice", "trailPercent", "trailAmount". Default is "stopPrice"
stopValue (float) : Stop-loss value based on stopType. Can be a percentage, dollar amount, or a specific stop price. Default is "stopPrice"
takeProfit (bool) : Enable or disable take-profit functionality. Set to `true` to activate.
profitType (string) : Specifies the take-profit calculation type. Options: "percent", "amount", "limitPrice". Default is "limitPrice"
profitValue (float) : Take-profit value based on profitType. Can be a percentage, dollar amount, or a specific limit price. Default is 0
timeInForce (string) : The time in force for your order. Options: day, gtc, opg, cls, ioc and fok
Returns: Return result in Json format.
addTsl(symbol, stopType, stopValue, price)
This method adds trailing stop loss to the current position. “Price” is the trailing stop loss starting level. You can leave price blank if you want it to start immediately
Parameters:
symbol (string)
stopType (string) : Specifies the trailing stoploss calculation type. Options: "trailPercent", "trailAmount".
stopValue (float) : Stop-loss value based on stopType. Can be a percentage, dollar amount.
price (float) : The trailing stop loss starting level. You can leave price blank if you want it to start immediately. Default is current price.
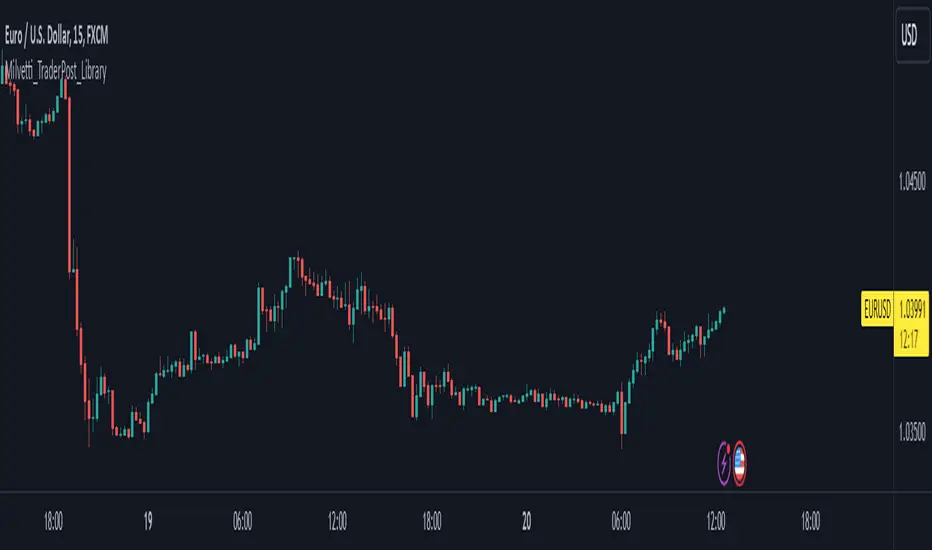
DAILY Supertrend + EMA Crossover with RSI FilterThis strategy is a technical trading approach that combines multiple indicators—Supertrend, Exponential Moving Averages (EMAs), and the Relative Strength Index (RSI)—to identify and manage trades.
Core Components:
1. Exponential Moving Averages (EMAs):
Two EMAs, one with a shorter period (fast) and one with a longer period (slow), are calculated. The idea is to spot when the faster EMA crosses above or below the slower EMA. A fast EMA crossing above the slow EMA often suggests upward momentum, while crossing below suggests downward momentum.
2. Supertrend Indicator:
The Supertrend uses Average True Range (ATR) to establish dynamic support and resistance lines. These lines shift above or below price depending on the prevailing trend. When price is above the Supertrend line, the trend is considered bullish; when below, it’s considered bearish. This helps ensure that the strategy trades only in the direction of the overall trend rather than against it.
3. RSI Filter:
The RSI measures momentum. It helps avoid buying into markets that are already overbought or selling into markets that are oversold. For example, when going long (buying), the strategy only proceeds if the RSI is not too high, and when going short (selling), it only proceeds if the RSI is not too low. This filter is meant to improve the quality of the trades by reducing the chance of entering right before a reversal.
4. Time Filters:
The strategy only triggers entries during user-specified date and time ranges. This is useful if one wants to limit trading activity to certain trading sessions or periods with higher market liquidity.
5. Risk Management via ATR-based Stops and Targets:
Both stop loss and take profit levels are set as multiples of the ATR. ATR measures volatility, so when volatility is higher, both stops and profit targets adjust to give the trade more breathing room. Conversely, when volatility is low, stops and targets tighten. This dynamic approach helps maintain consistent risk management regardless of market conditions.
Overall Logic Flow:
- First, the market conditions are analyzed through EMAs, Supertrend, and RSI.
- When a buy (long) condition is met—meaning the fast EMA crosses above the slow EMA, the trend is bullish according to Supertrend, and RSI is below the specified “overbought” threshold—the strategy initiates or adds to a long position.
- Similarly, when a sell (short) condition is met—meaning the fast EMA crosses below the slow EMA, the trend is bearish, and RSI is above the specified “oversold” threshold—it initiates or adds to a short position.
- Each position is protected by an automatically calculated stop loss and a take profit level based on ATR multiples.
Intended Result:
By blending trend detection, momentum filtering, and volatility-adjusted risk management, the strategy aims to capture moves in the primary trend direction while avoiding entries at excessively stretched prices. Allowing multiple entries can potentially amplify gains in strong trends but also increases exposure, which traders should consider in their risk management approach.
In essence, this strategy tries to ride established trends as indicated by the Supertrend and EMAs, filter out poor-quality entries using RSI, and dynamically manage trade risk through ATR-based stops and targets.

DemaRSI StrategyThis is a repost to a old script that cant be updated anymore, the request was made on Feb, 27, 2016.
Here's a engaging description for the tradingview script:
**DemaRSI Strategy: A Proven Trading System**
Join thousands of traders who have already experienced the power of this highly effective strategy. The DemaRSI system combines two powerful indicators - DEMA (Double Exponential Moving Average) and RSI (Relative Strength Index) - to generate profitable trades with minimal risk.
**Key Features:**
* **Trend-Following**: Our algorithm identifies strong trends using a combination of DEMA and RSI, allowing you to ride the waves of market momentum.
* **Risk Management**: The system includes built-in stop-loss and take-profit levels, ensuring that your gains are protected and losses are minimized.
* **Session-Based Trading**: Trade during specific sessions only (e.g., London or New York) for even more targeted results.
* **Customizable Settings**: Adjust the length of moving averages, RSI periods, and other parameters to suit your trading style.
**What You'll Get:**
* A comprehensive strategy that can be used with any broker or platform
* Easy-to-use interface with customizable settings
* Real-time performance metrics and backtesting capabilities
**Start Trading Like a Pro Today!**
This script is designed for intermediate to advanced traders who want to take their trading game to the next level. With its robust risk management features, this strategy can help you achieve consistent profits in various market conditions.
**Disclaimer:** This script is not intended as investment advice and should be used at your own discretion. Trading carries inherent risks, and losses are possible.
~Llama3

MicuRobert EMA Cross StrategyThis is a repost of a old strategy that cant be updated anymore, it was a request for a user made in Oct, 6, 2015
Here's a possible engaging description for the tradingview script:
**MicuRobert EMA Cross V2: A Powerful Trading Strategy**
Join the ranks of successful traders with this advanced strategy, designed to help you profit from market trends. The MicuRobert EMA Cross V2 combines two essential indicators - Exponential Moving Average (EMA) and Divergence EMA (DEMA) - to generate buy and sell signals.
**Key Features:**
* **Trading Session Filter**: Only trade during your preferred session, ensuring you're in sync with market conditions.
* **Trailing Stop**: Automatically adjust stop-loss levels to lock in profits or limit losses.
* **Customizable Trade Size**: Set the size of each trade based on your risk tolerance and trading goals.
**How it Works:**
The script uses two EMAs (5-period and 34-period) to identify trends. When the shorter EMA crosses above the longer one, a buy signal is generated. Conversely, when the shorter EMA falls below the longer one, a sell signal is triggered. The strategy also incorporates divergence analysis between price action and the EMAs.
**Visual Aids:**
* **EMA Plots**: Visualize the two EMAs on your chart to gauge market momentum.
* **Buy/Sell Signals**: See when buy or sell signals are generated, along with their corresponding entry prices.
* **Trailing Stop Lines**: Monitor stop-loss levels as they adjust based on price action.
**Get Started:**
Download this script and start trading like a pro! With its robust features and customizable settings, the MicuRobert EMA Cross V2 is an excellent addition to any trader's arsenal.
~Llama3

EMA SCALPING SUITE v1.0 [1M-5M]EMA SCALPING SUITE v1.0
A scalping indicator designed for quick entries on lower timeframes, combining EMA
stacks with volume confirmation and automatic risk management levels.
CORE FEATURES:
1. EMA Stack System:
- 50 EMA (Blue): Fastest trend
- 100 EMA (Yellow): Entry trigger line
- 150 EMA (Orange): Stop loss reference
- 200 EMA (Red): Base trend
2. Entry System:
- LONG: When price dips to 100 EMA during bullish fan
- SHORT: When price rises to 100 EMA during bearish fan
- Signals shown as triangles at entry points
3. Risk Management:
- Auto Stop Loss: 150 EMA (red line)
- Auto Take Profit: Based on RR ratio (green line)
- Entry Price Marker: Current close (blue line)
4. Volume Confirmation:
- High volume dots (>1.5x average)
- Filters out weak signals
- Adjustable sensitivity
HOW IT WORKS:
1. Wait for EMAs to fan out (trend alignment)
2. Look for price to touch 100 EMA
3. Check for volume confirmation
4. Enter when signal appears
5. Use auto-generated SL and TP levels
BEST TIMEFRAMES:
- Primary: 1 minute
- Secondary: 3-5 minutes
- Not recommended: >15 minutes
RECOMMENDED SETTINGS:
- Volume Filter: ON
- Volume Multiplier: 1.5
- Risk:Reward: 1.5

Gold Friday Anomaly StrategyThis script implements the " Gold Friday Anomaly Strategy ," a well-known historical trading strategy that leverages the gold market's behavior from Thursday evening to Friday close. It is a backtesting-focused strategy designed to assess the historical performance of this pattern. Traders use this anomaly as it captures a recurring market tendency observed over the years.
What It Does:
Entry Condition: The strategy enters a long position at the beginning of the Friday trading session (Thursday evening close) within the defined backtesting period.
Exit Condition: Friday evening close.
Backtesting Controls: Allows users to set custom backtesting periods to evaluate strategy performance over specific date ranges.
Key Features:
Custom Backtest Periods: Easily configurable inputs to set the start and end date of the backtesting range.
Fixed Slippage and Commission Settings: Ensures realistic simulation of trading conditions.
Process Orders on Close: Backtesting is optimized by processing orders at the bar's close.
Important Notes:
Backtesting Only: This script is intended purely for backtesting purposes. Past performance is not indicative of future results.
Live Trading Recommendations: For live trading, it is highly recommended to use limit orders instead of market orders, especially during evening sessions, as market order slippage can be significant.
Default Settings:
Entry size: 10% of equity per trade.
Slippage: 1 tick.
Commission: 0.05% per trade.
