Chande Kroll Trend Strategy (SPX, 1H) | PINEINDICATORSThe "Chande Kroll Stop Strategy" is designed to optimize trading on the SPX using a 1-hour timeframe. This strategy effectively combines the Chande Kroll Stop indicator with a Simple Moving Average (SMA) to create a robust method for identifying long entry and exit points. This detailed description will explain the components, rationale, and usage to ensure compliance with TradingView's guidelines and help traders understand the strategy's utility and application.
Objective
The primary goal of this strategy is to identify potential long trading opportunities in the SPX by leveraging volatility-adjusted stop levels and trend-following principles. It aims to capture upward price movements while managing risk through dynamically calculated stops.
Chande Kroll Stop Parameters:
Calculation Mode: Offers "Linear" and "Exponential" options for position size calculation. The default mode is "Exponential."
Risk Multiplier: An adjustable multiplier for risk management and position sizing, defaulting to 5.
ATR Period: Defines the period for calculating the Average True Range (ATR), with a default of 10.
ATR Multiplier: A multiplier applied to the ATR to set stop levels, defaulting to 3.
Stop Length: Period used to determine the highest high and lowest low for stop calculation, defaulting to 21.
SMA Length: Period for the Simple Moving Average, defaulting to 21.
Calculation Details:
ATR Calculation: ATR is calculated over the specified period to measure market volatility.
Chande Kroll Stop Calculation:
High Stop: The highest high over the stop length minus the ATR multiplied by the ATR multiplier.
Low Stop: The lowest low over the stop length plus the ATR multiplied by the ATR multiplier.
SMA Calculation: The 21-period SMA of the closing price is used as a trend filter.
Entry and Exit Conditions:
Long Entry: A long position is initiated when the closing price crosses over the low stop and is above the 21-period SMA. This condition ensures that the market is trending upward and that the entry is made in the direction of the prevailing trend.
Exit Long: The long position is exited when the closing price falls below the high stop, indicating potential downward movement and protecting against significant drawdowns.
Position Sizing:
The quantity of shares to trade is calculated based on the selected calculation mode (linear or exponential) and the risk multiplier. This ensures position size is adjusted dynamically based on current market conditions and user-defined risk tolerance.
Exponential Mode: Quantity is calculated using the formula: riskMultiplier / lowestClose * 1000 * strategy.equity / strategy.initial_capital.
Linear Mode: Quantity is calculated using the formula: riskMultiplier / lowestClose * 1000.
Execution:
When the long entry condition is met, the strategy triggers a buy signal, and a long position is entered with the calculated quantity. An alert is generated to notify the trader.
When the exit condition is met, the strategy closes the position and triggers a sell signal, accompanied by an alert.
Plotting:
Buy Signals: Indicated with an upward triangle below the bar.
Sell Signals: Indicated with a downward triangle above the bar.
Application
This strategy is particularly effective for trading the SPX on a 1-hour timeframe, capitalizing on price movements by adjusting stop levels dynamically based on market volatility and trend direction.
Default Setup
Initial Capital: $1,000
Risk Multiplier: 5
ATR Period: 10
ATR Multiplier: 3
Stop Length: 21
SMA Length: 21
Commission: 0.01
Slippage: 3 Ticks
Backtesting Results
Backtesting indicates that the "Chande Kroll Stop Strategy" performs optimally on the SPX when applied to the 1-hour timeframe. The strategy's dynamic adjustment of stop levels helps manage risk effectively while capturing significant upward price movements. Backtesting was conducted with a realistic initial capital of $1,000, and commissions and slippage were included to ensure the results are not misleading.
Risk Management
The strategy incorporates risk management through dynamically calculated stop levels based on the ATR and a user-defined risk multiplier. This approach ensures that position sizes are adjusted according to market volatility, helping to mitigate potential losses. Trades are sized to risk a sustainable amount of equity, adhering to the guideline of risking no more than 5-10% per trade.
Usage Notes
Customization: Users can adjust the ATR period, ATR multiplier, stop length, and SMA length to better suit their trading style and risk tolerance.
Alerts: The strategy includes alerts for buy and sell signals to keep traders informed of potential entry and exit points.
Pyramiding: Although possible, the strategy yields the best results without pyramiding.
Justification of Components
The Chande Kroll Stop indicator and the 21-period SMA are combined to provide a robust framework for identifying long trading opportunities in trending markets. Here is why they work well together:
Chande Kroll Stop Indicator: This indicator provides dynamic stop levels that adapt to market volatility, allowing traders to set logical stop-loss levels that account for current price movements. It is particularly useful in volatile markets where fixed stops can be easily hit by random price fluctuations. By using the ATR, the stop levels adjust based on recent market activity, ensuring they remain relevant in varying market conditions.
21-Period SMA: The 21-period SMA acts as a trend filter to ensure trades are taken in the direction of the prevailing market trend. By requiring the closing price to be above the SMA for long entries, the strategy aligns itself with the broader market trend, reducing the risk of entering trades against the overall market direction. This helps to avoid false signals and ensures that the trades are in line with the dominant market movement.
Combining these two components creates a balanced approach that captures trending price movements while protecting against significant drawdowns through adaptive stop levels. The Chande Kroll Stop ensures that the stops are placed at levels that reflect current volatility, while the SMA filter ensures that trades are only taken when the market is trending in the desired direction.
Concepts Underlying Calculations
ATR (Average True Range): Used to measure market volatility, which informs the stop levels.
SMA (Simple Moving Average): Used to filter trades, ensuring positions are taken in the direction of the trend.
Chande Kroll Stop: Combines high and low price levels with ATR to create dynamic stop levels that adapt to market conditions.
Risk Disclaimer
Trading involves substantial risk, and most day traders incur losses. The "Chande Kroll Stop Strategy" is provided for informational and educational purposes only. Past performance is not indicative of future results. Users are advised to adjust and personalize this trading strategy to better match their individual trading preferences and risk tolerance.
Strategy!

Intelle_city - World Cycle - Ath & Atl - Logarithmic - Strategy.Overview
Indicators: Strategy !
INTELLECT_city - World Cycle - ATH & ATL - Timeframe 1D and 1W - Logarithmic - Strategy - The Pi Cycle Top and Bottom Oscillator is an adaptation of the original Pi Cycle Top chart. It compares the 111-Day Moving Average circle and the 2 * 350-Day Moving Average circle of Bitcoin’s Price. These two moving averages were selected as 350 / 111 = 3.153; An approximation of the important mathematical number Pi.
When the 111-Day Moving Average circle reaches the 2 * 350-Day Moving Average circle, it indicates that the market is becoming overheated. That is because the mid time frame momentum reference of the 111-Day Moving Average has caught up with the long timeframe momentum reference of the 2 * 350-Day Moving Average.
Historically this has occurred within 3 days of the very top of each market cycle.
When the 111 Day Moving Average circle falls back beneath the 2 * 350 Day Moving Average circle, it indicates that the market momentum of that cycle is significantly cooling down. The oscillator drops down into the lower green band shown where the 111 Day Moving Average is moving at a 75% discount relative to the 2 * 350 Day Moving Average.
Historically, this has highlighted broad areas of bear market lows.
IMPORTANT: You need to set a LOGARITHMIC graph. (The function is located at the bottom right of the screen)
IMPORTANT: The INTELLECT_city indicator is made for a buy-sell strategy; there is also a signal indicator from INTELLECT_city
IMPORTANT: The Chart shows all cycles, both buying and selling.
IMPORTANT: Suitable timeframes are 1 daily (recommended) and 1 weekly
-----------------------------
Описание на русском:
-----------------------------
Обзор индикатора
INTELLECT_city - World Cycle - ATH & ATL - Timeframe 1D and 1W - Logarithmic - Strategy - Логарифмический - Сигнал - Осциллятор вершины и основания цикла Пи представляет собой адаптацию оригинального графика вершины цикла Пи. Он сравнивает круг 111-дневной скользящей средней и круг 2 * 350-дневной скользящей средней цены Биткойна. Эти две скользящие средние были выбраны как 350/111 = 3,153; Приближение важного математического числа Пи.
Когда круг 111-дневной скользящей средней достигает круга 2 * 350-дневной скользящей средней, это указывает на то, что рынок перегревается. Это происходит потому, что опорный моментум среднего временного интервала 111-дневной скользящей средней догнал опорный момент импульса длинного таймфрейма 2 * 350-дневной скользящей средней.
Исторически это происходило в течение трех дней после вершины каждого рыночного цикла.
Когда круг 111-дневной скользящей средней опускается ниже круга 2 * 350-дневной скользящей средней, это указывает на то, что рыночный импульс этого цикла значительно снижается. Осциллятор опускается в нижнюю зеленую полосу, показанную там, где 111-дневная скользящая средняя движется со скидкой 75% относительно 2 * 350-дневной скользящей средней.
Исторически это высветило широкие области минимумов медвежьего рынка.
ВАЖНО: Выставлять нужно ЛОГАРИФМИЧЕСКИЙ график. (Находиться функция с правой нижней части экрана)
ВАЖНО: Индикатор INTELLECT_city сделан для стратегии покупок продаж, есть также и сигнальный от INTELLECT_сity
ВАЖНО: На Графике видны все циклы, как на покупку так и на продажу.
ВАЖНО: Подходящие таймфреймы 1 дневной (рекомендовано) и 1 недельный
-----------------------------
Beschreibung - Deutsch
-----------------------------
Indikatorübersicht
INTELLECT_city – Weltzyklus – ATH & ATL – Zeitrahmen 1T und 1W – Logarithmisch – Strategy – Der Pi-Zyklus-Top- und Bottom-Oszillator ist eine Anpassung des ursprünglichen Pi-Zyklus-Top-Diagramms. Er vergleicht den 111-Tage-Gleitenden-Durchschnittskreis und den 2 * 350-Tage-Gleitenden-Durchschnittskreis des Bitcoin-Preises. Diese beiden gleitenden Durchschnitte wurden als 350 / 111 = 3,153 ausgewählt; eine Annäherung an die wichtige mathematische Zahl Pi.
Wenn der 111-Tage-Gleitenden-Durchschnittskreis den 2 * 350-Tage-Gleitenden-Durchschnittskreis erreicht, deutet dies darauf hin, dass der Markt überhitzt. Das liegt daran, dass der Momentum-Referenzwert des 111-Tage-Gleitenden-Durchschnitts im mittleren Zeitrahmen den Momentum-Referenzwert des 2 * 350-Tage-Gleitenden-Durchschnitts im langen Zeitrahmen eingeholt hat.
Historisch gesehen geschah dies innerhalb von 3 Tagen nach dem Höhepunkt jedes Marktzyklus.
Wenn der Kreis des 111-Tage-Durchschnitts wieder unter den Kreis des 2 x 350-Tage-Durchschnitts fällt, deutet dies darauf hin, dass die Marktdynamik dieses Zyklus deutlich nachlässt. Der Oszillator fällt in das untere grüne Band, in dem der 111-Tage-Durchschnitt mit einem Abschlag von 75 % gegenüber dem 2 x 350-Tage-Durchschnitt verläuft.
Historisch hat dies breite Bereiche mit Tiefstständen in der Baisse hervorgehoben.
WICHTIG: Sie müssen ein logarithmisches Diagramm festlegen. (Die Funktion befindet sich unten rechts auf dem Bildschirm)
WICHTIG: Der INTELLECT_city-Indikator ist für eine Kauf-Verkaufs-Strategie konzipiert; es gibt auch einen Signalindikator von INTELLECT_city
WICHTIG: Das Diagramm zeigt alle Zyklen, sowohl Kauf- als auch Verkaufszyklen.
WICHTIG: Geeignete Zeitrahmen sind 1 täglich (empfohlen) und 1 wöchentlich

BBTrend w SuperTrend decision - Strategy [presentTrading]This strategy aims to improve upon the performance of Traidngview's newly published "BB Trend" indicator by incorporating the SuperTrend for better trade execution and risk management. Enjoy :)
█Introduction and How it is Different
The "BBTrend w SuperTrend decision - Strategy " is a trading strategy designed to identify market trends using Bollinger Bands and SuperTrend indicators. What sets this strategy apart is its use of two Bollinger Bands with different lengths to capture both short-term and long-term market trends, providing a more comprehensive view of market dynamics. Additionally, the strategy includes customizable take profit (TP) and stop loss (SL) settings, allowing traders to tailor their risk management according to their preferences.
BTCUSD 4h Long Performance
█ Strategy, How It Works: Detailed Explanation
The BBTrend strategy employs two key indicators: Bollinger Bands and SuperTrend.
🔶 Bollinger Bands Calculation:
- Short Bollinger Bands**: Calculated using a shorter period (default 20).
- Long Bollinger Bands**: Calculated using a longer period (default 50).
- Bollinger Bands use the standard deviation of price data to create upper and lower bands around a moving average.
Upper Band = Middle Band + (k * Standard Deviation)
Lower Band = Middle Band - (k * Standard Deviation)
🔶 BBTrend Indicator:
- The BBTrend indicator is derived from the absolute differences between the short and long Bollinger Bands' lower and upper values.
BBTrend = (|Short Lower - Long Lower| - |Short Upper - Long Upper|) / Short Middle * 100
🔶 SuperTrend Indicator:
- The SuperTrend indicator is calculated using the average true range (ATR) and a multiplier. It helps identify the market trend direction by plotting levels above and below the price, which act as dynamic support and resistance levels. * @EliCobra makes the SuperTrend Toolkit. He is GOAT.
SuperTrend Upper = HL2 + (Factor * ATR)
SuperTrend Lower = HL2 - (Factor * ATR)
The strategy determines market trends by checking if the close price is above or below the SuperTrend values:
- Uptrend: Close price is above the SuperTrend lower band.
- Downtrend: Close price is below the SuperTrend upper band.
Short: 10 Long: 20 std 2
Short: 20 Long: 40 std 2
Short: 20 Long: 40 std 4
█ Trade Direction
The strategy allows traders to choose their trading direction:
- Long: Enter long positions only.
- Short: Enter short positions only.
- Both: Enter both long and short positions based on market conditions.
█ Usage
To use the "BBTrend - Strategy " effectively:
1. Configure Inputs: Adjust the Bollinger Bands lengths, standard deviation multiplier, and SuperTrend settings.
2. Set TPSL Conditions: Choose the take profit and stop loss percentages to manage risk.
3. Choose Trade Direction: Decide whether to trade long, short, or both directions.
4. Apply Strategy: Apply the strategy to your chart and monitor the signals for potential trades.
█ Default Settings
The default settings are designed to provide a balance between sensitivity and stability:
- Short BB Length (20): Captures short-term market trends.
- Long BB Length (50): Captures long-term market trends.
- StdDev (2.0): Determines the width of the Bollinger Bands.
- SuperTrend Length (10): Period for calculating the ATR.
- SuperTrend Factor (12): Multiplier for the ATR to adjust the SuperTrend sensitivity.
- Take Profit (30%): Sets the level at which profits are taken.
- Stop Loss (20%): Sets the level at which losses are cut to manage risk.
Effect on Performance
- Short BB Length: A shorter length makes the strategy more responsive to recent price changes but can generate more false signals.
- Long BB Length: A longer length provides smoother trend signals but may be slower to react to price changes.
- StdDev: Higher values create wider bands, reducing the frequency of signals but increasing their reliability.
- SuperTrend Length and Factor: Shorter lengths and higher factors make the SuperTrend more sensitive, providing quicker signals but potentially more noise.
- Take Profit and Stop Loss: Adjusting these levels affects the risk-reward ratio. Higher take profit percentages can increase gains but may result in fewer closed trades, while higher stop loss percentages can decrease the likelihood of being stopped out but increase potential losses.

Bitcoin Futures vs. Spot Tri-Frame - Strategy [presentTrading]Prove idea with a backtest is always true for trading.
I developed and open-sourced it as an educational material for crypto traders to understand that the futures and spot spread may be effective but not be as effective as they might think. It serves as an indicator of sentiment rather than a reliable predictor of market trends over certain periods. It is better suited for specific trading environments, which require further research.
█ Introduction and How it is Different
The "Bitcoin Futures vs. Spot Tri-Frame Strategy" utilizes three different timeframes to calculate the Z-Score of the spread between BTC futures and spot prices on Binance and OKX exchanges. The strategy executes long or short trades based on composite Z-Score conditions across the three timeframes.
The spread refers to the difference in price between BTC futures and BTC spot prices, calculated by taking a weighted average of futures prices from multiple exchanges (Binance and OKX) and subtracting a weighted average of spot prices from the same exchanges.
BTCUSD 1D L/S Performance
█ Strategy, How It Works: Detailed Explanation
🔶 Calculation of the Spread
The spread is the difference in price between BTC futures and BTC spot prices. The strategy calculates the spread by taking a weighted average of futures prices from multiple exchanges (Binance and OKX) and subtracting a weighted average of spot prices from the same exchanges. This spread serves as the primary metric for identifying trading opportunities.
Spread = Weighted Average Futures Price - Weighted Average Spot Price
🔶 Z-Score Calculation
The Z-Score measures how many standard deviations the current spread is from its historical mean. This is calculated for each timeframe as follows:
Spread Mean_tf = SMA(Spread_tf, longTermSMA)
Spread StdDev_tf = STDEV(Spread_tf, longTermSMA)
Z-Score_tf = (Spread_tf - Spread Mean_tf) / Spread StdDev_tf
Local performance
🔶 Composite Entry Conditions
The strategy triggers long and short entries based on composite Z-Score conditions across all three timeframes:
- Long Condition: All three Z-Scores must be greater than the long entry threshold.
Long Condition = (Z-Score_tf1 > zScoreLongEntryThreshold) and (Z-Score_tf2 > zScoreLongEntryThreshold) and (Z-Score_tf3 > zScoreLongEntryThreshold)
- Short Condition: All three Z-Scores must be less than the short entry threshold.
Short Condition = (Z-Score_tf1 < zScoreShortEntryThreshold) and (Z-Score_tf2 < zScoreShortEntryThreshold) and (Z-Score_tf3 < zScoreShortEntryThreshold)
█ Trade Direction
The strategy allows the user to specify the trading direction:
- Long: Only long trades are executed.
- Short: Only short trades are executed.
- Both: Both long and short trades are executed based on the Z-Score conditions.
█ Usage
The strategy can be applied to BTC or Crypto trading on major exchanges like Binance and OKX. By leveraging discrepancies between futures and spot prices, traders can exploit market inefficiencies. This strategy is suitable for traders who prefer a statistical approach and want to diversify their timeframes to validate signals.
█ Default Settings
- Input TF 1 (60 minutes): Sets the first timeframe for Z-Score calculation.
- Input TF 2 (120 minutes): Sets the second timeframe for Z-Score calculation.
- Input TF 3 (180 minutes): Sets the third timeframe for Z-Score calculation.
- Long Entry Z-Score Threshold (3): Defines the threshold above which a long trade is triggered.
- Short Entry Z-Score Threshold (-3): Defines the threshold below which a short trade is triggered.
- Long-Term SMA Period (100): The period used to calculate the simple moving average for the spread.
- Use Hold Days (true): Enables holding trades for a specified number of days.
- Hold Days (5): Number of days to hold the trade before exiting.
- TPSL Condition (None): Defines the conditions for taking profit and stop loss.
- Take Profit (%) (30.0): The percentage at which the trade will take profit.
- Stop Loss (%) (20.0): The percentage at which the trade will stop loss.
By fine-tuning these settings, traders can optimize the strategy to suit their risk tolerance and trading style, enhancing overall performance.

Double Vegas SuperTrend Enhanced - Strategy [presentTrading]
█ Introduction and How It Is Different
The "Double Vegas SuperTrend Enhanced" strategy is a sophisticated trading system that combines two Vegas SuperTrend Enhanced. Very Powerful!
Let's celebrate the joy of Children's Day on June 1st! Enjoyyy!
BTCUSD LS performance
The strategy aims to pinpoint market trends with greater accuracy and generate trades that align with the overall market direction.
This approach differentiates itself by integrating volatility adjustments and leveraging the Vegas Channel's width to refine the SuperTrend calculations, resulting in a dynamic and responsive trading system.
Additionally, the strategy incorporates customizable take-profit and stop-loss levels, providing traders with a robust framework for risk management.
-> check Vegas SuperTrend Enhanced - Strategy
█ Strategy, How It Works: Detailed Explanation
🔶 Vegas Channel and SuperTrend Calculations
The strategy initiates by calculating the Vegas Channel, which is derived from a simple moving average (SMA) and the standard deviation (STD) of the closing prices over a specified window length. This channel helps in measuring market volatility and forms the basis for adjusting the SuperTrend indicator.
Vegas Channel Calculation:
- vegasMovingAverage = SMA(close, vegasWindow)
- vegasChannelStdDev = STD(close, vegasWindow)
- vegasChannelUpper = vegasMovingAverage + vegasChannelStdDev
- vegasChannelLower = vegasMovingAverage - vegasChannelStdDev
SuperTrend Multiplier Adjustment:
- channelVolatilityWidth = vegasChannelUpper - vegasChannelLower
- adjustedMultiplier = superTrendMultiplierBase + volatilityAdjustmentFactor * (channelVolatilityWidth / vegasMovingAverage)
The adjusted multiplier enhances the SuperTrend's sensitivity to market volatility, making it more adaptable to changing market conditions.
BTCUSD Local picture.
🔶 Average True Range (ATR) and SuperTrend Values
The ATR is computed over a specified period to measure market volatility. Using the ATR and the adjusted multiplier, the SuperTrend upper and lower levels are determined.
ATR Calculation:
- averageTrueRange = ATR(atrPeriod)
**SuperTrend Calculation:**
- superTrendUpper = hlc3 - (adjustedMultiplier * averageTrueRange)
- superTrendLower = hlc3 + (adjustedMultiplier * averageTrueRange)
The SuperTrend levels are continuously updated based on the previous values and the current market trend direction. The market trend is determined by comparing the closing prices with the SuperTrend levels.
Trend Direction:
- If close > superTrendLowerPrev, then marketTrend = 1 (bullish)
- If close < superTrendUpperPrev, then marketTrend = -1 (bearish)
🔶 Trade Entry and Exit Conditions
The strategy generates trade signals based on the alignment of both SuperTrends. Trades are executed only when both SuperTrends indicate the same market direction.
Entry Conditions:
- Long Position: Both SuperTrends must signal a bullish trend.
- Short Position: Both SuperTrends must signal a bearish trend.
Exit Conditions:
- Positions are exited if either SuperTrend reverses its trend direction.
- Additional conditions include holding periods and configurable take-profit and stop-loss levels.
█ Trade Direction
The strategy allows traders to specify the desired trade direction through a customizable input setting. Options include:
- Long: Only enter long positions.
- Short: Only enter short positions.
- Both: Enter both long and short positions based on the market conditions.
█ Usage
To utilize the "Double Vegas SuperTrend Enhanced" strategy, traders need to configure the input settings according to their trading preferences and market conditions. The strategy includes parameters for ATR periods, Vegas Channel window lengths, SuperTrend multipliers, volatility adjustment factors, and risk management settings such as hold days, take-profit, and stop-loss percentages.
█ Default Settings
The strategy comes with default settings that can be adjusted to fit individual trading styles:
- trade Direction: Both (allows trading in both long and short directions for maximum flexibility).
- ATR Periods: 10 for SuperTrend 1 and 5 for SuperTrend 2 (shorter ATR period results in more sensitivity to recent price movements).
- Vegas Window Lengths: 100 for SuperTrend 1 and 200 for SuperTrend 2 (longer window length results in smoother moving averages and less sensitivity to short-term volatility).
- SuperTrend Multipliers: 5 for SuperTrend 1 and 7 for SuperTrend 2 (higher multipliers lead to wider SuperTrend channels, reducing the frequency of trades).
- Volatility Adjustment Factors: 5 for SuperTrend 1 and 7 for SuperTrend 2 (higher adjustment factors increase the responsiveness to changes in market volatility).
- Hold Days: 5 (defines the minimum duration a position is held, ensuring trades are not exited prematurely).
- Take Profit: 30% (sets the target profit level to lock in gains).
- Stop Loss: 20% (sets the maximum acceptable loss level to mitigate risk).

HilalimSB Strategy HilalimSB A Wedding Gift 🌙
What is HilalimSB🌙?
First of all, as mentioned in the title, HilalimSB is a wedding gift.
HilalimSB - Revealing the Secrets of the Trend
HilalimSB is a powerful indicator designed to help investors analyze market trends and optimize trading strategies. Designed to uncover the secrets at the heart of the trend, HilalimSB stands out with its unique features and impressive algorithm.
Hilalim Algorithm and Fixed ATR Value:
HilalimSB is equipped with a special algorithm called "Hilalim" to detect market trends. This algorithm can delve into the depths of price movements to determine the direction of the trend and provide users with the ability to predict future price movements. Additionally, HilalimSB uses its own fixed Average True Range (ATR) value. ATR is an indicator that measures price movement volatility and is often used to determine the strength of a trend. The fixed ATR value of HilalimSB has been tested over long periods and its reliability has been proven. This allows users to interpret the signals provided by the indicator more reliably.
ATR Calculation Steps
1.True Range Calculation:
+ The True Range (TR) is the greatest of the following three values:
1. Current high minus current low
2. Current high minus previous close (absolute value)
3. Current low minus previous close (absolute value)
2.Average True Range (ATR) Calculation:
-The initial ATR value is calculated as the average of the TR values over a specified period
(typically 14 periods).
-For subsequent periods, the ATR is calculated using the following formula:
ATRt=(ATRt−1×(n−1)+TRt)/n
Where:
+ ATRt is the ATR for the current period,
+ ATRt−1 is the ATR for the previous period,
+ TRt is the True Range for the current period,
+ n is the number of periods.
Pine Script to Calculate ATR with User-Defined Length and Multiplier
Here is the Pine Script code for calculating the ATR with user-defined X length and Y multiplier:
//@version=5
indicator("Custom ATR", overlay=false)
// User-defined inputs
X = input.int(14, minval=1, title="ATR Period (X)")
Y = input.float(1.0, title="ATR Multiplier (Y)")
// True Range calculation
TR1 = high - low
TR2 = math.abs(high - close )
TR3 = math.abs(low - close )
TR = math.max(TR1, math.max(TR2, TR3))
// ATR calculation
ATR = ta.rma(TR, X)
// Apply multiplier
customATR = ATR * Y
// Plot the ATR value
plot(customATR, title="Custom ATR", color=color.blue, linewidth=2)
This code can be added as a new Pine Script indicator in TradingView, allowing users to calculate and display the ATR on the chart according to their specified parameters.
HilalimSB's Distinction from Other ATR Indicators
HilalimSB emerges with its unique Average True Range (ATR) value, presenting itself to users. Equipped with a proprietary ATR algorithm, this indicator is released in a non-editable form for users. After meticulous testing across various instruments with predetermined period and multiplier values, it is made available for use.
ATR is acknowledged as a critical calculation tool in the financial sector. The ATR calculation process of HilalimSB is conducted as a result of various research efforts and concrete data-based computations. Therefore, the HilalimSB indicator is published with its proprietary ATR values, unavailable for modification.
The ATR period and multiplier values provided by HilalimSB constitute the fundamental logic of a trading strategy. This unique feature aids investors in making informed decisions.
Visual Aesthetics and Clear Charts:
HilalimSB provides a user-friendly interface with clear and impressive graphics. Trend changes are highlighted with vibrant colors and are visually easy to understand. You can choose colors based on eye comfort, allowing you to personalize your trading screen for a more enjoyable experience. While offering a flexible approach tailored to users' needs, HilalimSB also promises an aesthetic and professional experience.
Strong Signals and Buy/Sell Indicators:
After completing test operations, HilalimSB produces data at various time intervals. However, we would like to emphasize to users that based on our studies, it provides the best signals in 1-hour chart data. HilalimSB produces strong signals to identify trend reversals. Buy or sell points are clearly indicated, allowing users to develop and implement trading strategies based on these signals.
For example, let's imagine you wanted to open a position on BTC on 2023.11.02. You are aware that you need to calculate which of the buying or selling transactions would be more profitable. You need support from various indicators to open a position. Based on the analysis and calculations it has made from the data it contains, HilalimSB would have detected that the graph is more suitable for a selling position, and by producing a sell signal at the most ideal selling point at 08:00 on 2023.11.02 (UTC+3 Istanbul), it would have informed you of the direction the graph would follow, allowing you to benefit positively from a 2.56% decline.
Technology and Innovation:
HilalimSB aims to enhance the trading experience using the latest technology. With its innovative approach, it enables users to discover market opportunities and support their decisions. Thus, investors can make more informed and successful trades. Real-Time Data Analysis: HilalimSB analyzes market data in real-time and identifies updated trends instantly. This allows users to make more informed trading decisions by staying informed of the latest market developments. Continuous Update and Improvement: HilalimSB is constantly updated and improved. New features are added and existing ones are enhanced based on user feedback and market changes. Thus, HilalimSB always aims to provide the latest technology and the best user experience.
Social Order and Intrinsic Motivation:
Negative trends such as widespread illegal gambling and uncontrolled risk-taking can have adverse financial effects on society. The primary goal of HilalimSB is to counteract these negative trends by guiding and encouraging users with data-driven analysis and calculable investment systems. This allows investors to trade more consciously and safely.
What is HilalimSB Strategy🌙?
HilalimSB Strategy is a strategy that is supported by the HilalimSB algorithm created by the creator of HilalimSB and continues transactions with take profit and stop loss levels determined by users who strategically and automatically open transactions as a result of the data it receives and automatically closes transactions under necessary conditions. It is a first in the tradingview world with its unique take profit and stop loss markings. HilalimSB Strategy is open to users' initiatives and is a trading strategy developed on BTC.
What does the HilalimSB Strategy target?
The main purpose of HilalimSB Strategy is to reduce the transaction load of traders and to be integrated into various brokerage firms and operated by automatic trading bots, and it is aimed to serve this purpose. In addition to the strategies currently available in the markets, HilalimSB Strategy offers a useful infrastructure to traders with its useful interface. HilalimSB Strategy, which was decided to be published as a result of various calculations, was offered to the users with its unique visual effects after the completion of the testing procedures under market conditions.
HilalimSB Strategy and Heikin Ashi
HilalimSB Strategy produces data in Heikin Ashi chart types, but since Heikin Ashi chart types have their own calculation method, HilalimSB Strategy has been published in a way that cannot produce data in this chart type due to HilalimSB Strategy's ideology of appealing to all types of users, and any confusion that may arise is prevented in this way.
After the necessary conditions determined by the creator of HilalimSB are met, HilalimSB Heikin Ashi will be shared exclusively with invited users only, upon request, to users who request an invitation.
Differences between HilalimSB Strategy and HilalimSB
HilalimSB Strategy has been shared as a strategy and its features have been explained above. HilalimSB is a trading indicator and this is the main difference between them.We can explain it briefly this way.
Here are the differences between indicators and strategies:
1.Purpose and Use:
Indicators: Analyze market data to provide information about price movements and trends. They typically generate buy and sell signals and give traders clues about when to make trades in the market.
Strategies: These are plans for trading based on specific rules. They use signals from indicators and other market data to execute buy and sell transactions.
2.Features:
Indicators: Operate independently and are based on specific mathematical formulas. Examples include moving averages, RSI, and MACD.
Strategies: Combine one or more indicators and other market analysis tools to create a comprehensive trading plan. This plan determines entry and exit points, risk management, and trade size.
3.Scope:
Indicators: Are single analysis tools focusing on specific time frames or price movements.
Strategies: Are comprehensive trading plans that typically involve multiple trades over a certain period.
4.Decision Making:
Indicators: Provide information to traders and help in the decision-making process.
Strategies: Are direct decision-making mechanisms that execute trades automatically according to predetermined rules.
5.Automation:
Indicators: Are mostly interpreted manually and used based on the trader’s discretion.
Strategies: Can be used in automated trading systems and execute trades automatically according to the set rules.
The shared image is a 1-hour chart of BTCUSDC.P determined by the user as 1 percent take profit and 1 percent stop loss. And transactions were opened on Binance with the commission rate determined as 0.017 for the USDC trading pair.
HilalimSB Strategy, which presents users with completely concrete data, has proven itself in testing processes and is a project of SB that aims to reach all user profiles.🌙

Entry Fragger - Strategy
For basic instructions please visit my other script "Entry Fragger".
The Signal Logic is explained there.
v1.4:
- Added advanced backtesting with fully customizable entries.
- Fully automated Buy Signals (profitable).
- Adjustable timeframes for signal logic. (requested)
Every setting affects the accuracy and profitability greatly now, based on settings applied.
The strategy performs best on high timeframes with larger capital and no leverage.
Useless for Forex, but absolutely smashes stocks and crypto on mid to high timeframes.
Please read through my other scripts description.
Set values as preferred and try your assets.
It does NOT work on low timeframes and forex!
Hint: BTC 4H, Custom Timeframe 1h, Moon Mode and Show Sell Signals enabled, R2R: 2.

Triple EMA + QQE Trend Following Strategy [TradeDots]The "Triple EMA + QQE Trend Following Strategy" harnesses the power of two sophisticated technical indicators, the Triple Exponential Moving Average (TEMA) and the Qualitative Quantitative Estimation (QQE), to generate precise buy and sell signals. This strategy excels in capturing shifts in trends by identifying short-term price momentum and dynamic overbought or oversold conditions.
HOW IT WORKS
This strategy integrates two pivotal indicators:
Triple Exponential Moving Average (TEMA): TEMA enhances traditional moving averages by reducing lag and smoothing the data more effectively. It achieves this by applying the EMA formula three times onto the price, as follows:
tema(src, length) =>
ema1 = ta.ema(src, length)
ema2 = ta.ema(ema1, length)
ema3 = ta.ema(ema2, length)
tema = 3*ema1 - 3*ema2 + ema3
This computation helps to sharpen the sensitivity to price movements.
Qualitative Quantitative Estimation (QQE): The QQE indicator improves upon the standard RSI by incorporating a smoothing mechanism. It starts with the standard RSI, overlays a 5-period EMA on this RSI, and then enhances the result using a double application of a 27-period EMA. A slow trailing line is then derived by multiplying the result with a factor number. This approach establishes a more refined and less jittery trend-following signal, complementing the TEMA to enhance overall market timing during fluctuating conditions.
APPLICATION
Referenced from insights on "Trading Tact," the strategy implementation follows:
First of all, we utilize two TEMA lines: one set at a 20-period and the other at a 40-period. Then following the rules below:
40-period TEMA is rising
20-period TEMA is above 40-period TEMA
Price closes above 20-period TEMA
Today is not Monday
RSI MA crosses the Slow trailing line
This strategy does not employ an active take profit mechanism; instead, it utilizes a trailing stop loss to allow the price to reach the stop loss naturally, thereby maximizing potential profit margins.
DEFAULT SETUP
Commission: 0.01%
Initial Capital: $10,000
Equity per Trade: 80%
Users are advised to adjust and personalize this trading strategy to better match their individual trading preferences and style.
RISK DISCLAIMER
Trading entails substantial risk, and most day traders incur losses. All content, tools, scripts, articles, and education provided by TradeDots serve purely informational and educational purposes. Past performances are not definitive predictors of future results.
Reference:
Trading Tact. What Is the QQE Indicator? Retrieved from: tradingtact.com

Dual RSI Differential - Strategy [presentTrading]█ Introduction and How it is Different
The Dual RSI Differential Strategy introduces a nuanced approach to market analysis and trading decisions by utilizing two Relative Strength Index (RSI) indicators calculated over different time periods. Unlike traditional strategies that employ a single RSI and may signal premature or delayed entries, this method leverages the differential between a shorter and a longer RSI. This approach pinpoints more precise entry and exit points, providing a refined tool for traders to exploit market conditions effectively, particularly in overbought and oversold scenarios.
Most important: it is a good eductional code for swing trading.
For beginners, this Pine Script provides a complete function that includes crucial elements such as holding days and the option to configure take profit/stop loss settings:
- Hold Days: This feature ensures that trades are not exited too hastily, helping traders to ride out short-term market volatility. It's particularly valuable for swing trading where maintaining positions slightly longer can lead to capturing significant trends.
- TPSL Condition (None by default): This setting allows traders to focus solely on the strategy's robust entry and exit signals without being constrained by preset profit or loss limits. This flexibility is crucial for learning to adjust strategy settings based on personal risk tolerance and market observations.
BTCUSD 6h LS Performance
█ Strategy, How It Works: Detailed Explanation
🔶 RSI Calculation:
The RSI is a momentum oscillator that measures the speed and change of price movements. It is calculated using the formula:
RSI = 100 - (100 / (1 + RS))
Where RS (Relative Strength) = Average Gain of up periods / Average Loss of down periods.
🔶 Dual RSI Setup:
This strategy involves two RSI indicators:
RSI_Short (RSI_21): Calculated over a short period (21 days).
RSI_Long (RSI_42): Calculated over a longer period (42 days).
Differential Calculation:
The strategy focuses on the differential between these two RSIs:
RSI Differential = RSI_Long - RSI_Short
This differential helps to identify when the shorter-term sentiment diverges from longer-term trends, signaling potential trading opportunities.
BTCUSD Local picuture
🔶 Signal Triggers:
Entry Signal: A buy (long) signal is triggered when the RSI Differential exceeds -5, suggesting strengthening short-term momentum. Conversely, a sell (short) signal occurs when the RSI Differential falls below +5, indicating weakening short-term momentum.
Exit Signal: Trades are generally exited when the RSI Differential reverses past these thresholds, indicating a potential momentum shift.
█ Trade Direction
This strategy accommodates various trading preferences by allowing selections among long, short, or both directions, thus enabling traders to capitalize on diverse market movements and volatility.
█ Usage
The Dual RSI Differential Strategy is particularly suited for:
Traders who prefer a systematic approach to capture market trends.
Those who seek to minimize risks associated with rapid and unexpected market movements.
Traders who value strategies that can be finely tuned to different market conditions.
█ Default Settings
- Trading Direction: Both — allows capturing of upward and downward market movements.
- Short RSI Period: 21 days — balances sensitivity to market movements.
- Long RSI Period: 42 days — smoothens out longer-term fluctuations to provide a clearer market trend.
- RSI Difference Level: 5 — minimizes false signals by setting a moderate threshold for action.
Use Hold Days: True — introduces a temporal element to trading strategy, holding positions to potentially enhance outcomes.
- Hold Days: 5 — ensures that trades are not exited too hastily, helping to ride out short-term volatility.
- TPSL Condition: None — enables traders to focus solely on the strategy's entry and exit signals without preset profit or loss limits.
- Take Profit Percentage: 15% — aims for significant market moves to lock in profits.
- Stop Loss Percentage: 10% — safeguards against large losses, essential for long-term capital preservation.

Price-Volume Dynamic - Strategy [presentTrading]█ Introduction and How it is Different
The "Price-Volume Dynamic - Strategy" leverages a unique blend of price action, volume analysis, and statistical z-scores to establish trading positions. This approach differentiates itself by integrating the concept of the Point of Control (POC) from volume profile analysis with price-based z-score indicators to create a dynamic trading strategy. It tailors entry and exit thresholds based on current market volatility, providing a responsive and adaptive trading method. This strategy stands out by considering both historical volatility and price trends to adjust trading decisions in real-time, enhancing its effectiveness in various market conditions.
BTCUSD 4h LS Performance
█ Strategy: How It Works – Detailed Explanation
🔶 Calculating Point of Control (POC)
The Point of Control (POC) represents the price level with the highest traded volume over a specified lookback period. It's calculated by dividing the price range into a number of rows, each representing a price level. The volume at each price level is tallied and the level with the maximum volume is designated as the POC.
🔶 Dynamic Thresholds Adjustments
The entry and exit thresholds are dynamically adjusted based on normalized volatility, which is derived from the current, minimum, and maximum ATR over a specified period. This normalization ensures that the thresholds adapt to changes in market conditions, making the strategy sensitive to shifts in market volatility.
BTCUSD local performance
█ Trade Direction
The strategy can be configured to trade in three different directions: Long, Short, or Both. This flexibility allows traders to align their trading strategy with their market outlook or risk preferences. By adjusting the `POC_tradeDirection` input, traders can selectively participate in market movements that match their trading style and objectives.
█ Usage
To deploy this strategy, traders should apply it within a trading software that supports scripting and backtesting, such as TradingView's Pine Script environment. Users can input their parameters based on their analysis of the market conditions and their risk tolerance. It is essential for traders to backtest the strategy using historical data to evaluate its performance and make necessary adjustments before applying it in live trading scenarios.
█ Default Settings
- Lookback Length: Sets the period over which the highest and lowest prices, and the volume per price level, are calculated. A higher lookback length smoothens the volatility but may delay response to recent market movements.
- Number of Rows: Determines the granularity of price levels within the price range. More rows provide a more detailed volume profile but require more computational resources.
- Entry Z-Score Threshold Base: Influences the sensitivity of the strategy to enter trades. Higher values make the strategy more conservative, requiring stronger deviation from the mean to trigger a trade.
- Exit Z-Score Threshold Base: Sets the threshold for exiting trades, with lower values allowing trades to close on smaller price retractions, thereby potentially preserving profits or reducing losses.
- Trading Direction: Allows selection between Long, Short, or Both, enabling traders to tailor the strategy to their market view or risk preferences.

Alligator + MA Trend Catcher [TradeDots]The "Alligator + MA Trend Catcher" is a trading strategy that integrates the William Alligator indicator with a Moving Average (MA) to establish robust entry and exit conditions, optimized for capturing trends.
HOW IT WORKS
This strategy combines the traditional William Alligator set up with an additional Moving Average indicator for enhanced trend confirmation, creating a user-friendly backtesting tool for traders who prefer the Alligator method.
The original Alligator strategy can frequently present fluctuations, even in well-established trends, leading to potentially premature exits. To mitigate this, we incorporate a Moving Average as a secondary confirmation measure to ensure the market trend has indeed shifted.
Here’s the operational flow for long orders:
Entry Signal: When the price rises above the Moving Average, it confirms a bullish market state. Enter if Alligator spread in an upward direction. The trade remains active even if the Alligator indicator suggests a trend reversal.
Exit Signal: The position is closed when the price falls below the Moving Average, and the Alligator spreads in the downward direction. This setup helps traders to maintain positions through the entirety of the trend for maximum gain.
APPLICATION
This strategy is tailored for assets with significant, well-defined trends, such as Bitcoin and Ethereum, which are known for their high volatility and substantial price movements.
This strategy offers a low win-rate but high reward configuration, making asset selection critical for long-term profitability. If you choose assets that lack strong price momentum, there's a high chance that this strategy may not be effective.
For traders seeking to maximize gains from large trends without exiting prematurely, this strategy provides an aggressive yet controlled approach to riding out substantial market waves.
DEFAULT SETUP
Commission: 0.01%
Initial Capital: $10,000
Equity per Trade: 80%
RISK DISCLAIMER
Trading entails substantial risk, and most day traders incur losses. All content, tools, scripts, articles, and education provided by TradeDots serve purely informational and educational purposes. Past performances are not definitive predictors of future results.

Price Based Z-Trend - Strategy [presentTrading]█ Introduction and How it is Different
Z-score: a statistical measurement of a score's relationship to the mean in a group of scores.
Simple but effective approach.
The "Price Based Z-Trend - Strategy " leverages the Z-score, a statistical measure that gauges the deviation of a price from its moving average, normalized against its standard deviation. This strategy stands out due to its simplicity and effectiveness, particularly in markets where price movements often revert to a mean. Unlike more complex systems that might rely on a multitude of indicators, the Z-Trend strategy focuses on clear, statistically significant price movements, making it ideal for traders who prefer a streamlined, data-driven approach.
BTCUSD 6h LS Performance
█ Strategy, How It Works: Detailed Explanation
🔶 Calculation of the Z-score
"Z-score is a statistical measurement that describes a value's relationship to the mean of a group of values. Z-score is measured in terms of standard deviations from the mean. If a Z-score is 0, it indicates that the data point's score is identical to the mean score. A Z-score of 1.0 would indicate a value that is one standard deviation from the mean. Z-scores may be positive or negative, with a positive value indicating the score is above the mean and a negative score indicating it is below the mean."
The Z-score is central to this strategy. It is calculated by taking the difference between the current price and the Exponential Moving Average (EMA) of the price over a user-defined length, then dividing this by the standard deviation of the price over the same length:
z = (x - μ) /σ
Local
🔶 Trading Signals
Trading signals are generated based on the Z-score crossing predefined thresholds:
- Long Entry: When the Z-score crosses above the positive threshold.
- Long Exit: When the Z-score falls below the negative threshold.
- Short Entry: When the Z-score falls below the negative threshold.
- Short Exit: When the Z-score rises above the positive threshold.
█ Trade Direction
The strategy allows users to select their preferred trading direction through an input option.
█ Usage
To use this strategy effectively, traders should first configure the Z-score thresholds according to their risk tolerance and market volatility. It's also crucial to adjust the length for the EMA and standard deviation calculations based on historical performance and the expected "noise" in price data.
The strategy is designed to be flexible, allowing traders to refine settings to better capture profitable opportunities in specific market conditions.
█ Default Settings
- Trade Direction: Both
- Standard Deviation Length: 100
- Average Length: 100
- Threshold for Z-score: 1.0
- Bar Color Indicator: Enabled
These settings offer a balanced starting point but can be customized to suit various trading styles and market environments. The strategy's parameters are designed to be adjusted as traders gain experience and refine their approach based on ongoing market analysis.
Z-score is a must-learn approach for every algorithmic trader.

Calculus Free Trend Strategy for Crypto & StocksObjective :
The Correlation Channel Trading Strategy is designed to identify potential entry points based on the relationship between price movements and a correlation channel. The strategy aims to capture trends within the channel while managing risk effectively.
Parameters :
Length: Determines the period for calculating moving averages and the true range, influencing the sensitivity of the strategy to price movements.
Multiplier: Adjusts the width of the correlation channel, providing flexibility to adapt to different market conditions.
Inputs :
Asset Symbol: Allows users to specify the financial instrument for analysis.
Timeframe: Defines the timeframe for data aggregation, enabling customization based on trading preferences.
Plot Correlation Channel: Optional input to visualize the correlation channel on the price chart.
Methodology :
Data Acquisition: The strategy fetches OHLC (Open, High, Low, Close) data for the specified asset and timeframe. In this case we use COINBASE:BTCUSD
Calculation of Correlation Channel: It computes the squared values for OHLC data, calculates the average value (x), and then calculates the square root of x to derive the source value. Additionally, it calculates the True Range as the difference between high and low prices.
Moving Averages: The strategy calculates moving averages (MA) for the source value and the True Range, which form the basis for defining the correlation channel.
Upper and Lower Bands: Using the MA and True Range, the strategy computes upper and lower bands of the correlation channel, with the width determined by the multiplier.
Entry Conditions: Long positions are initiated when the price crosses above the upper band, signaling potential overbought conditions. Short positions are initiated when the price crosses below the lower band, indicating potential oversold conditions.
Exit Conditions: Stop-loss mechanisms are incorporated directly into the entry conditions to manage risk. Long positions are exited if the price falls below a predefined stop-loss level, while short positions are exited if the price rises above the stop-loss level.
Strategy Approach: The strategy aims to capitalize on trends within the correlation channel, leveraging systematic entry signals while actively managing risk through stop-loss orders.
Backtest Details : For the purpose of this test I used the entire data available for BTCUSD Coinbase, with 10% of capital allocation and 0.1% comission for entry/exit(0.2% total). Can be also used with other both directly correlated with current settings of BTC or with new ones
Advantages :
Provides a systematic approach to trading based on quantifiable criteria.
Offers flexibility through customizable parameters to adapt to various market conditions.
Integrates risk management through predefined stop-loss mechanisms.
Limitations :
Relies on historical price data and technical indicators, which may not always accurately predict future price movements.
May generate false signals during periods of low volatility or erratic price behavior.
Requires continuous monitoring and adjustment of parameters to maintain effectiveness.
Conclusion :
The Correlation Channel Trading Strategy offers traders a structured framework for identifying potential entry points within a defined price channel. By leveraging moving averages and true range calculations, the strategy aims to capture trends while minimizing risk through stop-loss mechanisms. While no strategy can guarantee success in all market conditions, the Correlation Channel Trading Strategy provides a systematic approach to trading that can enhance decision-making and risk management for traders.

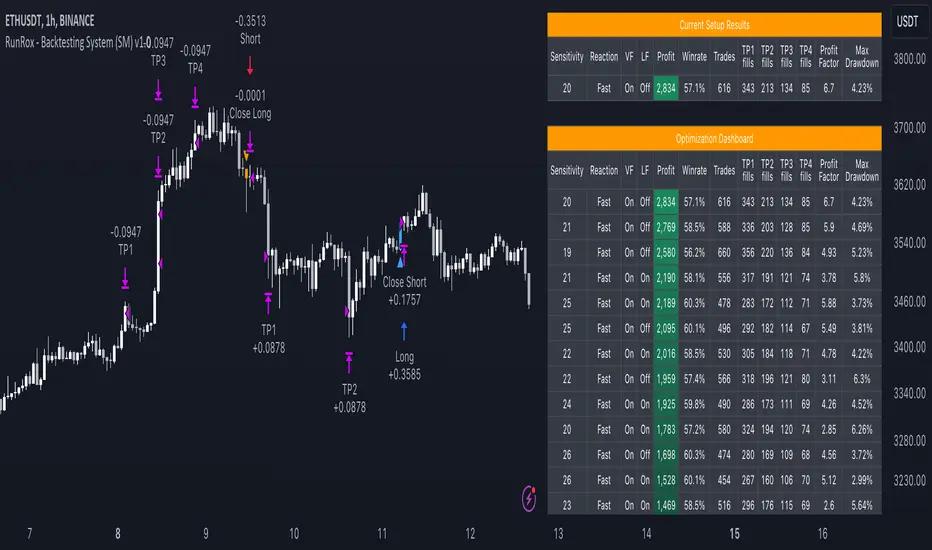
RunRox - Backtesting System (SM)RunRox - Backtesting System (SM) is designed for flexible and comprehensive testing of trading strategies, closely integrated with our RunRox - Signals Master indicator. This combination enhances your ability to refine strategies efficiently, providing you with insights to adapt and optimize your trading tactics seamlessly.
The Backtesting System (SM) excels in pinpointing the optimal settings for the RunRox - Signals Master indicator, efficiently highlighting the most effective configurations.
Capabilities of the Backtesting System (SM)
Optimal Settings Determination: Identifies the best configurations for the Signals Master indicator to enhance its effectiveness.
Timeframe-Specific Strategy Testing: Allows strategies to be tested over specific historical time periods to assess their viability.
Customizable Initial Conditions: Enables setting of initial deposit, risk per trade, and commission rates to mirror real-world trading conditions.
Flexible Money Management: Provides options to set take profits and stop losses, optimizing potential returns and risk management.
Intuitive Dashboard: Features a user-friendly dashboard that visually displays all pertinent information, making it easy to analyze and adjust strategies.
Trading Flexibility Across Three Modes:
Dual-Direction Trading: Engage in both buying and selling with this mode. Our dashboard optimizes and identifies the best settings for trading in two directions, streamlining the process to maximize effectiveness for both buy and sell orders.
Buy-Only Mode: Tailored for traders focusing exclusively on purchasing assets. In this mode, our backtester pinpoints the most advantageous sensitivity, speed reaction, and filter settings specifically for buying. Optimal settings in this mode may differ from those used in dual-direction trading, providing a customized approach to single-direction strategies.
Sell-Only Mode: Perfect for strategies primarily based on selling. This setting allows you to discover the ideal configurations for asset sales, which can be particularly useful if you are looking for optimal exit points in long-term transactions or under specific market conditions.
Here's an example of how profits can differ on the same asset when trading using two distinct strategies: exclusively buying or trading in both directions.
Above in the image, you can see how one-directional trading influences the results of backtests on historical data. While this does not guarantee future outcomes, it provides insight into how the strategy's performance can vary with different trading directions.
As you can also see from the image, one-directional trading has affected the optimal combination of settings for Sensitivity, Speed Reaction, and Filters.
Stop Loss and Take Profit
Our backtesting system, as you might have gathered, includes flexible settings for take profits and stop losses. Here are the main features:
Multiple Take Profits: Ability to set from 1 to 4 take profit levels.
Fixed Percentage: Option to assign a fixed percentage for each take profit.
Trade Proportion Fixation: Ability to set a fixed size from the trade for securing profits.
Stop Loss Installation: Option to establish a stop loss.
Break-Even Stop Loss: Ability to move the stop loss to a break-even point upon reaching a specified take profit level.
These settings offer extensive flexibility and can be customized according to your preferences and trading style. They are suitable for both novice and professional traders looking to test their trading strategies on historical data.
As illustrated in the image above, we have implemented money management by setting fixed take profits and stop losses. Utilizing money management has improved indicators such as profit, maximum drawdown, and profit factor, turning even historically unprofitable strategies into profitable ones. Although this does not guarantee future results, it serves as a valuable tool for understanding the effectiveness of money management.
Additionally, as you can see, the optimal settings for Signals Master have been adjusted, highlighting the best configurations for the most favorable outcomes.
Disclaimer:
Historical data is not indicative of future results. All indicators and strategies provided by RunRox are intended for integration with traders' strategies and should be used as tools for analysis rather than standalone solutions. Traders should use their own discretion and understand that all trading involves risk.
Vegas SuperTrend Enhanced - Strategy [presentTrading]█ Introduction and How it is Different
The "Vegas SuperTrend Enhanced - Strategy " trading strategy represents a novel integration of two powerful technical analysis tools: the Vegas Channel and the SuperTrend indicator. This fusion creates a dynamic, adaptable strategy designed for the volatile and fast-paced cryptocurrency markets, particularly focusing on Bitcoin trading.
Unlike traditional trading strategies that rely on a static set of rules, this approach modifies the SuperTrend's sensitivity to market volatility, offering traders the ability to customize their strategy based on current market conditions. This adaptability makes it uniquely suited to navigating the often unpredictable swings in cryptocurrency valuations, providing traders with signals that are both timely and reflective of underlying market dynamics.
BTC 6h LS
█ Strategy, How it Works: Detailed Explanation
This is an innovative approach that combines the volatility-based Vegas Channel with the trend-following SuperTrend indicator to create dynamic trading signals. This section delves deeper into the mechanics and mathematical foundations of the strategy.
Detail picture to show :
🔶 Vegas Channel Calculation
The Vegas Channel serves as the foundation of this strategy, employing a simple moving average (SMA) coupled with standard deviation to define the upper and lower bounds of the trading channel. This channel adapts to price movements, offering a visual representation of potential support and resistance levels based on historical price volatility.
🔶 SuperTrend Indicator Adjustment
Central to the strategy is the SuperTrend indicator, which is adjusted according to the width of the Vegas Channel. This adjustment is achieved by modifying the SuperTrend's multiplier based on the channel's volatility, allowing the indicator to become more sensitive during periods of high volatility and less so during quieter market phases.
🔶 Trend Determination and Signal Generation
The market trend is determined by comparing the current price with the SuperTrend values. A shift from below to above the SuperTrend line signals a potential bullish trend, prompting a "buy" signal, whereas a move from above to below indicates a bearish trend, generating a "sell" signal. This methodology ensures that trades are entered in alignment with the prevailing market direction, enhancing the potential for profitability.
BTC 6h Local
█ Trade Direction
A distinctive feature of this strategy is its configurable trade direction input, allowing traders to specify whether they wish to engage in long positions, short positions, or both. This flexibility enables users to tailor the strategy according to their risk tolerance, trading style, and market outlook, providing a personalized trading experience.
█ Usage
To utilize the "Vegas SuperTrend - Enhanced" strategy effectively, traders should first adjust the input settings to align with their trading preferences and the specific characteristics of the asset being traded. Monitoring the strategy's signals within the context of overall market conditions and combining its insights with other forms of analysis can further enhance its effectiveness.
█ Default Settings
- Trade Direction: Both (allows trading in both directions)
- ATR Period for SuperTrend: 10 (determines the length of the ATR for volatility measurement)
- Vegas Window Length: 100 (sets the length of the SMA for the Vegas Channel)
- SuperTrend Multiplier Base: 5 (base multiplier for SuperTrend calculation)
- Volatility Adjustment Factor: 5.0 (adjusts SuperTrend sensitivity based on Vegas Channel width)
These default settings provide a balanced approach suitable for various market conditions but can be adjusted to meet individual trading needs and objectives.

Easy Strategy BuilderHello, I focused on making this indicator as user-friendly as possible while designing it. I avoided complex structures, and as a result, I believe I have created an indicator that everyone can easily use.
With the Strategy Builder indicator, you can automate the strategy you use and visualize signals on the chart. This allows you to scale your strategy and stay informed of new signals through alerts.
How it works?
Firstly, we need to determine the entry condition for the trade. For this, you have 15 different sources at your disposal.
1. Price
2. RSI
3. RSI MA
4. CCI
5. STOCH K
6. STOCH D
7. MA 1
8. MA 2
9. ATR
10. DMI+
11. DMI-
12. SUPERTREND
13. BB Lower
14. BB Middle
15. BB Upper
Using the relationship between these sources or with a key level, we can generate signals. There are 7 different conditions available to control this relationship.
1. > x is greater than y
2. > = x is greater than or equal to y
3. < x is less than y
4. ≤ x is less than or equal to y
5. = x is equal to y
6. Cross Up = x has crossed above y. One bar ago, x was less than y, now x is greater than y.
7. Cross Down = x has crossed below y. One bar ago, x was greater than y, now x is less than y.
Let’s make a few examples
1.
- Entry Condition: RSI crosses above RSI moving average.
- Exit Condition: RSI crosses below RSI moving average.
Let's use more than one condition together
2.
Entry Condition: rsi<30 ve rsi cross up rsi Ma
Exit Condition: Rsi>70 ve rsi cross down rsi Ma
Let's strengthen the signal by adding different indicators and price.
3.
Entry Condition: rsi<30 and price70 and price> bb middle and rsi cross down rsi ma
What if things go wrong? Let's add stop loss
4.
Entry Condition: rsi<30 and price70 and price> bb higher and rsi cross down rsi ma
Stoploss: %2
That's how simple it is to create a strategy. Need a more complex strategy? Feel free to contact me.
Important notes:
1. Avoid continuously triggered conditions.
Example:
Entry Condition: RSI > 0
2. Determine logical entry and exit conditions.
3. Avoid placing stop losses too close to entry points.

Universal Algorithm [BackQuant]Universal Algorithm
It is a trading strategy designed CLEAR TREND DETECTION . This script is the culmination of extensive research and development efforts aimed at providing traders with a robust tool capable of adapting to a wide array of market conditions. This description delves into the core components, methodologies, and operational parameters of Universal Algo to offer potential users a clear understanding of its functionalities and the principles underpinning its design.
Core Methodologies and Features:
Integrated Systems: Universal Algo is built around six core systems, each contributing unique analytical perspectives to enhance trade signal reliability. These systems are designed to identify clear trend opportunities for significant gains, while also employing logic to navigate through ranging markets effectively.
Adaptive Market Logic: By incorporating volatility metrics, the algorithm dynamically adjusts to changing market conditions. This ensures that the strategy remains effective across different market regimes, aiming to reduce market noise and improve signal quality.
Selective Shorting Mechanism: While the primary focus is on capturing long positions, it includes an optional shorting feature. This can be activated by users to adapt the strategy during macro downtrends, thus providing a flexible approach to market participation.
Backtesting and Forward-Testing Rigor : The strategy has undergone rigorous testing to validate its performance and reliability. It demonstrates prudent risk management by optimizing conditions under which short positions are considered, aiming to mitigate drawdowns and preserve capital.
Operational Parameters:
Customization Options: The script offers a range of user inputs, allowing for customization of the backtesting starting date, the decision to display the strategy equity curve, among other settings. These inputs cater to diverse trading needs and preferences, offering users control over their strategy implementation.
Transparency and Logic Insight: While specific calculation details and proprietary indicators are integral to maintaining the uniqueness of Universal Algo , the strategy is grounded on well-established financial analysis techniques. These include momentum analysis, volatility assessments, and adaptive thresholding, among others, to formulate its trade signals.
Realistic Trading Conditions : Backtesting, considered realistic trading conditions, including appropriate account size, commission, slippage, and sustainable risk levels per trade. The strategy is designed and tested with a focus on achieving a balance between risk and reward, striving for robustness and reliability rather than unrealistic profitability promises.
Concluding Thoughts:
Universal Algo is offered to the TradingView community as a tool for traders seeking to enhance their market analysis and trading strategies. Its development is driven by a commitment to quality, innovation, and adaptability, aiming to provide valuable insights and decision-support in various market conditions. Potential users are encouraged to evaluate Universal Algo within the context of their overall trading approach and objectives.

Strategy - Plus / Connectable [Azullian]Discover the advanced capabilities of Strategy Plus, an essential component of the connectable indicator system designed for fast-paced strategy testing, visualization, and building within TradingView. This enhanced version of our foundational connectable strategy indicator seamlessly integrates with all connectable indicators . By utilizing the TradingView input source as a signal connector , it facilitates the linking of indicators to form a cohesive strategy. Each connectable indicator within the system sends signal weight to the next node, culminating in a comprehensive strategy that incorporates advanced customization options, sophisticated signal interpretation, and elaborate backtest labeling. Strategy Plus stands out by offering improved position management and extensive alert messaging capabilities, ensuring effective strategy refinement and backend integration.
█ DISTINCTIVE FEATURES
The Connectable Strategy Plus enhances risk mitigation within the connectable system through its advanced features and capabilities:
• Refined Signal Input Management: Tailor and precisely connect up to two signal filters with enhanced input flexibility, gain control, and strategic direction settings.
• Strategic Position Investment Control: Optimize positioning with versatile investment bases, custom investment percentages, and direction-specific investments for effective risk management.
• Advanced Exit Stop Loss Configuration: Implement custom stop loss tactics with diverse base modes and trailing options for tailored risk management.
• Strategic Exit Take Profit Settings: Apply precision-driven take profit strategies with various calculation modes and dynamic trailing functionality.
• Calibrated Entry Position Allocation: Optimize investment distribution for entry positions, including DCA and BRO trades, for strategic market response.
• Refined Order Setting Customization: Ensure exchange compliance with adjustable order settings, enhancing backtest accuracy and strategy reliability.
• Comprehensive Condition Settings: Define precise conditions for strategy execution, including date range filtering and order/loss limitations.
• Intuitive Visualization: Enhance strategy clarity with customizable visual elements and trade visualization features.
• Advanced Alert Configurations: Stay informed with comprehensive and customizable alerts for effective backend integration.
• Backend Integration With JSON Format: Leverage elaborate and structured data in JSON format for advanced analytics, enhancing decision-making and strategy optimization outside TradingView.
Let's review the separate parts of this indicator.
█ STRATEGY INPUTS
We've provided 2 inputs for connecting a signal filter or indicators or chains (1→, 2→) which are all set to 'Close' by default.
An input has several controls:
• Enable disable: Toggle the entire input on or off
• Input: Connect indicators or signal filter here, choose indicators with a compatible : Signal connector.
• G - Gain: Increase or reduce the strength of the incoming signal by a factor.
• SM - Signal Mode: Choose a trading direction compatible with the settings in your signal filter
• XM - Exit Mode: Determine when to allow to exit your open trade
○ Always: Doesn't take the restrictions into account, this ignores all the settings chosen in ML or MP
○ Restricted: Use both ML and MP conditions
○ Loss: Use the ML condition only, for example: Position will be exited and the exit signal will be allowed only when the loss exceeds the ML parameter
○ Profit: Use the MP condition only for example: Exits will only be allowed when the profit of the position exceeds the condition of the MP parameter
█ POSITION INVESTMENT
Determine the percentage of your trading budget you would like to use in each position based on the strategy's profit or loss.
• LINVB - Loss Investment Base: Choose which base to use to determine the investment percentage when the strategy is in a loss.
○ Equity: Use the equity as the base for percentage calculation.
○ Initial capital: Use the initial capital as the base for percentage calculation.
• LINV% - Loss Investment Percentage: Set a percentage of the chosen investment base as the investment for a new position.
○ For example, when 10% in loss, and a initial capital of $100, and the investment base is set to equity with a percentage of 50%, your investment will be 50% of $90, $45.
• PINVB - Profit Investment Base: Choose which base to use to determine the investment percentage when the strategy is in profit.
○ Equity: Use the equity as the base for percentage calculation.
○ Initial capital: Use the initial capital as the base for percentage calculation.
• PINV% - Profit Investment Percentage: Set a percentage of the chosen investment base as the investment for a new position.
○ For example, when 10% in profit, and an initial capital of $100, and the investment base is set to equity with a percentage of 100%, your investment will be 100% of $110, $110.
• XINVB - Custom Profit Investment Base: Choose which base to use to determine the investment percentage when the strategy is above a custom profit threshold (XT).
○ Equity: Use the equity as the base for percentage calculation.
○ Initial capital: Use the initial capital as the base for percentage calculation.
• XINV% - Custom Profit Investment Percentage: Set a percentage of the chosen investment base as the investment for a new position.
○ For example, when 100% in profit, exceeding the XT threshold of 50%, and an initial capital of $100, and the investment base is set to equity with a percentage of 50%, your investment will be 50% of $200, $100.
• XT% - Custom Profit Threshold: Determine how much profit triggers these custom profit investment settings.
• ELIB% - Entry Long Investment Base: Following previous settings, you can further restrict the investment according to the long trading direction.
○ For instance, if the previous calculation resulted in $45 to be used as an investment, and you've set the ELIB% to 50%, your long position will use 50% of $45, which is $22.5.
• ESIB% - Entry Short Investment Base: Following previous settings, you can further restrict the investment according to the short trading direction.
○ For example, if the previous calculation resulted in $45 to be used as an investment, and you've set the ESIB% to 50%, your short position will use 50% of $45, which is $22.5.
• RISK% - Risk Percentage:
○ Determine how much of the calculated position investment is at risk when the stop-loss is hit.
- For example, 1% of $45 represents a maximum loss of $0.45.
○ Risk percentage works together with the stop loss and the max leverage.
• MXLVG - Maximum Leverage:
○ Investigate the trading rules for your trading pair and use the maximum allowed amount of leverage.
○ To determine the number of contracts to be bought or sold, considering the stop loss and the specified risk percentage, the maximum leverage available will constrain the amount of leverage utilized to ensure that the maximum risk threshold is not exceeded. For instance, suppose the stop loss is set at 1%, and the risk percentage is defined as 10%. Initially, the calculated leverage to be used would be 10. However, if there is a maximum leverage cap set at 5, it would constrain the calculated leverage of 10 to adhere to the maximum limit of 5.
█ EXIT STOP LOSS
Determine the Stop Loss price based on your selected configuration.
As the stop loss is an integral part of the ordered contracts calculation used in conjunction with the Risk and Max leverage, you'll always need to provide a stop loss price.
• SLLB - Stop Loss Long Base: Choose a stop loss mode for calculating stop loss prices in long positions.
○ Risk: Determines the price using the Risk parameter (RISK%) and maximum leverage (MXLVG). In this case, SLLB% will not have any impact.
○ Price Entry + Offset: Calculates the stop loss price based on a offset percentage (SLLB%) from the entry price of the position.
○ Source: Computes the stop loss price based on an external indicator defined in SLLSRC.
- If this results in an invalid price, the calculation will revert to using the price entry + offset.
○ Source + Offset: Determines the stop loss price based on a positive or negative offset percentage (SLLB%) from an external indicator defined in SLLSRC.
- If this results in an invalid price, the calculation will fall back to using the price entry + offset.
• SLLB% - Stop Loss Long Base Percentage: Define an offset percentage that will be applied in the price entry + offset and source + offset stop loss modes.
• SLLSRC - Stop Loss Long Source: Connect an external indicator as the source for stop loss (only those providing price values eg: bollinger bands, moving averages...).
• SLLT - Stop Loss Long Trailing:
○ Fixed: The initial stop loss will be kept and no trailing stop loss will be applied.
○ Trail Stop: Takes into account all settings defined in SLLB and SLLB% and recalculates them with each candle.
- If a better stop loss is computed, it replaces the existing stop loss. In this mode SLLT% will be disregarded.
○ Trail Stop till BE: Similar to trailing stop mode, but it stops trailing when the stop loss reaches the break-even point.
○ Trail Stop from BE: Similar to trailing stop mode, but it starts trailing when the stop loss reaches the break-even point.
○ Trail Price: Computes the trailing stop loss price based on an offset percentage (SLLT%) from the closing price of the current candle.
- If a better stop loss price is calculated, it will be set as the new stop loss price.
○ Trail Price till BE: Similar to the Trail Price mode, but it stops trailing when the stop loss reaches the break-even point.
○ Trail Price from BE: Similar to Trail Price mode, but it starts trailing when the stop loss reaches the break-even point.
○ Trail Incr: Adapts the trailing stop loss price based on the offset percentage (SLLT%).
- Each price change in favor of your position will incrementally adapt the trailing stop loss with SLLT%.
○ Trail Incr till BE: Similar to the Trail Incr mode, but it stops trailing when the stop loss reaches the break-even point.
• SLLT% - Stop Loss Long Trailing Percentage: This percentage serves as an offset or increment depending on your chosen trailing mode.
• SLSB - Stop Loss Short Base: Functions similarly to SLLB but for short positions.
• SLSB% - Stop Loss Short Base Percentage: Functions similarly to SLLB% but for short positions.
• SLSSRC - Stop Loss Short Source: Functions similarly to SLLSRC but for short positions.
• SLST - Stop Loss Short Trailing: Functions similarly to SLLT but for short positions.
• SLST% - Stop Loss Short Trailing Percentage: Functions similarly to SLLT% but for short positions.
█ EXIT TAKE PROFIT
Determine the Take Profit price based on your selected configuration.
• TPLB - Take Profit Long Base: Choose a take profit mode for calculating take profit prices in long positions.
○ Reward: Determines the take profit price using the Risk parameter (RISK%) and the calculated Stop Loss price and the set reward percentage (TPLB%).
- For example: Risk 1%, Calculated Stop loss price: $90, Entry price: $100, Reward (TPLB%): 2%, will result in a take profit price on $120.
○ Price Entry + Offset: Calculates the take profit price based on a offset percentage (TPLB%) from the entry price of the position.
- For example: Entry price: $100, Offset (TPLB%): 2%, will result in a take profit price on $102.
○ Source: Computes the take profit price based on an external input from another indicator defined in TPLSRC.
- If this results in an invalid price, the calculation will revert to using the price entry + offset.
○ Source + Offset: Determines the take profit price based on a positive or negative offset percentage (TPLB%) from an external indicator inpuy defined in TPLSRC.
- If this results in an invalid price, the calculation will fall back to using the price entry + offset.
• TPLB% - Take Profit Long Base Percentage: Define an offset percentage that will be applied in the price entry + offset and source + offset take profit modes.
• TPLSRC - Take Profit Long Source: Choose to connect an external indicator as the source for take profit (of course only those which provide price values eg: bollinger bands, moving averages... but not oscillators).
• TPLT - Take Profit Long Trailing:
○ Fixed: The initial take profit will be kept and no trailing take profit will be applied.
○ Trail Profit: Takes into account all settings defined in TPLB and TPLB% and recalculates them with each candle.
- If an applicable take profit is computed, it replaces the existing take profit. In this mode TPLT% will be disregarded.
○ Trail Profit till BE: Similar to trailing profit mode, but it stops trailing when the take profit reaches the break-even point.
○ Trail Profit from BE: Similar to trailing profit mode, but it starts trailing when the take profit reaches the break-even point.
○ Trail Price: Computes the trailing take profit price based on an offset percentage (TPLT%) from the closing price of the current candle.
- If an applicable take profit price is calculated, it will be set as the new take profit price.
○ Trail Price till BE: Similar to the Trail Price mode, but it stops trailing when the take profit reaches the break-even point.
○ Trail Price from BE: Similar to Trail Price mode, but it starts trailing when the take profit reaches the break-even point.
○ Trail Incr: Adapts the trailing take profit price based on the offset percentage (TPLT%). Each price change against your position will incrementally adapt the trailing take profit with TPLT%.
○ Trail Incr till BE: Similar to the Trail Incr mode, but it stops trailing when the take profit reaches the break-even point.
• TPLT% - Take Profit Long Trailing Percentage: This percentage serves as an offset or increment depending on your chosen trailing mode.
• TPSB - Take Profit Short Base: Functions similarly to TPLB but for short positions.
• TPSB% - Take Profit Short Base Percentage: Functions similarly to TPLB% but for short positions.
• TPSSRC - Take Profit Short Source: Functions similarly to TPLSRC but for short positions.
• TPST - Take Profit Short Trailing: Functions similarly to TPLT but for short positions.
• TPST% - Take Profit Short Trailing Percentage: Functions similarly to TPLT% but for short positions.
█ ENTRY INVESTMENT DISTRIBUTION
Based on your position investment calculation you can distribute the position investment accross the initial opening trade of the position (SIG%) or the follow up Dollar Cost Averaging (DCA%) or Break Out (BRO%) trades.
For example: SIG%: 10%, DCA%: 45%, BRO%: 45% and the calculated Position Investment is $100, then the initial trade will receive $10, DCA will receive $45, and BRO will receive $45 to work with. Disable BRO and or DCA by setting them to 0%. Keep in mind that the sum of SIG, BRO and DCA may not exceed 100%.
• SIG% - Initial order investment percentage based on the signal: The percentage of the position investment distributed over normal trades.
• DCA% - Dollar Cost Averaging investment percentage: The percentage of the position investment distributed to DCA trades.
• BRO% - Break Out investment percentage: The percentage of the position investment distributed to BRO trades.
█ ENTRY DCA
DCA (Dollar-Cost Averaging) is a risk mitigation strategy where the allocated DCA% budget from the Entry Investment Distribution is distributed among x levels (DCA#) based on calculated prices (DPLM) and order sizes (DOSM), when prices move against your position.
• DCA# - Maximum DCA levels: Set the maximum number of DCA levels.
• DPLM - DCA Price Level Mode: Choose a price level mode that determines at which prices the additional purchases are distributed:
○ Linear: Entry prices are evenly spaced at regular intervals.
○ QuadIn: Entry prices are front-loaded, with more at the beginning and fewer later.
○ QuadOut: Entry prices are back-loaded, with fewer at the beginning and more later.
○ QuadInOut: Entry prices start front-loaded, then become back-loaded.
○ CubicIn: Similar to QuadIn but with a smoother front-loaded distribution.
○ CubicOut: Similar to QuadOut but with a smoother back-loaded distribution.
○ ExpoIn: Entry prices are exponentially increasing, starting small and growing.
○ ExpoOut: Entry prices are exponentially decreasing, starting large and reducing.
○ ExpoInOut: Entry prices start exponentially increasing, then decrease exponentially.
• DOSM - DCA Order Size Mode: Choose a DCA budget distribution mode for order sizes:
○ Linear: Order sizes are evenly spaced at regular intervals.
○ QuadIn: Order sizes are front-loaded, with larger orders at the beginning and smaller ones later.
○ QuadOut: Order sizes are back-loaded, with smaller orders at the beginning and larger ones later.
○ QuadInOut: Order sizes start front-loaded and transition to back-loaded.
○ CubicIn: Similar to QuadIn but with a smoother front-loaded distribution of order sizes.
○ CubicOut: Similar to QuadOut but with a smoother back-loaded distribution of order sizes.
○ ExpoIn: Order sizes exponentially increase, starting small and growing.
○ ExpoOut: Order sizes exponentially decrease, starting large and reducing.
○ ExpoInOut: Order sizes start exponentially increasing, then decrease exponentially.
For a visual representation of the price or order size distribution modes, refer to online easing curves.
█ ENTRY BRO
BRO (Break Out) is a risk mitigation strategy where the allocated BRO% budget from the Entry Investment Distribution is distributed among x levels (BRO#) based on calculated prices (BPLM) and order sizes (BOSM), when prices move in favor of your position.
• BRO# - Maximum BRO levels: Set the maximum number of BRO levels.
• BPLM - BRO Price Level Mode: Choose a price level mode that determines at which prices the additional purchases are distributed:
○ Distribution easing modes work similar as the DCA easing modes.
• BOSM - BRO Order Size Mode: Choose a BRO budget distribution mode for order sizes:
○ Distribution easing modes work similar as the DCA easing modes.
█ ORDER SETTINGS
Fine-tune accuracy to match your exchange's trading constraints, enhancing backtest precision with these settings, default settings are least restrictive for crypto trading pairs.
• MINP - Mininmum Position Notional Value: Exchange-defined minimum notional value for positions:
○ Calculated based on your exchange's rules and is the minimum total value your position must hold to meet their requirements It is calculated by multiplying Quantity with price and leverage.
○ It helps ensure your trades align with your exchange's standards.
• MAXP - Maximum Position Notional Value: Exchange-defined maximum notional value for positions:
○ Similar to MINP, this value is calculated based on your exchange's rules and represents the maximum total value allowed for your position.
• MINQ - Mininmum Order Quantity: Least permissible order quantity based on exchange rules:
○ This is the smallest quantity of an asset that your exchange allows you to trade in a single order.
• MAXQ - Maximum Order Quantity: Highest permissible order quantity according to exchange rules:
○ Opposite of MINQ, this is the largest quantity of an asset you can trade in a single order as defined by your exchange.
• DECP - Decimals in Order Price: Allowed decimal places in order prices as per exchange specifications:
○ This value specifies the number of decimal places you can use when specifying the price of an order.
• DECQ - Decimals in Order Quantity: Permitted decimal places in order quantities according to exchange specifications:
○ Similar to DECP, this value indicates the number of decimal places you can use when specifying the quantity of an asset in an order.
█ STRATEGY CONDITIONS
Specify when the strategy is permitted to execute trades.
• DATE: Enable the Date Range filter to restrict entries to a specific date range.
○ START: Set a start date and hour to commence trading.
○ END: Set an end date and hour to conclude trading within the defined range.
• IDO - Maximum Intraday Orders: Limit the number of orders the strategy can place within a single trading day. Upon reaching this limit, the strategy temporarily halts further entries for the day.
• DL% - Maximum Intraday Loss%: Set a threshold for the maximum allowable intraday loss as a percentage of equity. When exceeded, the strategy temporarily suspends trading for the day.
• CLD - Maximum Consecutive Loss Days: Define the maximum number of consecutive days the strategy can incur losses. Upon reaching this limit, the strategy halts trading and avoids new entries.
• DD% - Maximum Drawdown: Specify the maximum permissible drawdown as a percentage of equity. If this limit is met, the strategy halts trading and refrains from placing additional entries.
• TP% - Total Profit %: Establish a target for the total profit percentage the strategy aims to achieve. Once this target is attained, the strategy halts trading and refrains from initiating new entries.
• TL% - Total Loss %: Define a limit for the total loss percentage relative to the initial capital. If this limit is exceeded, the strategy discontinues trading and refrains from placing further entries.
■ VISUALS
• LINE: Activate a colored dashed diagonal line to visually connect the entry and exit points of positions.
• SLTP: Enable visualization of stop loss, take profit, and break-even levels.
• PNL: Enable Break-Even and Close Lines along with a colored area in between to visualize profit and loss.
• ☼: Brightness % : Adjust the opacity of the plotted trading visuals.
• P - Profit Color : Choose the color for profit-related elements.
• L - Loss Color: Choose the color for loss-related elements.
• B - Breakeven Color : Select the color for break-even points.
• EL - Long Color: Specify the color for long positions.
• ES - Short Color: Specify the color for short positions.
• TRADE LABELING: For better analysis we've labeled all entries and exits conform with the type of order your strategy has executed, some examples:
○ EL-SIG0-124: Enter Long - Signal 0 - Position 124
○ EL-BRO1-130: Enter Long - BRO1 - Position 130
○ EL-BRO2-130: Enter Long - BRO2 - Position 130
○ ES-DCA1-140: Enter Short - DCA1 - Position 140
○ XS-DCA2-140: Exit Short - DCA2 - Position 140
○ XL-TP-150: Exit Long - Take Profit - Position 150
○ XS-TP-154: Exit Short - Take Profit - Position 154
○ XL-SL-160: Exit Long - Stop Loss - Position 160
○ XS-SL-164: Exit Short - Stop Loss - Position 164
○ XS-CND-165: Exit Short - Strategy Condition - Max intraday loss - Position 165
■ ALERT SETTINGS
For developers and those who wish to integrate TradingView alerts into their backend systems, we offer comprehensive labeling options.
• ALID: A unique identifier you've assigned to your alert.
• NAME: A structured name you've given to this strategy.
• LAYOUT: The layout key of the strategy, allowing direct chart linking from your backend.
• SYMBOL: The symbol on which the strategy operates.
○ ONCE: You can choose to include this information only in the first message to reduce message size and repetition in follow-up messages. (max. 4096 characters)
• TICK: The ticker for the strategy.
• CHART: The chart parameter containing the timeframe.period and timeframe.multiplier.
○ ONCE: You can choose to include this information only in the first message to reduce message size and repetition in follow-up messages. (max. 4096 characters)
• BAR: Includes bar information in the alert message.
• STRATEGY: Adds strategy inputs to the alert message.
○ ONCE: You can choose to include this information only in the first message to reduce message size and repetition in follow-up messages. (max. 4096 characters)
• PERFORMANCE: Incorporates strategy performance data into the alert message.
• SIGNAL: Appends received signal weights (EL, XL, ES, XS) to the alert message.
• ORDERS: Includes order details in the alert message.
• TAGS: Adds up to 6 tags and their corresponding values to the alert message.
○ ONCE: You can choose to include this information only in the first message to reduce message size and repetition in follow-up messages. (max. 4096 characters)
Of course we can't neglect letting you in on how this juicy JSON would look (without the // comments):
{
"id": 20726, // Message Id
"t": "2023-11-01T10:35:00Z", // Message Time
"al": { // Alert
"id": "639bfa9a-5f01-4031-8880-7ec01e972055", // Alert Id
"n": "TEST04", // Name
"l": "ABC123" // Layout
},
"sym": { // Symbol
"typ": "crypto", // Type
"r": "DOGEUSD.PM", // Root
"pre": "KRAKEN", // Prefix
"tc": "DOGEUSD.PM", // Ticker
"bc": "DOGE", // BaseCurrency
"c": "USD", // Currency
"d": "DOGEUSD Multi Collateral Perpetual Futures Contract", // Description
"mtc": 0.000001, // MinTick
"pv": 1, // PointValue
"ct": "PF_DOGEUSD" // CustomTicker
},
"ch": { // Chart
"pd": "1", // Period
"mul": 1 // Multiplier
},
"bar": { // Bar
"id": 20725, // Index
"t": "2023-11-01T10:33:00Z", // Time
"o": 0.066799, // Open
"h": 0.066799, // High
"l": 0.066799, // Low
"c": 0.066799, // Close
"v": 2924 // Vol
},
"strat": { // Strategy
"n": "Strategy - Plus / Connectable ", // Name
"sig": { // Signal
"c1e": true, // Connector1Enabled
"c1s": 500500.500501, // Connector1Source
"c1g": 1, // Connector1Gain
"c2e": false, // Connector2Enabled
"c2s": 0.067043, // Connector2Source
"c2g": 1, // Connector2Gain
"sm": "Swing (EL, ES)", // SignalMode
"xm": "Always", // ExitMode
"mlp": 0.01, // ExitModeMinPercLoss
"mpp": 0.01 // ExitModeMinPercProfit
},
"inv": { // Investment
"lb": "Equity", // LossBase
"lp": 50, // LossPerc
"pb": "Equity", // ProfitBase
"pp": 100, // ProfitPerc
"pcb": "Equity", // ProfitCustomBase
"pcp": 100, // ProfitCustomPerc
"pct": 10000, // ProfitCustomThreshold
"elp": 100, // LongPerc
"esp": 100, // ShortPerc
"rsk": 1, // MaxRisk
"lvg": 10 // MaxLeverage
},
"sl": { // StopLoss
"lb": "Price Entry + Offset", // LongBase
"lp": 0.2, // LongPerc
"lsrc": 0.067043, // LongSource
"lt": "Trail Stop", // LongTrailMode
"ltp": 0.2, // LongTrailPerc
"sb": "Price Entry + Offset", // ShortBase
"sp": 0.2, // ShortPerc
"ssrc": 0.067043, // ShortSource
"st": "Trail Stop", // ShortTrailMode
"stp": 0.2 // ShortTrailPerc
},
"tp": { // TakeProfit
"lb": "Price Entry + Offset", // LongBase
"lp": 1, // LongPerc
"lsrc": 0.067043, // LongSource
"lt": "Fixed", // LongTrailMode
"ltp": 1, // LongTrailPerc
"sb": "Price Entry + Offset", // ShortBase
"sp": 1, // ShortPerc
"ssrc": 0.067043, // ShortSource
"st": "Fixed", // ShortTrailMode
"stp": 1 // ShortTrailPerc
},
"dis": { // Distribution
"sigp": 10, // SignalPerc
"dcap": 0, // DCAPerc
"brop": 90 // BROPerc
},
"dca": { // DCA
"lvl": 3, // Levels
"pl": "linear", // ModePriceLevel
"os": "linear" // ModeOrderSize
},
"bro": { // BRO
"lvl": 3, // Levels
"pl": "expoIn", // ModePriceLevel
"os": "cubicOut" // ModeOrderSize
},
"ord": { // OrderSettings
"pmin": 5, // PNVMin
"pmax": 30000000, // PNVMax
"qmin": 0, // QtyMin
"qmax": 1000000000, // QtyMax
"dp": 6, // DecPrice
"dq": 6 // DecQty
},
"cnd": { // Conditions
"de": true, // DateRangeEnabled
"start": "2023-11-01T10:30:00Z", // StartTime
"end": "2024-12-31T23:30:00Z", // EndTime
"idoe": false, // MaxIntradayOrdersEnabled
"ido": 100, // MaxIntradayOrders
"dle": false, // MaxIntradayLossEnabled
"dl": 10, // MaxIntradayLossPerc
"clde": false, // MaxConsLossDaysEnabled
"cld": false, // MaxConsLossDays
"dde": false, // MaxDrawdownEnabled
"dd": 100, // MaxDrawdownPerc
"mpe": false, // MaxProfitEnabled
"mp": 200, // MaxProfitPerc
"mle": false, // MaxLossEnabled
"ml": -50 // MaxLossPerc
}
},
"perf": { // Performance
"ic": 1000, // InitialCapital
"eq": 1000, // Equity
"np": 0, // NetProfit
"op": 0, // OpenProfit
"ct": 0, // ClosedTrades
"ot": 0, // OpenTrades
"p": "FLAT", // MarketPosition
"ps": 0, // MarketPositionSize
"pp": "FLAT", // PreviousMarketPosition
"pps": 0 // PreviousMarketPositionSize
},
"sig": { // Signal
"el": 0, // EL
"xl": 0, // XL
"es": 6, // ES
"xs": 0 // XS
},
"ord": ,
"tag":
}
█ USAGE OF CONNECTABLE INDICATORS
■ Connectable chaining mechanism
Connectable indicators can be connected directly to the signal monitor, signal filter or strategy , or they can be daisy chained to each other while the last indicator in the chain connects to the signal monitor, signal filter or strategy. When using a signal filter you can chain the filter to the strategy input to make your chain complete.
• Direct chaining: Connect an indicator directly to the signal monitor, signal filter or strategy through the provided inputs (→).
• Daisy chaining: Connect indicators using the indicator input (→). The first in a daisy chain should have a flow (⌥) set to 'Indicator only'. Subsequent indicators use 'Both' to pass the previous weight. The final indicator connects to the signal monitor, signal filter, or strategy.
■ Set up this indicator with signals and a signal filter
The indicator provides visual cues based on signal conditions. However, its weight system is best utilized when paired with a connectable signal filter, monitor, or strategy .
Let's connect the Strategy - Plus to a connectable signal filter and connectable indicators :
1. Load all relevant indicators
• Load MA - Plus / Connectable
• Load Signal filter - Plus / Connectable
• Load Strategy - Plus / Connectable
2. Signal Filter Plus: Connect the MA - Plus to the Signal Filter
• Open the signal filter settings
• Choose one of the five input dropdowns (1→, 2→, 3→, 4→, 5→) and choose : MA - Plus / Connectable: Signal Connector
• Toggle the enable box before the connected input to enable the incoming signal
3. Signal Filter: Update the filter settings if needed
• The default filter mode for the trading direction is SWING, and is compatible with the default settings in the strategy and indicators.
4. Signal Filter: Update the weight threshold settings if needed
• All connectable indicators load by default with a score of 6 for each direction (EL, XL, ES, XS)
• By default, weight threshold is 'ABOVE' Threshold 1 (TH1) and Threshold 2 (TH2), both set at 5. This allows each occurrence to score, as the default score is 1 point above the threshold.
5. Strategy Plus: Connect one of the strategy plus inputs to the signal filters signal connector in the strategy settings
• Select a strategy input → and select the Signal filter - Plus: Signal connector
6. Strateg Plus: Enable filter compatible directions
• As the default setting of the filter is SWING, we should also set the SM (Strategy mode) to SWING.
7. Strateg Plus: You're ready to start optimizing
• Dive into all parameters and start optimizing your backtesting results.
█ BENEFITS
• Adaptable Modular Design: Arrange indicators in diverse structures via direct or daisy chaining, allowing tailored configurations to align with your analysis approach.
• Streamlined Backtesting: Simplify the iterative process of testing and adjusting combinations, facilitating a smoother exploration of potential setups.
• Intuitive Interface: Navigate TradingView with added ease. Integrate desired indicators, adjust settings, and establish alerts without delving into complex code.
• Signal Weight Precision: Leverage granular weight allocation among signals, offering a deeper layer of customization in strategy formulation.
• Advanced Signal Filtering: Define entry and exit conditions with more clarity, granting an added layer of strategy precision.
• Clear Visual Feedback: Distinct visual signals and cues enhance the readability of charts, promoting informed decision-making.
• Standardized Defaults: Indicators are equipped with universally recognized preset settings, ensuring consistency in initial setups across different types like momentum or volatility.
• Reliability: Our indicators are meticulously developed to prevent repainting. We strictly adhere to TradingView's coding conventions, ensuring our code is both performant and clean.
█ COMPATIBLE INDICATORS
Each indicator that incorporates our open-source 'azLibConnector' library and adheres to our conventions can be effortlessly integrated and used as detailed above.
For clarity and recognition within the TradingView platform, we append the suffix ' / Connectable' to every compatible indicator.
█ COMMON MISTAKES, CLARIFICATIONS AND TIPS
• Removing an indicator from a chain: Deleting a linked indicator and confirming the "remove study tree" alert will also remove all underlying indicators in the object tree. Before removing one, disconnect the adjacent indicators and move it to the object stack's bottom.
• Point systems: The azLibConnector provides 500 points for each direction (EL: Enter long, XL: Exit long, ES: Enter short, XS: Exit short) Remember this cap when devising a point structure.
• Flow misconfiguration: In daisy chains the first indicator should always have a flow (⌥) setting of 'indicator only' while other indicator should have a flow (⌥) setting of 'both'.
• Hide attributes: As connectable indicators send through quite some information you'll notice all the arguments are taking up some screenwidth and cause some visual clutter. You can disable arguments in Chart Settings / Status line.
• Layout and abbreviations: To maintain a consistent structure, we use abbreviations for each input. While this may initially seem complex, you'll quickly become familiar with them. Each abbreviation is also explained in the inline tooltips.
• Inputs: Connecting a connectable indicator directly to the strategy delivers the raw signal without a weight threshold, meaning every signal will trigger a trade.
• Layout and Abbreviations: Abbreviations streamline structure and input identification. Although they may seem complex initially, inline tooltips provide explanations, facilitating quick acclimatization.
• Total Trade Limit Error & Date-Time Filter: For deep backtesting, be mindful of the total trade limit. Utilize the date-time filter to narrow the test scope and avoid TradingView order limits.
• Calculation Timeout: Encounter a timeout? Adjust any parameter slightly to restart the calculation process.
• Message Character Limit: To stay within message character limits, consider turning off certain features or setting some to 'once'.
• Direct Indicator-to-Strategy Connection: When connecting an indicator directly to a strategy without thresholds, the strategy will default to long if weights are equally assigned.
• Pyramid Enabling with DCA and BRO: Activate pyramid orders, enabling you to optimize your strategy during Dollar Cost Averaging and Break Out trades.
• Recalculate & Fill Orders Properties: Adjusting these default settings in strategy properties tab may lead to unexpected behavior when backtesting. Approach with caution.
• Optimized for Crypto: Our indicators have been optimized and tested primarily on cryptocurrency markets. Results in other markets may vary.
• Inline Tooltips Documentation: Detailed documentation and guidance are available via inline tooltips for immediate assistance.
• Strategy Settings Margin: Set margin to 1 to be able to apply leverage.
• Styling Panel: Explore the styling panel to disable labels or any other visual cues to reduce clutter on busy charts, enhancing visual clarity and personalization.
• Applying Leverage on Spot Markets: Ensure that maximum leverage on spot markets is configured to 1.
• Unrealistic Order Sizes: Verify that the order book can accommodate your backtested order sizes.
█ A NOTE OF GRATITUDE
Through years of exploring TradingView and Pine Script, we've drawn immense inspiration from the community's knowledge and innovation. Thank you for being a constant source of motivation and insight.
█ RISK DISCLAIMER
Azullian's content, tools, scripts, articles, and educational offerings are presented purely for educational and informational uses. Please be aware that past performance should not be considered a predictor of future results.
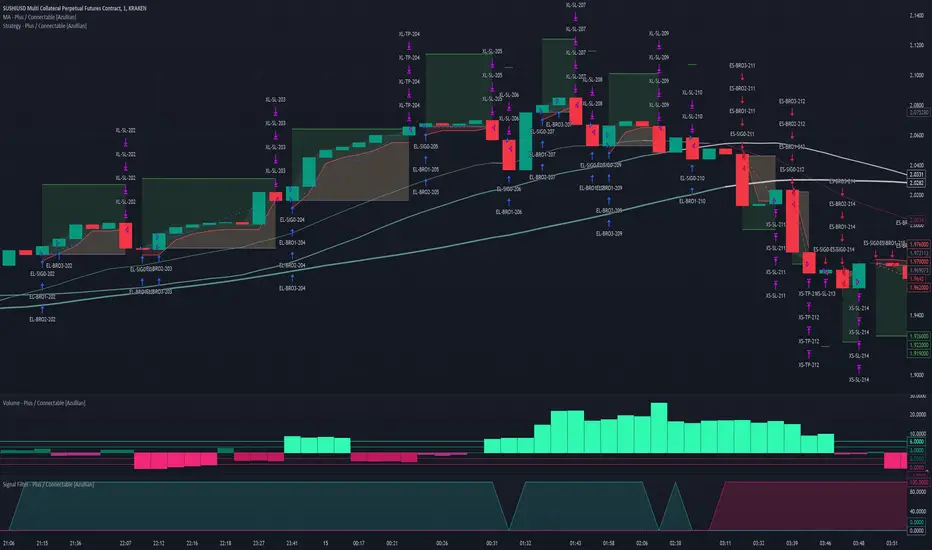
FreedX Grid Backtest█ FreedX Grid Backtest is an open-source tool that offers accurate GRID calculations for GRID trading strategies. This advanced tool allows users to backtest GRID trading parameters with precision, accurately reflecting exchange functionalities. We are committed to enhancing trading strategies through precise backtesting solutions and address the issue of unreliable backtesting practices observed on GRID trading strategies. FreedX Grid Backtest is designed for optimal calculation speed and plotting efficiency, ensuring users to achieve fastest calculations during their analysis.
█ GRID TRADING STRATEGY SETTINGS
The core of the FreedX Grid Backtest tool lies in its ability to simulate grid trading strategies. Grid trading involves placing orders at regular intervals within a predefined price range, creating a grid of orders that capitalize on market volatility.
Features:
⚙️ Backtest Range:
→ Purpose: Allows users to specify the backtesting range of GRID strategy. Closes all positions at the end of this range.
→ How to Use: Drag the dates to fit the desired backtesting range.
⚙️ Investment & Compounding:
→ Purpose: Allows users to specify the total investment amount and select between fixed and compound investment strategies. Compounding adjusts trade quantities based on performance, enhancing the grid strategy's adaptability to market changes.
→ How to Use: Set the desired investment amount and choose between "Fixed" or "Compound" for the investment method.
⚙️ Leverage & Grid Levels:
→ Purpose: Leverage amplifies the investment amount, increasing potential returns (and risks). Users can define the number of grid levels, which determines how the investment is distributed across the grid.
→ How to Use: Input the desired leverage and number of grids. The tool automatically calculates the distribution of funds across each grid level.
⚙️ Distribution Type & Mode:
→ Purpose: Users can select the distribution type (Arithmetic or Geometric) to set how grid levels are determined. The mode (Neutral, Long, Short) dictates the direction of trades within the grid.
→ How to Use: Choose the distribution type and mode based on the desired trading strategy and market outlook.
⚙️ Enable LONG/SHORT Grids exclusively:
█ MANUAL LEVELS AND STOP TRIGGERS
Beyond automated settings, the tool offers manual adjustments for traders seeking finer control over their grid strategies.
Features:
⚙️ Manual Level Adjustment:
→ Purpose: Enables traders to manually set the top, reference, and bottom levels of the grid, offering precision control over the trading range.
→ How to Use: Activate manual levels and adjust the top, reference, and bottom levels as needed to define the grid's scope.
⚙️ Stop Triggers:
→ Purpose: Provides an option to set upper and lower price limits, acting as stop triggers to close or terminate trades. This feature safeguards investments against significant market movements outside the anticipated range.
→ How to Use: Enable stop triggers and specify the upper and lower limits. The tool will automatically manage positions based on these parameters.
---
This guide gives you a quick and clear overview of the FreedX Grid Backtest tool, explaining how you can use this cutting-edge tool to improve your trading strategies.

FreedX Backtest Plus█ Our new FreedX Backtest PLUS template enhances TradingView backtesting with smart features like Mean Reversion, Flexible Volatility, Liquidation Filter, and Better Trend Filtering, making strategies more effective. It lets users set up automated alerts easily. This guide explains how to make the most of these improved features.
The Trading Date Settings feature in our TradingView script allows you to refine their backtesting parameters by specifying trading dates and hours. This feature enhances the accuracy of the backtest by aligning it with specific time frames and days, ensuring that the strategy is tested under relevant market conditions.
Features:
⚙️ Enable Trading Between Specific Dates:
🎯 Purpose:
→ Allows you to limit the backtesting of their strategy to a specific date range.
💡 How to Use:
→ Input the Start Date and End Date for the backtest period.
→ The script will execute the strategy only within this specified date range.
⚙️ Enable Trading Between Specific Hours:
🎯 Purpose:
→ Allows you to limit the backtesting of their strategy to a specific hour range.
💡 How to Use:
→ Input the start and end hour for in Trading Session section.
→ The script will execute the strategy only within this specified hour range.
⚙️ Enable Trading on Specified Days of the Week:
🎯 Purpose:
→ Gives you the option to conduct backtesting on selected days of the week, tailoring the strategy to particular market behaviours that may occur on these days.
💡 How to Use:
→ Select the days of the week for the backtest.
→ The script will activate the trading strategy only on these chosen days.
█ BUY/SELL TRIGGER SETTINGS
The Buy/Sell Trigger Settings feature is designed to provide users with flexibility in defining the conditions for 'LONG' and 'SHORT' signals based on various indicator types. This customization is crucial for tailoring strategies to different trading styles and market conditions.
Features:
⚙️ Single-Line Plotted Indicators :
🎯 Purpose:
→ Enables you to select a single-line plotted indicator as a source for backtesting. You can define specific levels to trigger 'LONG' or 'SHORT' signals.
💡 How to Use:
→ Choose a Single-Line Plotted indicator as the source.
→ Set the top and bottom levels for the indicator.
→ The script triggers 'LONG' signals at the bottom level and 'SHORT' signals at the top level.
⚙️ Two-Line Plotted Indicators :
🎯 Purpose:
→ Allows backtesting with two-line cross plot sources. Signals are generated based on the crossover of these lines.
💡 How to Use:
→ Select two lines as 'Source 1' and 'Source 2' for the indicator.
→ The script triggers a 'LONG' signal when 'Source 1' crosses above 'Source 2'.
→ Conversely, a 'SHORT' signal is triggered when 'Source 2' crosses above 'Source 1'.
⚙️ Custom Signals :
🎯 Purpose:
→ This setting enables users to define their own criteria for LONG, SHORT, and CLOSE signals based on custom indicator outputs.
💡 How to Use:
→ Select the custom source for your signals.
→ Define the output values that correspond to each signal type (e.g., “1” for 'LONG', “-1” for SHORT, and “0” for CLOSE).
→ The script will trigger signals according to these custom-defined values.
█ TP/SL SETTINGS
The TP/SL (Take Profit/Stop Loss) Settings feature is designed to give users control over their profit securing and risk mitigation strategies. This feature allows for setting custom TP and SL levels, which can be critical in managing trades effectively.
Features:
Custom TP/SL Levels for Long/Short Signals:
🎯 Purpose:
→ Enables users to set specific percentage levels for Take Profit and Stop Loss on long and short signals.
💡 How to Use:
→ In the TP/SL Settings, input the desired percentage for Take Profit (TP) and Stop Loss (SL).
→ For example, to secure a profit at a 10% price increase on LONG signals, set the “Long TP Percentage” to “10”.
█ STRATEGY SETTINGS
Strategy Settings provide a range of options to customize the trading strategy. These settings include leverage, position direction changes, and more, allowing users to tailor their strategy to their risk tolerance and market view.
Features:
⚙️ Enable Reverse Position:
🎯 Purpose:
→ Automatically closes a current position and opens a new one in the opposite direction upon detecting a signal for a market trend change.
🎯 Example:
→ If a LONG signal is received while in a SHORT position, the script will close the SHORT position and open a LONG position.
💡 How to Use:
→ Activate this feature in the Strategy Settings.
⚙️ Enable Spot Mode:
🎯 Purpose:
→ Disables short orders, using short signals only for closing long positions.
💡 How to Use:
→ Select the 'Spot Mode' option in the Strategy Settings.
⚙️ Enable Invert Signals:
🎯 Purpose:
→ Inverts all indicator signals, changing LONG signals to SHORT and vice versa.
💡 How to Use:
→ Opt for the 'Invert Signals' feature in the Strategy Settings.
⚙️ Enable Trailing Stop:
🎯 Purpose:
→ Triggers a trailing stop order on the exchange instead of a standard stop market order.
☢️ Caution:
→ The backtesting of this feature on TradingView may not accurately reflect actual strategy performance due to discrepancies between TradingView and exchange mechanisms.
💡 How to Use:
→ Select 'Trailing Stop' in the Strategy Settings.
⚙️ Enable Realistic TP & SL:
🎯 Purpose:
→ Goal is protect the user from unrealistic stop loss and take profit prices in live exchange trading conditions.
→ That feature continuously checks the take profit, stop loss and move stop loss prices to prevent unrealistic values. It changes their values according to (minimum realistic percent %)
💡 How to Use:
→ Select 'Enable Realistic TP & SL' in the Strategy Settings. Write min allowed percents.
█ LIMITER SETTINGS
Limiter Settings provide a range of options to customize the trading strategy. These settings include drawdown limits,contract limit, tradable ratio, for allowing users to tailor their strategy to their risk tolerance and market view.
⚙️ Leverage :
🎯 Purpose:
→ Allows users to apply leverage to their trades.
☢️ Caution:
→ High leverage can significantly increase the risk of liquidation.
→ High leverage and a high stop-loss price may override your fixed stoploss percentage, adjusting the stop-loss to the liquidation price.
💡 How to Use:
→ Set the desired leverage ratio in the Strategy Settings.
⚙️ Drawdown Limit:
🎯 Purpose:
→ Sets a maximum drawdown limit, automatically halting the strategy if this limit is reached, thereby controlling risk.
💡 How to Use:
→ Input the maximum drawdown limit (default: 100, min: 0, max: 100).
⚙️ Contract Limit:
🎯 Purpose:
→ Sets a maximum contract limit, beyond which the compound effect cannot be used. This is important to prevent market manipulation through large-volume orders.
💡 How to Use:
→ Input the maximum contract limit (min: 0).
⚙️ Tradable Ratio:
🎯 Purpose:
→ Sets a tradable ratio, it uses that ratio calculating entry cost for position. Main purpose is cash-out and cash-in according to balance change.
💡 How to Use:
→ Input the tradable ratio percent (default: 98, min: 0.1, max: 100).
█ CASH-OUT SETTINGS
Cash-Out Settings offer a money-saving mechanism that prevents entering positions with the entire balance due to cashed-out funds. It functions with a webhook alerts, but the 'Override Allocation %' option must be enabled.
⚙️ Cash-out Threshold %:
🎯 Purpose:
→ It is cash-out mechanism, it saves money with a target threshold.
💡 How to Use:
→ Input the threshold (min: 0).
⚙️ Cash-out Per Profitable Trades %:
🎯 Purpose:
→ It is cash-out mechanism, it saves money from every trade with a percent like commission.
💡 How to Use:
→ Input save percent% (min: 0).
█ ADAPTIVE VOLATILITY STRATEGY SETTINGS
Advanced Strategy Settings offer sophisticated methods for managing Stop Loss (SL) and Take Profit (TP) using the Average True Range (ATR). These settings are ideal for traders who want to incorporate volatility into their exit strategies.
Features:
⚙️ Enable ATR Stop Loss:
🎯 Purpose:
→ Automatically sets the Stop Loss price using the Average True Range at the time of entry.
💡 How to Use:
→ Activate 'ATR Stop Loss' to have the SL price calculated based on the current ATR.
⛓ Enable ATR Trailing Stop:
→ Dynamically updates the Stop Loss price with each new bar, according to the Average True Range.
→ Activate 'ATR Trailing Stop'.
→ Set the ATR Period to define the number of bars for ATR calculation.
→ Adjust the ATR SL Multiplier to determine the stop loss distance.
→ Modify the ATR TP Multiplier for setting the take profit distance.
⚙️ Enable ATR Take Profit:
🎯 Purpose:
→ Sets the Take Profit price based on the Average True Range at the time of entry.
💡 How to Use:
→ Choose 'ATR Take Profit' for TP price determination using ATR.
⚙️ Enable ATR Limit Entry:
🎯 Purpose:
→ Trade can not open in candle close price. Price should hit target price that based on average true range value.
💡 How to Use:
→ Choose 'ATR Limit Entry' for entry price determination using ATR.
⛓ Enable ATR Limit Entry Trailing Price:
→ Dynamically updates the entry price with each new bar, according to the Average True Range.
→ Activate 'ATR Limit Entry Trailing Price'.
→ Set the ATR Period to define the number of bars for ATR calculation.
→ Adjust the ATR SL Multiplier to determine the stop loss distance.
→ Modify the ATR TP Multiplier for setting the take profit distance.
█ TREND FILTERING SETTINGS
Trend Filtering Settings are designed to align trading strategies with the prevailing market trend, enhancing the precision of trade entries and exits. These settings utilize moving averages for trend analysis and decision-making.
Features:
⚙️ Enable Moving Average Filtering:
🎯 Purpose:
→ Limits trades based on moving average trends, blocking short trades in an uptrend and vice versa.
💡 How to Use:
→ Enable 'Trend Filtering'.
→ Set Fast and Slow MA Lengths for trend analysis.
→ Select the Timeframe for moving averages.
→ Choose the Moving Average Type for trend filtering.
🎯 Note:
→ Be cautious with timeframe selections; lower timeframes than the base may cause inconsistencies.
⛓ Exit on Trend Reversal:
→ Automatically closes a position when a market trend reversal is detected.
→ Turn on 'Exit on Trend Reversal' in the settings.
⛓ Ignore Counter Signals:
→ Ignores counter signals during trending market way.
→ If the trend way is long. All short signals will ignore and vice versa.
⛓ Enable Drawing On Chart:
→ Visually represents the trend filter directly on the chart for easy reference.
→ Activate 'Drawing On Chart' to see the trend filter overlaid on the trading chart.
⚙️ Enable Adx Filtering:
🎯 Purpose:
→ Limits trades based on adx value, blocking trades if trend strength is not enough or vice versa for invert mode.
💡 How to Use:
→ Enable 'Adx Filtering'.
→ Set Smoothing and Lengths for adx trend analysis.
→ Select level barrier for trend strength.
⚙️ Enable Custom Filtering:
🎯 Purpose:
→ Limits trades based on custom sources, blocking trades according to custom trades.
💡 How to Use:
→ Enable 'Custom Filtering'.
→ Select fast source.
→ Select slow source.
→ Enable lag mode.
█ MEAN REVERSION FILTERING SETTINGS
Mean Reversion Filtering Settings are designed to align trading strategies during accumulation market conditions. They set a distance from a line to permit trading. The purpose is to ensure that when the price strays too far from the mean line, it should revert back. In accumulation markets, price movements are generally horizontal. In such situations, mean reversion will operate like a grid, enabling profitable trades with low drawdown. However, when the market structure begins to trend, mean reversion filters may not be as profitable as in accumulation markets. For instance, let's say the price is rising and we are shorting the market until it reaches the mean price line. As the price goes up and the mean also rises, we will end up closing the position at a higher price, rendering the mean reversion system non-profitable. Therefore, consider this filter wisely; greater distances might work better in trending markets.
Features:
⚙️ Enable Kairi Filter:
🎯 Purpose:
→ Blocks trades based on distance percent between price and moving average.
💡 How to Use:
→ Enable 'Kairi Filter'.
→ Set Length and Distance Percent.
⛓ Enable Trend Drawing On Chart:
→ Visually represents the trend filter directly on the chart for easy reference.
→ Enable 'Drawing On Chart' to see the allowed regions overlaid on the trading chart with arrows.
⚙️ Enable VWAP Filter:
🎯 Purpose:
→ Blocks trades based on distance percent between price and volume weighted average price.
💡 How to Use:
→ Enable 'VWAP Filter'.
→ Set Timeframe as minutes and distance as percent.
⛓ Exit on Crossing with VWAP:
→ Automatically closes a position when the closing price of a candle crosses the VWAP.
→ Choose "Enable", 'Exit on Crossing with VWAP' in the settings.
⛓ Enable Drawing On Chart:
→ Visually represents the trend filter directly on the chart for easy reference.
→ Enable 'Drawing On Chart' to see the allowed regions overlaid on the trading chart with arrows.
█ LIQUIDATION FILTER SETTINGS
Liquidation filter compares the volume data of futures and spot markets.
Large differences in volume indicate unexpected market conditions, such as massive trading activities, which may signal liquidations.
Features:
⚙️ Enable Liquidation Filter:
🎯 Purpose:
→ Blocks trades based on extra ordinary volume differences in spot and futures market.
💡 How to Use:
→ Enable 'Liquidation Filter'.
→ Set behavior to react during that market conditions.
→ Set base amount to filter volume. This amount changes according to timeframe, you should find right amounts.
→ Liquidation candle count means, it is sum of liquidated candle count in last 20 bars.If you set 0, it means feature is disabled.
→ Detection, try to select the spot and perpetual symbols automatically, symbol names varies, it do not support all symbols, you should choose manually in that situation.
█ AUTOMATED ALERT SETTINGS
Automated Alert Settings are designed to integrate your TradingView script with webhook alerts. These settings allow for enhanced strategy execution and management.
Features:
Enable Webhook Alerts:
🎯 Purpose:
→ Trigger BUY, SELL, CHANGE_DIRECTION or MOVE_STOP_LOSS .
💡 How to Use:
→ Enable 'Webhook Alerts' in the settings.
→ Enter your Strategy Key.
→ Optionally, activate 'Override Allocation Percentage' to bypass the preset allocation percentage.
☢️ Caution:
→ Overriding the allocation percentage may result in trade entry errors due to misalignment between entry cost and available balance.
Enable Custom Alerts:
🎯 Purpose:
→ User can produce unique messages for different purposes.
💡 How to Use:
→ Enable 'Custom Alerts' in the settings.
→ Enter your message format type.
█ DEBUGGING SETTINGS
Debugging Settings are crucial for users who want to analyze and optimize their strategies. These settings provide tools for visualizing alerts on charts and accessing detailed data outputs.
Features:
⚙️ Enable Alert Plotting:
🎯 Purpose:
→ Allows users to visualize trading alerts directly on the chart, aiding in strategy analysis and refinement.
💡 How to Use:
→ Activate 'Alert Plotting' to draw alerts on the chart.
☢️ Caution:
→ It is recommended to disable this feature when creating actual trading alerts, as it can cause latency in signal processing.
⚙️ Enable Debugger Mode:
🎯 Purpose:
→ Facilitates strategy debugging by providing detailed data output in the TradingView Data Window.
💡 How to Use:
→ Turn on 'Debugger Mode' to access real-time data and metrics relevant to your strategy.
⚙️ Enable Table:
🎯 Purpose:
→ Facilitates strategy debugging by providing detailed data output in the TradingView Table on chart.
💡 How to Use:
→ Turn on 'Table' to access last closed candle data and metrics relevant to your strategy.
█ ADDITIONAL SETTINGS
⚙️ Enable Bar Magnifier
⚙️ Enable Using standard OHLC

Bitcoin Momentum StrategyThis is a very simple long-only strategy I've used since December 2022 to manage my Bitcoin position.
I'm sharing it as an open-source script for other traders to learn from the code and adapt it to their liking if they find the system concept interesting.
General Overview
Always do your own research and backtesting - this script is not intended to be traded blindly (no script should be) and I've done limited testing on other markets beyond Ethereum and BTC, it's just a template to tweak and play with and make into one's own.
The results shown in the strategy tester are from Bitcoin's inception so as to get a large sample size of trades, and potential returns have diminished significantly as BTC has grown to become a mega cap asset, but the script includes a date filter for backtesting and it has still performed solidly in recent years (speaking from personal experience using it myself - DYOR with the date filter).
The main advantage of this system in my opinion is in limiting the max drawdown significantly versus buy & hodl. Theoretically much better returns can be made by just holding, but that's also a good way to lose 70%+ of your capital in the inevitable bear markets (also speaking from experience).
In saying all of that, the future is fundamentally unknowable and past results in no way guarantee future performance.
System Concept:
Capture as much Bitcoin upside volatility as possible while side-stepping downside volatility as quickly as possible.
The system uses a simple but clever momentum-style trailing stop technique I learned from one of my trading mentors who uses this approach on momentum/trend-following stock market systems.
Basically, the system "ratchets" up the stop-loss to be much tighter during high bearish volatility to protect open profits from downside moves, but loosens the stop loss during sustained bullish momentum to let the position ride.
It is invested most of the time, unless BTC is trading below its 20-week EMA in which case it stays in cash/USDT to avoid holding through bear markets. It only trades one position (no pyramiding) and does not trade short, but can easily be tweaked to do whatever you like if you know what you're doing in Pine.
Default parameters:
HTF: Weekly Chart
EMA: 20-Period
ATR: 5-period
Bar Lookback: 7
Entry Rule #1:
Bitcoin's current price must be trading above its higher-timeframe EMA (Weekly 20 EMA).
Entry Rule #2:
Bitcoin must not be in 'caution' condition (no large bearish volatility swings recently).
Enter at next bar's open if conditions are met and we are not already involved in a trade.
"Caution" Condition:
Defined as true if BTC's recent 7-bar swing high minus current bar's low is > 1.5x ATR, or Daily close < Daily 20-EMA.
Trailing Stop:
Stop is trailed 1 ATR from recent swing high, or 20% of ATR if in caution condition (ie. 0.2 ATR).
Exit on next bar open upon a close below stop loss.
I typically use a limit order to open & exit trades as close to the open price as possible to reduce slippage, but the strategy script uses market orders.
I've never had any issues getting filled on limit orders close to the market price with BTC on the Daily timeframe, but if the exchange has relatively low slippage I've found market orders work fine too without much impact on the results particularly since BTC has consistently remained above $20k and highly liquid.
Cost of Trading:
The script uses no leverage and a default total round-trip commission of 0.3% which is what I pay on my exchange based on their tier structure, but this can vary widely from exchange to exchange and higher commission fees will have a significantly negative impact on realized gains so make sure to always input the correct theoretical commission cost when backtesting any script.
Static slippage is difficult to estimate in the strategy tester given the wide range of prices & liquidity BTC has experienced over the years and it largely depends on position size, I set it to 150 points per buy or sell as BTC is currently very liquid on the exchange I trade and I use limit orders where possible to enter/exit positions as close as possible to the market's open price as it significantly limits my slippage.
But again, this can vary a lot from exchange to exchange (for better or worse) and if BTC volatility is high at the time of execution this can have a negative impact on slippage and therefore real performance, so make sure to adjust it according to your exchange's tendencies.
Tax considerations should also be made based on short-term trade frequency if crypto profits are treated as a CGT event in your region.
Summary:
A simple, but effective and fairly robust system that achieves the goals I set for it.
From my preliminary testing it appears it may also work on altcoins but it might need a bit of tweaking/loosening with the trailing stop distance as the default parameters are designed to work with Bitcoin which obviously behaves very differently to smaller cap assets.
Good luck out there!

[AlbaTherium] MTF Internal Ranges Analysis - IRA-Phoenix for SMCIntroduction:
The MTF Internal Ranges Analysis - IRA - Phoenix acts as an extension to the original main SMC Indicator by AlbaTherium . This add-on provides insights into multi-timeframe internal structure points, swing structure points, POIs (Points of Interest), and order blocks (OB). By integrating this enhancement, your multi-timeframe analyses become more streamlined, expediting the process and minimizing chart workload .
This tool represents an advanced smart money technical analysis aimed at enhancing your trading experience. It introduces four pivotal concepts:
Main Features:
Multiple Timeframes and Confluences,
SCOB Internal Order Block.
Demand to Supply (D2S) or Supply to Demand (S2D) across Multiple timeframes
SCOB on LTF and SCM on HTF across same Candle
By combining these concepts all in one, traders can find confluences zones across multiple timeframes and gain a comprehensive understanding of market dynamics, theses confluences zones empower order block skills and potentiality, showcasing them as essential, crucial, powerful, strategic, and pivotal, one of the pillars in smart money concepts trading strategy to make more informed decisions.
Settings Overview:
Select timeframe {Select or current chart}
Inside bar ranges
Internal structure as Internal zigzag {turn on/ off / unconfirmed(live) zigzag}
Single Candle Mitigation Pattern {turn on/ off / confirmed / unconfirmed}
Single Candle Order Block Pattern {turn on/ off / confirmed / unconfirmed}
Demands and Supplies (D&S) {turn on/ off / confirmed / unconfirmed}
OB Mitigation {touch/ extended}
Understanding the Features:
Chapter 1: Multiple Timeframes and Confluences
Our Multi-timeframe analysis approach enables traders to analyze market trends and volatility across different timeframes. Confluences, where signals align across multiple timeframes, provide strong indications for trading opportunities.
Practical Example:
- With MTF IRA - Phoenix , traders can seamlessly transition between different timeframes while maintaining a cohesive analysis. For instance, traders can monitor the M15, H1, or M5 charts while focusing on entry on the M1 timeframe, enabling a holistic view of market trends and opportunities .
Chapter 2: SCOB Internal Order Block across Multiple Timeframe
SCOB Internal Order Block (SCOB IOB) highlights critical zones in price action, showcasing the dominance of aggressive buyers or sellers on orders blocks. As confluences accumulate across multiple timeframes, the strength of the order block intensifies, presenting entry opportunities.
Practical Example:
You have the ability to detect zones where price ranges have formed; these areas are highly sought after for taking buying as well as selling positions, especially when these areas are reflected across 1 or 3 timeframes.
The only practical way to see theses confluences is to use this Indicator, see the example below
Chapter 03: Demand to Supply (D2S) or Supply to Demand (S2D) across Multiple timeframes
The Demand to Supply or Supply to Demand feature within MTF Internal Ranges Analysis - IRA - Phoenix offers a nuanced analysis of price action dynamics across various timeframes. By identifying shifts in supply and demand zones, traders gain valuable insights into market sentiment and potential price reversals.
This feature enables traders to anticipate changes in market direction by recognizing the interplay between demand and supply across different timeframes. By understanding how price reacts at key support and resistance levels, traders can make informed decisions and capitalize on emerging trends.
The Demand to Supply or Supply to Demand feature enhances the indicator's usefulness by providing traders with actionable information to navigate complex market conditions effectively. With this comprehensive analysis, traders can better manage risk and optimize trading strategies across multiple timeframes.
Real-world Example:
Chapter 04: SCOB on LTF and SCM on HTF across same Candle
with MTF Internal Ranges Analysis - IRA - Phoenix , explores the concepts of SCOB (Single Candle Order Block) on Lower Timeframes (LTF) and SCM (Single Candle Mitigation) on Higher Timeframes (HTF).
SCOB on LTF refers to the identification and analysis of single candle order blocks within shorter timeframes. These blocks represent critical price levels where significant buying or selling activity occurred within a single candlestick. By recognizing SCOB patterns, traders can pinpoint key areas of market interest and anticipate potential price movements.
On the other hand, SCM on HTF involves analyzing single candle mitigation entries within longer timeframes. This technique aims to capitalize on price reversals or shifts in market sentiment indicated by single candlestick patterns. By incorporating SCM analysis, traders can gain insights into broader market trends and make strategic trading decisions accordingly.
the intricacies of SCOB on LTF and SCM on HTF, offering traders valuable tools to enhance their analysis and decision-making processes across different timeframes. Through a comprehensive understanding of these concepts, traders can identify high-probability trading opportunities and navigate the markets with confidence.
Real-world Example:
SCOB on M5 and SCM on M15 generate a powerful order block.
Conclusion:
MTF Internal Ranges Analysis - IRA - Phoenix for Smart Money Concepts is a valuable asset for traders seeking to add more insights in today's dynamic markets especially for Intraday Traders. By focusing on concepts like "Multiple timeframes and Confluences, with one single timeframe u can analyze all timeframes", "SCOB Internal Order Block. With its innovative features and user-friendly interface, whether you're a seasoned trader or just starting your journey, MTF IRA - Phoenix can help you navigate through the complexities of price action and make more informed trading choices.
This document provides an extensive overview of MTF Internal Ranges Analysis - IRA - Phoenix, emphasizing its importance in comprehending market dynamics and utilizing essential smart money concepts trading principles.

Aroon and ASH strategy - ETHERIUM [IkkeOmar]Intro:
This post introduces a Pine Script strategy, as an example if anyone needs a push to get started. This example is a strategy on ETH, obviously it isn't a good strategy, and I wouldn't share my own good strategies because of alpha decay. This strategy combines two technical indicators: Aroon and Absolute Strength Histogram (ASH).
Overview:
The strategy employs the Aroon indicator alongside the Absolute Strength Histogram (ASH) to determine market trends and potential trade setups. Aroon helps identify the strength and direction of a trend, while ASH provides insights into the strength of momentum. By combining these indicators, the strategy aims to capture profitable trading opportunities in Ethereum markets. Normally when developing strats using indicators, you want to find some good indicators, but you NEED to understand their strengths and weaknesses, other indicators can be incorporated to minimize the downs of another indicator. Try to look for synergy in your indicators!
Indicator settings:
Aroon Indicator:
- Two sets of parameters are used for the Aroon indicator:
- For Long Positions: Aroon periods are set to 56 (upper) and 20 (lower).
- For Short Positions: Aroon periods are set to 17 (upper) and 55 (lower).
Absolute Strength Histogram (ASH):
ASH is calculated with a length of 9 bars using the closing price as the data source.
Trading Conditions:
The strategy incorporates specific conditions to initiate and exit trades:
Start Date:
Traders can specify the start date for backtesting purposes.
Trade Direction:
Traders can select the desired trade direction: Long, Short, or Both.
Entry and Exit Conditions:
1. Long Position Entry: A long position is initiated when the Aroon indicator crosses over (crossover) the lower Aroon threshold, indicating a potential uptrend.
2. Long Position Exit: A long position is closed when the Aroon indicator crosses under (crossunder) the lower Aroon threshold.
3. Short Position Entry: A short position is initiated when the Aroon indicator crosses under (crossunder) the upper Aroon threshold, signaling a potential downtrend.
4. Short Position Exit: A short position is closed when the Aroon indicator crosses over (crossover) the upper Aroon threshold.
Disclaimer:
THIS ISN'T AN OPTIMAL STRATEGY AT ALL! It was just an old project from when I started learning pine script!
The backtest doesn't promise the same results in the future, always do both in-sample and out-of-sample testing when backtesting a strategy. And make sure you forward test it as well before implementing it!
