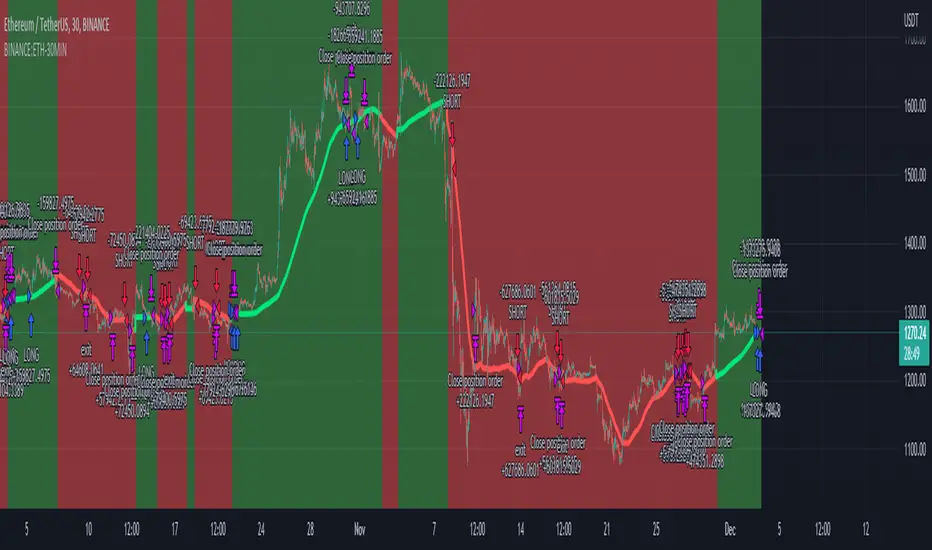
ETHUSDT Long-Short using EMA,OBV,ADX,LinearReg,DXY(No repaint)This script strategy is used to follow the trending EMA with a delta difference (Price-EMA) to know when to enter and with 5 variables mentioned below, stop loss is below EMA line all the time in long and above EMA line in short, is like a trailing stop after candle is closed. Hard stop is also placed to prevent big candles movements, also correlation between VIX and ETH when the correlation is <-0.2 the position can be opened.
Indicators used:
EMA , OBV , ADX , Linear regression and Dollar Index trending, Leverage is available for Long and Short positions.
LONG
When Price is above EMA and price-ema difference is smaller than "Long delta Price/MA"
OBV(4hrs) is above OBV-EMA(110)
Linear regression is strong
ADX is strong >50
DXY is trending down
SHORT
When Price is below EMA and ema-price difference is smaller than "Long delta Price/MA"
OBV(4hrs) is below OBV-EMA(110)
Linear regression is weak
ADX is weak <50
DXY is trending up
BINANCE:ETHUSDT 30 minutes Timeframe
Strategy!
Cyatophilum Universal Oscillator TraderAn indicator to backtest and create an infinite number of strategies using any external indicator.
═════════════════════════════════════════════════════════════════════════
█ HOW IT WORKS
The indicator allows you to create your oscillator strategy and get backtest results from the Strategy Tester.
You can also create alerts for each of the strategy events.
█ HOW TO USE
Choose a strategy direction long or short that you want to create.
Always use regular candle type.
Configure your entry condition . To use any other indicator as source, it needs to be added to the chart first.
If you have the basic (free) TradingView plan, you can only have 1 indicator on your chart, and cannot use this external source feature. For this case, the indicator has a list of built-in oscillator (that can be increased upon request).
Then choose your condition: Cross over, Greater than, Pullback, Turning up, etc.
You now have your entry and should already see trades on the chart!
Next you can fine tune your entry condition or move to the risk management and filters.
Configure your stop loss
Use the stop loss feature to exit a trade at a certain loss.
You can also create a trailing stop using price % movement or ATR.
Configure your profit target
Use the Take Profit feature to set a target in percentage of price. You can also make it trail.
Configure your safety orders
This indicator has a safety orders feature to reduce the risk of your trade. See more below.
Check your backtest parameters
Make sure that the initial capital and order size make sense. Since it is a pyramiding strategy with safety orders, the sum of all deals should not be bigger than the initial capital.
If you use % equity as order size, please note that it will create compounding.
Check the fees, by default they are set to 0.1%.
I also recommend to set a slippage that corresponds to your exchange's spread.
█ FEATURES
• Strategy direction
Configure to go long or short.
• Entry Conditions
- External Oscillator source
- Built-in Oscillator (for basic plans)
- Base Condition for entry (Less/Greater than, Crossing Up/Down, Pullback Bull/Bear, Turning Up/Down, etc. More can be added later on)
- Additional Momentum Condition: Oscillator should be rising/falling for x number of bars
- Addition Threshold Condition: Oscillator should be Greater/Lowser than x
• Trend Filter
Filter Trades using 1 or 2 moving averages (MTF), based on Slop Change or Price Cross. Trend line is green = only longs, red = only shorts.
• Entry Filters
- Volume filter to remove low volume entries
- Overbought/Oversold filters
- Flat market Filter
• Stop Loss and Take Profit
Configure your stop loss and take profit for long and short trades.
You can also make a trailing take profit and trailing stop.
• DCA (Safety orders)
Create up to 100 safety orders with configurable options for step and volume scaling, take profit from total volume, base and safety order size.
• Backtest Settings
Choose a backtest period, longs or shorts, wether to use limit orders or not.
Graphics
A Backtest Results panel with additional information from the strategy tester.
A lightweight mode to remove background plots and make the indicator load faster.
█ ALERTS
The indicator is using the alert() calls: it only uses 1 alert slot to send order messages for each event (Long/Short entry, stop loss, take profit, safety order, exit timer). This means basic-free TV plans can create 1 complete strategy.
To set your alert messages, open the indicator settings and scroll to the bottom of the "inputs" tab.
Create your alert after you set the messages in the indicator settings, and make sure "Any alert() function call" is set in the alert option.
Use placeholders to automatically replace values in your alert messages like price, target profit, order size etc. (see the indicator inputs).
█ BACKTEST RESULTS
The backtest settings can be seen in the 'Properties' tab of the backtest report below.
Please read the author instructions below for access.

Ultimate Strategy Template (Advanced Edition)Hello traders
This script is an upgraded version of that one below
New features
- Upgraded to Pinescript version 5
- Added the exit SL/TP now in real-time
- Added text fields for the alerts - easier to send the commands to your trading bots
Step 1: Create your connector
Adapt your indicator with only 2 lines of code and then connect it to this strategy template.
For doing so:
1) Find in your indicator where are the conditions printing the long/buy and short/sell signals.
2) Create an additional plot as below
I'm giving an example with a Two moving averages cross.
Please replicate the same methodology for your indicator wether it's a MACD , ZigZag , Pivots , higher-highs, lower-lows or whatever indicator with clear buy and sell conditions.
//@version=5
indicator(title='Moving Average Cross', shorttitle='Moving Average Cross', overlay=true, precision=6, max_labels_count=500, max_lines_count=500)
type_ma1 = input.string(title='MA1 type', defval='SMA', options= )
length_ma1 = input(10, title=' MA1 length')
type_ma2 = input.string(title='MA2 type', defval='SMA', options= )
length_ma2 = input(100, title=' MA2 length')
// MA
f_ma(smoothing, src, length) =>
rma_1 = ta.rma(src, length)
sma_1 = ta.sma(src, length)
ema_1 = ta.ema(src, length)
iff_1 = smoothing == 'EMA' ? ema_1 : src
iff_2 = smoothing == 'SMA' ? sma_1 : iff_1
smoothing == 'RMA' ? rma_1 : iff_2
MA1 = f_ma(type_ma1, close, length_ma1)
MA2 = f_ma(type_ma2, close, length_ma2)
// buy and sell conditions
buy = ta.crossover(MA1, MA2)
sell = ta.crossunder(MA1, MA2)
plot(MA1, color=color.new(color.green, 0), title='Plot MA1', linewidth=3)
plot(MA2, color=color.new(color.red, 0), title='Plot MA2', linewidth=3)
plotshape(buy, title='LONG SIGNAL', style=shape.circle, location=location.belowbar, color=color.new(color.green, 0), size=size.normal)
plotshape(sell, title='SHORT SIGNAL', style=shape.circle, location=location.abovebar, color=color.new(color.red, 0), size=size.normal)
/////////////////////////// SIGNAL FOR STRATEGY /////////////////////////
Signal = buy ? 1 : sell ? -1 : 0
plot(Signal, title='🔌Connector🔌', display = display.data_window)
Basically, I identified my buy, sell conditions in the code and added this at the bottom of my indicator code
Signal = buy ? 1 : sell ? -1 : 0
plot(Signal, title="🔌Connector🔌", transp=100)
Important Notes
🔥 The Strategy Template expects the value to be exactly 1 for the bullish signal, and -1 for the bearish signal
Now you can connect your indicator to the Strategy Template using the method below or that one
Step 2: Connect the connector
1) Add your updated indicator to a TradingView chart
2) Add the Strategy Template as well to the SAME chart
3) Open the Strategy Template settings and in the Data Source field select your 🔌Connector🔌 (which comes from your indicator)
From then, you should start seeing the signals and plenty of other stuff on your chart
🔥 Note that whenever you'll update your indicator values, the strategy statistics and visual on your chart will update in real-time
Settings
- Color Candles: Color the candles based on the trade state ( bullish , bearish , neutral)
- Close positions at market at the end of each session: useful for everything but cryptocurrencies
- Session time ranges: Take the signals from a starting time to an ending time
- Close Direction: Choose to close only the longs, shorts, or both
- Date Filter: Take the signals from a starting date to an ending date
- Set the maximum losing streak length with an input
- Set the maximum winning streak length with an input
- Set the maximum consecutive days with a loss
- Set the maximum drawdown (in % of strategy equity)
- Set the maximum intraday loss in percentage
- Limit the number of trades per day
- Limit the number of trades per week
- Stop-loss: None or Percentage or Trailing Stop Percentage or ATR - I'll add shortly multiple options for the trailing stop loss
- Take-Profit: None or Percentage or ATR - I'll add also a trailing take profit
- Risk-Reward based on ATR multiple for the Stop-Loss and Take-Profit
Special Thanks
Special thanks to @JosKodify as I borrowed a few risk management snippets from his website: kodify.net
Best
Dave

LuxAlgo - Backtester (S&O)The S&O Backtester is an innovative strategy script that encompasses features + optimization methods from our Signals & Overlays™ toolkit and combines them into one easy-to-use script for backtesting the most detailed trading strategies possible.
Our Signals & Overlays™ toolkit is notorious for its signal optimization methods such as the 'Optimal Sensitivity' displayed in its dashboard which provides optimization backtesting of the Sensitivity parameter for the Confirmation & Contrarian Signals.
This strategy script allows even more detailed & precise backtests than anything available previously in the Signals & Overlays™ toolkit; including External Source inputs allowing users to use any indicator including our other paid toolkits for take profit & stop loss customization to develop strategies, along with 10+ pre-built filters directly Signals & Overlays™' features.
🔶 Features
Full Sensitivity optimization within the dashboard to find the Best Win rates or Best Profits.
Counter Trade Mode to reverse signals in undesirable market conditions (may introduce higher drawdowns)
Built-in filters for Confirmation Signals w/ Indicator Overlays from Signals & Overlays™.
Built-in Confirmation exit points are available within the settings & on by default.
External Source Input to filter signals or set custom Take Profits & Stop Losses.
Optimization Matrix dashboard option showing all possible permutations of Sensitivity.
Option to Maximize for Winrate or Best Profit.
🔶 Settings
Sensitivity signal optimizations for the Confirmation Signals algorithm
Buy & Sell conditions filters with Indicator Overlays & External Source
Take Profit exit signals option
External Source for Take Profit & Stop Loss
Sensitivity ranges
Backtest window default at 2,000 bars
External source
Dashboard locations
🔶 Usage
Backtests are not necessarily indicative of future results, although a trader may want to use a strategy script to have a deeper understanding of how their strategy responds to varying market conditions, or to use as a tool for identifying possible flaws in a strategy that could potentially be indicative of good or bad performance in the future.
A strategy script can also be useful in terms of it's ability to generate more complete & configurable alerts, giving users the option to integrate with external processes.
In the chart below we are using default settings and built-in optimization parameters to generate the highest win rate.
Results like the above will vary & finding a strategy with a high win rate does not necessarily mean it will persist into the future, however, some indications of a well-optimized strategy are:
A high number of closed trades (100+) with a consistently green equity curve
An equity curve that outperforms buy & hold
A low % max drawdown compared to the Net Profit %.
Profit factor around 1.5 or above
In the chart below we are using the Trend Catcher feature from Signals & Overlays™ as a filter for standard Confirmation Signals + exits on a higher timeframe.
By filtering bullish signals only when the Trend Catcher is bullish, as well as bearish signals for when the Trend Catcher is bearish, we have a highly profitable strategy created directly from our flagship features.
While the Signals & Overlays features being used as built-in filters can generate interesting backtests, the provided External Sources can allow for even more creativity when creating strategies. This feature allows you to use many indicators from TradingView as filters or to trigger take-profit/stop-loss events, even if they aren't from LuxAlgo.
The chart below shows the HyperWave Oscillator from our Oscillator Matrix™ being used for take-profit exit conditions, exiting a long position on a profit when crossing 80, and exiting a short position when crossing 20.
🔶 Counter Trade Mode
Our thesis has always firmly remained to use Confirmation Signals within Signals & Overlays™ as a supportive tool to find trends & use as extra confirmation within strategies.
We included the counter-trade mode as a logical way to use the Confirmation signals as direct entries for longs & shorts within more contrarian trading strategies. Many traders can relate to using a trend-following indicator and having the market not respect its conditions for entries.
This mode directly benefits a trader who is aware that market conditions are generally not-so-perfect trends all the time. Acknowledging this, allows the user to use this to their advantage by introducing countertrend following conditions as direct entries, which tend to perform very well in ranging markets.
The big downfall of using counter-trade mode is the potential for very large max-drawdowns during trending market conditions. We suggest for making a strategy to consider introducing stop-loss conditions that can efficiently minimize max-drawdowns during the process of backtesting your creations.
Sensitivity Optimization
Within the Signals & Overlays™ toolkit, we allow users to adjust the Confirmation Signals with a Sensitivity parameter.
We believe the Sensitivity paramter is the most realistic way to generate the most actionable Confirmation Signals that can navigate various market conditions, and the Confirmation Signals algorithm was designed specifically with this in mind.
This script takes this parameter and backtests it internally to generate the most profitable value to display on the dashboard located in the top right of the chart, as well as an optimization table if users enable it to visualize it's backtesting.
In the image below, we can see the optimization table showing permutations of settings within the user-selected Sensitivity range.
The suggested best setting is given at the current time for the backtesting window that's customizable within the indicator. Optimized settings for technical indicators are not indicative of future results and the best settings are highly likely / guaranteed to change over time.
Optimizing signal settings has become a popular activity amongst technical analysts, however, the real-time beneficial applications of optimizing settings are limited & best described as complicated (even with forward testing).
🔶 Strategy Properties (Important)
We strongly recommend all users to ensure they adjust the Properties within the script settings to be in line with their accounts & trading platforms of choice to ensure results from strategies built are realistic.
🔶 How to access
You can see the Author's Instructions below to learn how to get access on our website.

CM_SlingShotSystem+_CassicEMA+Willams21EMA13 htc1977 editionThis strategy is a combination of 2 indicators based on EMA(actually x3 EMAs and Williams ind.
We usin this to see where EMA fast is above EMA slow(for long), entry position when price hit fast EMA and exit if trend changes or price overbought, or by stoploss 1%.
The opposite for a short position.
For better result You can change every EMA's, stoploss, Willam's ind and other visualisation in settings.
If You find good combination - please, let me know(if You want).
I will check it with ML, and attach it here.
Original indicators will write in comments

iMoku (Ichimoku Complete Tool) - The Quant Science iMoku™ is a professional all-in-one solution for the famous Ichimoku Kinko Hyo indicator.
The algorithm includes:
1. Backtesting spot
2. Visual tool
3. Auto-trading functions
With iMoku you can test four different strategies.
Strategy 1: Cross Tenkan Sen - Kijun Sen
A long position is opened with 100% of the invested capital ($1000) when "Tenkan Sen" crossover "Kijun Sen".
Closing the long position on the opposite condition.
There are 3 different strength signals for this strategy: weak, normal, strong.
Weak : the signal is weak when the condition is true and the price is above the 'Kumo'
Normal : the signal is normal when the condition is true and the price is within the 'Kumo'
Strong : the signal is strong when the condition is true and the price is below the 'Kumo'
Strategy 2: Cross Price - Kijun Sen
A long position is opened with 100% of the invested capital ($1000) when the price crossover the 'Kijun Sen'.
Closing the long position on the opposite condition.
There are 3 different strength signals for this strategy: weak, normal, strong.
Weak : the signal is weak when the condition is true and the price is above the 'Kumo'
Normal : the signal is normal when the condition is true and the price is inside the 'Kumo'
Strong : the signal is strong when the condition is true and the price is below the 'Kumo'
Strategy 3: Kumo Breakout
A long position is opened with 100% of the invested capital ($1000) when the price breakup the 'Kumo'.
Closing the long position with a percentage stop loss and take profit on the invested capital.
Strategy 4: Kumo Twist
A long position is opened with 100% of the invested capital ($1000) when the 'Kumo' goes from negative to positive (called "Twist").
Closing the long position on the opposite condition.
There are 2 different strength signals for this strategy: weak, and strong.
Weak : the signal is weak when the condition is true and the price is above the 'Kumo'
Strong : the signal is strong when the condition is true and the price is below the 'Kumo'
This script is compliant with algorithmic trading.
You can use this script with trading terminals such as 3Commas or CryptoHopper. Connecting this script is very easy.
1. Enter the user interface
2. Select and activate a strategy
3. Copy your bot's links into the dedicated fields
4. Create and activate alert
Disclaimer: algorithmic trading involves risk, the user should consider aspects such as slippage, liquidity and costs when evaluating an asset. The Quant Science is not responsible for any kind of damage resulting from use of this script. By using this script you take all the responsibilities and risks.

[Floride] 4LBS Strategy - COPPERHEAD**Hello. Because of my poor English skill, there may be many grammatically incorrect sentences in the description below. Thank you in advance for your understanding. **
Copperhead
This is a strategy created by combining three 4LBS channels, with the goal of catching the most volatile points, the points that are profitable as soon as you enter the position. The goal is to target the minimum number of entries and the vital point without missing it.
Characteristics
Each channel is L1 in 4LBS channels using a period of Fibonacci multiples.
You enter the position only when all three layers break through.
The initial losscut ratio setpoint is 3%.
If you don't get losscut and get on the trend safely, you liquidate your position when L4 breaks down.
advantages
- This strategy is profitable for almost every time frame. However, the longer the candle period you using in the chart, the more you have to increase the losscut ratio.
And if the candle period is shortened, you have to reduce the losscut ratio.
- One of the factors behind the strategy's bottom line is that it only enters at critical points and does not have a large number of entries.
- It was intended to make clear visual effects as simple as possible to understand the current trend.
- Korean Description -
전략 : 카퍼헤드
이것은 4LBS채널 3개를 결합하여 만든 전략으로, 가장 변동성이 극단적이 되는 지점들, 진입하자마자 수익이 나는 지점들을 캐치하는 것을 목표로 만든 전략입니다.
최소의 진입횟수, 그리고 급소를 놓치지 않고 공략하는 것이 목적입니다.
** 특징 **
- 각각의 채널은 피보나치 배수비의 기간을 사용한 4LBS의 L1입니다.
- 모든 3개의 레이어가 돌파될때에만 포지션을 진입합니다.
- 최초의 로스컷 설정점은 3%입니다.
- 로스컷당하지 않고 무사히 추세가 나오면, L4가 돌파될때 익절합니다.
** 장점 **
- 거의 모든 타임프레임에서 수익이 납니다. 그러나 기간이 길어질수록 손절폭을 늘려주어야 합니다. 그리고 캔들 기간이 짧아지면 손절폭도 따라서 조금씩 줄여주어야 합니다.
- 중요한 급소에서만 진입하고 진입횟수가 많지 않은것이 이 전략의 수익의 요인 중 하나입니다.
- 최대한 간명하게 현재추세를 알아볼 수 있도록, 명확한 시각적 효과를 살리려고 의도하였습니다.
** 수익률 **
The default setting of number of operating contracts is set to 10 contract operation. This may be a dramatic example, but This a deep backtesting result of how much the return would be from January 2019 when trading Bitcoin 10 contract.
기본설정은 10계약 운용으로 설정되어 있습니다. 이것은 좀 극적인 예일 수 있겠으나, 비트코인 10계약을 운용시 지난 2019년 1월부터 얼마나 수익률이 나오는지 딥 백테스팅한 것입니다.
지난 4월부터 로스컷 2.5% 설정하고 5개월동안의 운용할 시에 수익은 58561 달러, 1계약 운용시에는 5800여 달러입니다.
Entry Examples(during last 5 month)
지난 5달간의 진입 예시들

The Flower - Multiple Strategy Options in OneStrategy Overview
This strategy code currently includes four separate strategies to be used to either aid in discretionary trading or to be used algorithmically through the third-party system Profitview (profitview.app). Support for Pineconnector for use with MetaTrader 4 is in the works. The strategies have been designed with cryptocurrency trading in mind, however, the fundamentals apply to other assets.
The four strategies currently included are labeled “TSI Cross” (the default setting), “Oscillator Bands”, “Scalping”, and “McG/MA Cross”. Detailed information for each independent strategy can be found below, including sample settings configurations for each. A dropdown menu to select the strategy can be found under the “Strategy Options” set of settings under the Input tab of the strategy settings menu.
Additionally, the option to receive only long or short signals can be found alongside the Strategy Choice menu.
Take profit, stop loss, and trailing percentages are also included, found at the bottom of the Input tab under “TT and TTP” as well as “Stop Loss”. Make sure to understand the TP/SL ratio that you desire before use, as the desired hit rate/profitability percentage will be affected accordingly.
The only visuals associated with the strategy are two McGinley Dynamic lines, red (slow length) and green (fast length). These are relevant to the McGinley Cross strategy, but can be used alongside the other strategies if desired.
When viewing the backtesting data in the TradingView Strategy Tester, ensure that “use bar magnifier” is activated. This option can be found in the Properties tab of the strategy settings menu.
Profitview Settings
If you wish to utilize Profitview’s automation system, find the included “Profitview Settings” under the Input tab of the strategy settings menu. If not, skip this section entirely as it can be left blank. Options will be “OPEN LONG TITLE”, “OPEN SHORT TITLE”, “CLOSE LONG TITLE”, and “CLOSE SHORT TITLE”. If you wished to trade SOL, for example, you would put “SOL LONG”, “SOL SHORT”, “SOL CLOSE LONG”, and “SOL CLOSE SHORT” in these areas. Within your Profitview extension, ensure that your Alerts all match these titles. A sample of our Profitview syntax can be found below.
To set an alert for use with Profitview, go to the “Alerts” tab in TradingView, then create an alert. Make sure that your desired asset and timeframe are currently displayed on your screen when creating the alert. Under the “Condition” option of the alert, select the strategy, then select the expiration time. If using TradingView Premium, this can be open-ended. Otherwise, select your desired expiration time and date. This can be updated whenever desired to ensure the strategy does not expire. Under “Alert actions”, nothing necessarily needs to be selected unless so desired. Leave the “Alert name” option empty. For the “Message”, delete the generated message and replace it with {{strategy.order.alert_message}} and nothing else.
Strategy Choices
As mentioned above, this strategy code contains four separate strategy options. A detailed breakdown of each follows below:
Total Strength Index (TSI) Cross
This strategy option is the default choice. The main signal involved in this strategy is a crossover or crossunder of the TSI value line and TSI signal line, however, there are a few other signals involved in the creation of a long or short entry. In addition to the TSI, the strategy includes an Average Directional Index (ADX) threshold value, Jurik Volatility Bands (JVB), a Stoch RSI threshold, and an oscillator of choice in conjunction with a threshold of 0. This oscillator choice can be selected under the “Signal Options” menu in the Input tab of the strategy settings. The default oscillator is the Detrended Price Oscillator (DPO), though the option for Chande Momentum (CMO) or Rate of Change (RoC) are both viable for this strategy.
Individual settings for these can be found in the Input tab under “Oscillator Settings” (TSI, Stoch RSI, DPO, CMO, ROC), “Band/Channel Settings” (Jurik Volatility Bands Length/Smoothing), and “Directional Settings” (ADX Smoothing Long, DI Length Short, ADX Threshold).
Sample settings for SOLUSDT using the 20M timeframe:
- Oscillator Settings -- DPO Length (21), DPO *not* centered, RSI (Stoch) Length (4), Stochastic Length (4), TSI Long Length (25), TSI Short Length (13), TSI Signal Length (13), K (3), D (3)
- Band/Channel Settings -- Jurik Volatility Bands Length (25), Jurik Volatility Bands Smoothing (5)
- Directional Settings – JVB Price Threshold (0), ADX Smoothing Long (5), DI Length Short (5), ADX Threshold (23)
- Take Profit/Stop Loss – 0.85% TP, 0.005% TTP, 1.3% SL
Oscillator Bands
This strategy involves the usage of bands or channels that use oscillators as a source input. The main signal for this strategy derives from a cross of the band or channel and a hline of 0. Additionally, this includes a “Directional Filter” and a “MA Filter”. The selections for all of these can be found in the “Signal Options” section of the Input tab.
First option is for Oscillator Choice and includes DPO, CMO, ROC, RSI, TSI, and the Jurik price line. The individual settings for these can be found in the “Oscillator Settings” section. Different channels can be selected for the upper or lower bands, though it is not necessary for them to differ. These current options include Bollinger Bands and Jurik Volatility Bands, the individual settings for each found in the “Band/Channel Settings” section. Next is the MA Filter, of which you can select SMA, EMA, SMMA, WMA, VWMA, KAMA, JMA, or McGinley Dynamic. All options for these settings can be found in the “MA Filter Settings” section. Lastly, the Directional Filters can be selected for either direction like the upper/lower band selection. These filters include the ADX, Bull-Bear Power (BBP), Parabolic SAR (PSAR), or Jurik.
Sample settings for WAVESUSDT using the 20M timeframe:
- Oscillator Choice – DPO (Length – 30, uncentered)
- Upper and Lower Band – JVB Upper/Lower (Jurik Volatility Bands Length – 25; Smoothing – 10)
- MA Filter – VWMA – (MA Length – 40; Source – Open)
- Directional Filter – ADX (ADX Smoothing Long – 14; DI Length Short – 5; ADX Threshold – 22)
- Take Profit/Stop Loss – 0.85% TP, 0.005% TTP, 1.3% SL
Scalping
This strategy heavily relies on the usage of Parabolic SAR, accompanied by a “Directional Filter” (as discussed in the previous section) other than PSAR. This strategy can provide a higher frequency of trades as opposed to the other strategies available, however, it comes with slightly higher risk inherently. A riskier take profit/stop loss spread is recommended here, though risk should always be managed. The settings required for this strategy are all found under the “Directional Settings” section of the strategy inputs.
Sample settings for NEARUSDT using the 20M timeframe:
- Directional Filter set to ADX
- Directional Settings – ADX Smoothing Long (5), DI Length Short (5), ADX Threshold (22), PSAR Start Value (0.02), PSAR Increment (0.005), PSAR Max Value (0.15), PSAR Source (Close)
- Take Profit/Stop Loss – 0.75% TP, 0.005% TTP, 1.5% SL
McGinley Cross
This strategy revolves around the crossing of two McGinley Dynamic lines of varying lengths alongside an ADX filter as well as a DPO filter. McGinley is used as opposed to a standard moving average cross strategy as it adjusts for shifts in market speed and can better gauge market trends. The McGinley length settings can be found with the “MA Filter” settings, labeled as Fast Length and Slow Length. The fast length number should be smaller than the slow length.
Sample settings for SOLUSDT using the 20M timeframe:
- Oscillator Settings – DPO Length (30), uncentered
- MA Filter Settings – McGinley Fast Length (4), McGinley Slow Length (21)
- Take Profit/Stop Loss – 0.85% TP, 0.005% TTP, 1.4% SL
Comprehensive Settings List
Date and Time: From date and to date, adjustable for backtesting purposes.
Signal Options:
Oscillator Choices: Chande Momentum Oscillator (CMO), Detrended Price Oscillator (DPO), Rate of Change (ROC), Relative Strength Index (RSI), True Strength Index (TSI), Jurik Volatility Bands Priceline (JVB) – *** for use with TSI Cross or Oscillator Bands strategies only ***
Upper and Lower Band/Channel Choices: Bollinger Bands (BB) or Jurik Volatility Bands (JVB) -- *** for use with Oscillator Bands strategy only ***
MA/McG Filter: SMA, EMA, RMA, WMA, VWMA, Kaufmann MA, Jurik MA, McGinley Dynamic -- *** for use with Oscillator Bands strategy only ***
Directional Filter Long/Short: Average Directional Index (ADX), Bull/Bear Power (BBP), Parabolic SAR (PSAR), Jurik -- *** for use with Oscillator Bands strategy only ***
Profitview Settings: *** For use with ProfitView extension only, otherwise ignore ***
Oscillator Settings: *** For use with TSI Cross, Oscillator Bands, and McGinley Cross strategies ***
CMO Length, CMO Source – for Chande Momentum Oscillator
DPO Length, DPO Centered – for Detrended Price Oscillator
RoC Length, RoC Source – for Rate of Change
RSI Length, RSI MA Length – for Relative Strength Index
RSI (Stoch) Length, Stochastic Length, Stoch RSI Source, K, D – for Stochastic RSI
TSI Long Length, TSI Short Length, TSI Signal Length – for True Strength Index
Band/Channel Settings: *** For use with Oscillator Bands strategy ***
Jurik Volatility Bands Length, Jurik Volatility Bands Smoothing – for Jurik Volatility Bands
Bollinger Band Length, Bollinger Band Multiplier – for Bollinger Bands
Directional Settings: *** For use with Scalping and Oscillator Bands strategies ***
JVB Price Threshold – for Jurik Volatility as a directional setting
ADX Smoothing Long, DI Length Short, ADX Threshold – for Average Directional Index
PSAR Start Value, PSAR Increment, PSAR Max Value, PSAR Source – for Parabolic SAR
MA Filter Settings: *** For use with Oscillator Bands and McGinley Cross strategies ***
McGinley Fast/Slow Length – for McGinley Dynamic
MA Length, MA Source, MA Offset – for any other moving average
TP and TTP / Stop Loss: *** For use with ALL strategies ***
Long/Short Take Profit % -- for standard take profit settings
Enable Trailing, Trailing Take Profit % -- for trailing settings
Stop Loss % -- for standard stop loss settings; trailing can be enabled or disabled for stop loss
Disclaimers:
Some open-source code has been included -- Jurik Volatility Bands (by "ProValueTrader") and Trailing Take Profit/Stop Loss code (by jason5480). Additional code was used from the TradingView built-ins.
These strategies do NOT guarantee future returns. Apply caution in trading regardless of discretionary or algorithmic. Understand the concepts of risk/reward and the intricacies of each strategy choice before utilizing them in your personal trading.
Invites to the strategy will only be disseminated to those with express consent and knowledge of the invite prior to the action itself.

50 Pips A Day Strategy - Kaspricci50 Pips A Day Strategy
This strategy is designed to work on 1 hour timeframe. It is designed to capture the early market move of major forex pairs like EURUSD or GBPUSD. It takes the high and low of the first candle (7 a.m. GMT, London Stock Exchange opens) and places to pending orders at these prices levels.
High + additional gap in pips = buy stop pending order
Low + additional gap in pips = sell stop pending order
For both orders a stop loss of 15 pips and a take profit of 50 pips is used as a default. As soon as price triggers one pending order, the remaining pending order is cancelled. At the end of the configured session time all open and pending orders are closed / cancelled.
Settings
Trading Time - start and end time of session. It is configured for Monday to Friday only. At the beginning the first candle is used to define stop prices for pending orders.
Source for Buy Stop order - Default: high. Used to calculate buy stop order. You can add additional pips as a gap.
Source for Sell Stop order - Default: low. Used to calculate sell stop order. You can add additional pips as a gap.
Stop Loss in Pips - Default: 15. Used for both pending orders.
Take Profit in Pips - Default: 50. Used for both pending orders.
This strategy is for educational purposes only! It is not meant to be a financial recommendation.

MACD MTF Strategy [JoseMetal]============
ENGLISH
============
- Description:
This strategy uses my indicator MACD MTF (check my profile) to generate entries, it also has ATR to define Stop Loss and Take Profit if needed.
The strategy has several customizable options, which allows you to refine the strategy for your asset and timeframe.
You can customize settings for ALL indicator settings (MACD MTF and ATR).
- CUSTOM CONDITIONS TO ENTER A POSITION:
1. Both MACDs agree (current timeframe and higher timeframe).
2. Current timeframe MACD crossover.
3. Higher timeframe MACD crossover.
4. MACDs no longer agree with each other.
- EXIT CONDITION:
1. Predefined Stop Loss and Take Profit based on ATR (stop can be previous wick).
2. MACDs no longer agree with each other.
3. Opposite position entry.
- STOP LOSS TYPE:
1. ATR.
2. Previous wick.
- OTHER OPTIONS:
You can customize any setting for my MACD MTF and ATR.
- Visual:
ATR is shown for the Stop Loss / Take Profit.
The script prints the Take Profit as a green line, Stop Loss as a red line and entry price with a white line.
- Recommendations:
Recommended on 8H or 12H timeframe for the CURRENT timeframe, while using DAILY for the higher timeframe on the MACD MFT (by default).
Entry when BOTH MACDs agree and exit on opposite entry, this has NO TAKE PROFIT or STOP LOSS, so be careful, but gives the BEST profit overall, and being on 8H/12H + Daily lets you relax.
- Customization:
As you can see, almost everything is customizable, for colors and plotting styles check the "Style" tab.
Enjoy!
============
ESPAÑOL
============
- Descripción:
Esta estrategia utiliza mi indicador MACD MTF (revisa mi perfil) para generar entradas, también cuenta con ATR para definir Stop Loss y Take Profit si es necesario.
La estrategia tiene varias opciones personalizables, lo te le permiten refinar la estrategia para te activo y temporalidad.
Puedes personalizar la configuración de TODOS los indicadores (MACD MTF y ATR).
- CONDICIONES PERSONALIZADAS PARA ENTRAR EN UNA POSICIÓN:
1. Ambos MACDs coinciden (temporalidad actual y temporalidad superior).
2. Cruce del MACD en el marco de tiempo actual.
3. Cruce del MACD en el marco temporal superior.
4. Los MACD ya no coinciden entre sí (están en desacuerdo).
- CONDICIÓN DE SALIDA:
1. Stop Loss y Take Profit predefinidos basados en el ATR (el stop puede ser la mecha anterior).
2. Los MACDs ya no coinciden entre sí (están en desacuerdo).
3. Entrada en posición contraria.
- TIPO DE STOP LOSS:
1. ATR.
2. Mecha anterior.
- OTRAS OPCIONES:
Puede personalizar cualquier ajuste para mi MACD MTF y ATR.
- Visual:
El ATR se muestra para el Stop Loss / Take Profit.
El script imprime el Take Profit como una línea verde, el Stop Loss como una línea roja y el precio de entrada con una línea blanca.
- Recomendaciones:
Se recomienda en el marco de tiempo 8H o 12H para el marco de tiempo ACTUAL, mientras que se utiliza DIARIO para el marco de tiempo superior en el MACD MFT (por defecto).
Entrar cuando AMBOS MACDs están de acuerdo y salir en la entrada opuesta, esto no tiene TAKE PROFIT o STOP LOSS, así que tenga cuidado, pero da el MEJOR beneficio en general, y estar en 8H/12H + Diario le permite relajarse.
- Personalización:
Como puedes ver, casi todo es personalizable, para colores y estilos de trazado revisa la pestaña "Estilo".
¡Que lo disfrutes!

Multi Trend Cross Strategy TemplateToday I am sharing with the community trend cross strategy template that incorporates any combination of over 20 built in indicators. Some of these indicators are in the Pine library, and some have been custom coded and contributed over time by the beloved Pine Coder community. Identifying a trend cross is a common trend following strategy and a common custom-code request from the community. Using this template, users can now select from over 400 different potential trend combinations and setup alerts without any custom coding required. This Multi-Trend cross template has a very inclusive library of trend calculations/indicators built-in, and will plot any of the 20+ indicators/trends that you can select in the settings.
How it works : Simple trend cross strategies go long when the fast trend crosses over the slow trend, and/or go short when the fast trend crosses under the slow trend. Options for either trend direction are built-in to this strategy template. The script is also coded in a way that allows you to enable/modify pyramid settings and scale into a position over time after a trend has crossed.
Use cases : These types of strategies can reduce the volatility of returns and can help avoid large market downswings. For instance, those running a longer term trend-cross strategy may have not realized half the down swing of the bear markets or crashes in 02', 08', 20', etc. However, in other years, they may have exited the market from time to time at unfavorable points that didn't end up being a down turn, or at times the market was ranging sideways. Some also use them to reduce volatility and then add leverage to attempt to beat buy/hold of the underlying asset within an acceptable drawdown threshold.
Special thanks to @Duyck, @everget, @KivancOzbilgic and @LazyBear for coding and contributing earlier versions of some of these custom indicators in Pine.
This script incorporates all of the following indicators. Each of them can be selected and modified from within the indicator settings:
ALMA - Arnaud Legoux Moving Average
DEMA - Double Exponential Moving Average
DSMA - Deviation Scaled Moving Average - Contributed by Everget
EMA - Exponential Moving Average
HMA - Hull Moving Average
JMA - Jurik Moving Average - Contributed by Everget
KAMA - Kaufman's Adaptive Moving Average - Contributed by Everget
LSMA - Linear Regression , Least Squares Moving Average
RMA - Relative Moving Average
SMA - Simple Moving Average
SMMA - Smoothed Moving Average
Price Source - Plotted based on source selection
TEMA - Triple Exponential Moving Average
TMA - Triangular Moving Average
VAMA - Volume Adjusted Moving Average - Contributed by Duyck
VIDYA - Variable Index Dynamic Average - Contributed by KivancOzbilgic
VMA - Variable Moving Average - Contributed by LazyBear
VWMA - Volume Weighted Moving Average
WMA - Weighted Moving Average
WWMA - Welles Wilder's Moving Average
ZLEMA - Zero Lag Exponential Moving Average - Contributed by KivancOzbilgic
Disclaimer : This is not financial advice. Open-source scripts I publish in the community are largely meant to spark ideas that can be used as building blocks for part of a more robust trade management strategy. If you would like to implement a version of any script, I would recommend making significant additions/modifications to the strategy & risk management functions. If you don’t know how to program in Pine, then hire a Pine-coder. We can help!

Adulari ATSAdulari's Automated Trading Strategy combines more then 10+ innovative indicators and is carefully designed to provide honest and accurate backtesting results. We created and optimized this strategy to provide realistic results, not insane backtesting results that are very inconsistent and unrealistic. It is made for swing trading on the 15m timeframe. It is recommended to use the BYBIT:BTCUSDT pair.
This strategy has been thoroughly backtested throughout 2 years in order to provide optimal results.
ATS was designed to provide live results close to those of backtesting. It has been ensured this strategy is not overfitted.
Our strategy works in any market & allows users to:
Automate their trades using our alert system and integrations.
View realistic backtesting results.
Filter trades in irregular price action using our trend filters.
And many new features that can be found in the changelog below.
Our strategy detect the direction of trends for any asset & on any timeframe allowing traders to increase their confidence in positions and follow trends.
This strategy is built to be very profitable when used for long time periods. Compounding will make profits very solid.
We give our users the possibility to adjust the settings of the strategy to market price variations, as well as the option to make them less sensitive to irregular price movements so that it only trades predictable price action.
Save time by automating everything!
The strategy's settings play an important role towards profitable trades, however, the constant adjustment of these is not necessary since no overfitting is in play.
We made our strategy as flexible as possible in order to allow it to adjust to internal market dynamics, thus completely removing the need for traders to adjust any settings. We offer multiple setting profiles that are optimized for a certain market, with lower or higher risk.
If you are using this script you acknowledge past performance is not necessarily indicative of future results and there are many more factors that go into a profitable trade.

Davin's 10/200MA Pullback on SPY Strategy v2.0Strategy:
Using 10 and 200 Simple moving averages, we capitalize on price pullbacks on a general uptrend to scalp 1 - 5% rebounds. 200 MA is used as a general indicator for bullish sentiment, 10 MA is used to identify pullbacks in the short term for buy entries.
An optional bonus: market crash of 20% from 52 days high is regarded as a buy the dip signal.
An optional bonus: can choose to exit on MA crossovers using 200 MA as reference MA (etc. Hard stop on 50 cross 200)
Recommended Ticker: SPY 1D (I have so far tested on SPY and other big indexes only, other stocks appear to be too volatile to use the same short period SMA parameters effectively) + AAPL 4H
How it works:
Buy condition is when:
- Price closes above 200 SMA
- Price closes below 10 SMA
- Price dumps at least 20% (additional bonus contrarian buy the dip option)
Entry is on the next opening market day the day after the buy condition candle was fulfilled.
Sell Condition is when:
- Prices closes below 10 SMA
- Hard stop at 15% drawdown from entry price (adjustable parameter)
- Hard stop at medium term and long term MA crossovers (adjustable parameters)
So far this strategy has been pretty effective for me, feel free to try it out and let me know in the comments how you found :)
Feel free to suggest new strategy ideas for discussion and indicator building

Trend Follower Intraday [ Adjustable TF ]Trend Follower Intraday for 3 minute Time-Frame (Adjustable) , that has the time condition for Indian Markets as well.
Unlike the Free Scripts - Risk Management , Position Sizing , Partial Exit etc. are also included .
Send us a Message to know more about the strategy.
// ══════════════════════════════════════════════════════════════════════════ //
The Timing can be changed to fit other markets, scroll down to "TIME CONDITION" to know more.
The commission is also included in the strategy .
The basic idea is when ,
1) EMA1 crosses above EMA2 , is a Long condition .
2) EMA1 crosses below EMA2 , is a Short condition .
3) Green Section indicates Long position.
4) Red Section indicates Short position.
5) Allowed hours specifies the trade entry timing.
6) ATR STOP is the stop-loss value on chart , can be adjusted in INPUTS.
7) Target 1 is the 1st target value on chart , can be adjusted in INPUTS.
8) RISK is Maximum Risk per trade for the intraday trade can be changed .
9) Total Capital used can be adjusted under INPUTS.
10) ATR TRAIL is used for trailing after entry, as mentioned in the inputs below.
11) Check trades under the list of trades .
12) Trade only in liquid stocks .
13) Risk only 1-5% of total capital.
14) Inputs can be changed for better back-test results, but also manually check the trades before setting alerts
15) SQUARE OFF TIME - As you change the time frame , also change the square-off time to the candle's closing time.
Eg: For 3min Time-frame , Hour = 2Hrs | Minute = 57min
16) Strategy stops for the day if you have a loss .
17) COMMISSION value is set to 20Rs and SLIPPAGE value is set to 2 . Go to properties to change it .
*The input values and the results are mentioned under "BACKTEST RESULTS" below*
// ══════════════════════════════ //
// ————————> RISK MANAGEMENT <——————— //
// ══════════════════════════════ //
Risk management is done based on max loss per trade and can be adjusted in the INPUTS.
// ═══════════════════════════ //
// ————————> POSITION SIZE <——————— //
// ═══════════════════════════ //
Quantity of each trade is different based on the loss
// ═════════════════════════ //
// ————————> PROPERTIES <——————— //
// ═════════════════════════ //
COMMISSION , SLIPPAGE ,RECALCULATE is already mentioned in the code.
COMMISSION can be charges , based on the broker charges.
// ═══════════════════════════════//
// ————————> TIME CONDITION <————————— //
// ═══════════════════════════════//
The time can be changed in the INPUT.
The Indian Markets open at 9:15am and closes at 3:30pm.
The 'Allowed hours' under Inputs specifies the time at which Entries should happen .
"Close All" function closes all the trades before 3pm , at the open of the next candle.
To change the time to close all trades , check INPUT.
All open trades get closed by 3pm , because some brokers don't allow you to place fresh intraday orders after 3pm .
// ═══════════════════════════════════════════════ //
// ————————> BACKTEST RESULTS ( 123 CLOSED TRADES ) <————————— //
// ═══════════════════════════════════════════════ //
INPUTS can be changed for better Back-Test results.
The strategy applied to NSE:JSWENERGY (3 min Time-Frame and with a capital of 3,00,000 ) gives us 81% profitability , as shown below
It was tested for a period a 6 months with a Profit Factor of 1.957 ,net Profit of 43,000Rs .
Sharpe Ratio = 0.745
Sortino Ratio = 2.091
No strategy in the world promises 100% profits in all market conditions , so always define your risk before trading.
Also check Back-Test results manually ,before setting Alerts
The Graph has a Linear Curve with Consistent Profits.
The INPUTS are as follows,
1) EMA1 ————————————————> 38
2) EMA2 ————————————————> 118
3) ALLOWED HRS ———————————> 9:35 TO 14:30
4) ATR STOP ——————————————> 3.2
5) RISK ——————————————————> 3000
6) ATR TRAIL ———————————————> 2.6
7) TARGET 1 ————————————————> 2.4
8) MAX POSITION VALUE ——————————> 3,00,000
8) MAX DRAWDOWN —————————————> 9,000
8) SQUARE-OFF ————————————————> 14:57
NSE:JSWENERGY
Apply it to your charts Now !
NSE:JSWENERGY
Send us a message for FREE TRIALS | Instant Access
Thank You ☺

TradeIQ - Crazy Scalping Trading Strategy [Kaspricci]This strategy script is a combination of two indicators developed by LuxAlgo:
Triangular Momentum Oscillator & Real Time Divergences ( TMO )
Adjustable MA & Alternating Extremities (AMA)
The script combines the BUY and SELL signals from the TMO indicator with the BUY and SELL extremities shown by the AMA script and waits for the smoothed candles to grow in size. It places a SHORT or LONG order and sets a stop loss at the latest swing high or low (highes high or lowest low for a defined number of recent bars). A new LONG trade is highlighted by a green background. A new SHORT trade is highlighted by red background.
The trades will be closed once a new TMO indicator BUY or SELL signal appears or the color of the AMA extremities is switching from green to red and vice versa.
All parameters of TOM and AMA indicators are added as well and work the same way as in the original scripts provided by LuxAlgo.
The idea to combine these two indicators has been provided to me by TradIQ in his youtube video.
Please leave a comment in case you find a bug. In case you find a combination of parameters with a high win rat and high PnL I would be interested as well.

[MT] Strategy Backtest Template| Initial Release | | EN |
An update of my old script, this script is designed so that it can be used as a template for all those traders who want to save time when programming their strategy and backtesting it, having functions already programmed that in normal development would take you more time to program, with this template you can simply add your favorite indicator and thus be able to take advantage of all the functions that this template has.
🔴Stop Loss and 🟢Take Profit:
No need to mention that it is a Stop Loss and a Take Profit, within these functions we find the options of: fixed percentage (%), fixed price ($), ATR, especially for Stop Loss we find the Pivot Points, in addition to this, the price range between the entry and the Stop Loss can be converted into a trailing stop loss, instead, especially for the Take Profit we have an option to choose a 1:X ratio that complements very well with the Pivot Points.
📈Heikin Ashi Based Entries:
Heikin Ashi entries are trades that are calculated based on Heikin Ashi candles but their price is executed to Japanese candles, thus avoiding false results that occur in Heikin candlestick charts, this making in certain cases better results in strategies that are executed with this option compared to Japanese candlesticks.
📊Dashboard:
A more visual and organized way to see the results and necessary data produced by our strategy, among them we can see the dates between which our operations are made regardless if you have activated some time filter, usual data such as Profit, Win Rate, Profit factor are also displayed in this panel, additionally data such as the total number of operations, how many were gains and how many losses, the average profit and loss for each operation and finally the maximum profits and losses followed, which are data that will be very useful to us when we elaborate our strategies.
Feel free to use this template to program your own strategies, if you find errors or want to request a new feature let me know in the comments or through my social networks found in my tradingview profile.
| Update 1.1 | | EN |
➕Additions: '
Time sessions filter and days of the week filter added to the time filter section.
Option to add leverage to the strategy.
5 Moving Averages, RSI, Stochastic RSI, ADX, and Parabolic Sar have been added as indicators for the strategy.
You can choose from the 6 available indicators the way to trade, entry alert or entry filter.
Added the option of ATR for Take Profit.
Ticker information and timeframe are now displayed on the dashboard.
Added display customization and color customization of indicator plots.
Added customization of display and color plots of trades displayed on chart.
📝Changes:
Now when activating the time filter it is optional to add a start or end date and time, being able to only add a start date or only an end date.
Operation plots have been changed from plot() to line creation with line.new().
Indicator plots can now be controlled from the "plots" section.
Acceptable and deniable range of profit, winrate and profit factor can now be chosen from the "plots" section to be displayed on the dashboard.
Aesthetic changes in the section separations within the settings section and within the code itself.
The function that made the indicators give inputs based on heikin ashi candles has been changed, see the code for more information.
⚙️Fixes:
Dashboard label now projects correctly on all timeframes including custom timeframes.
Removed unnecessary lines and variables to take up less code space.
All code in general has been optimized to avoid the use of variables, unnecessary lines and avoid unnecessary calculations, freeing up space to declare more variables and be able to use fewer lines of code.
| Lanzamiento Inicial | | ES |
Una actualización de mi antiguo script, este script está diseñado para que pueda ser usado como una plantilla para todos aquellos traders que quieran ahorrar tiempo al programar su estrategia y hacer un backtesting de ella, teniendo funciones ya programadas que en el desarrollo normal te tomaría más tiempo programar, con esta plantilla puedes simplemente agregar tu indicador favorito y así poder aprovechar todas las funciones que tiene esta plantilla.
🔴Stop Loss y 🟢Take Profit:
No hace falta mencionar que es un Stop Loss y un Take Profit, dentro de estas funciones encontramos las opciones de: porcentaje fijo (%), precio fijo ($), ATR, en especial para Stop Loss encontramos los Pivot Points, adicionalmente a esto, el rango de precio entre la entrada y el Stop Loss se puede convertir en un trailing stop loss, en cambio, especialmente para el Take Profit tenemos una opción para elegir un ratio 1:X que se complementa muy bien con los Pivot Points.
📈Entradas Basadas en Heikin Ashi:
Las entradas Heikin Ashi son operaciones que son calculados en base a las velas Heikin Ashi pero su precio esta ejecutado a velas japonesas, evitando así́ los falsos resultados que se producen en graficas de velas Heikin, esto haciendo que en ciertos casos se obtengan mejores resultados en las estrategias que son ejecutadas con esta opción en comparación con las velas japonesas.
📊Panel de Control:
Una manera más visual y organizada de ver los resultados y datos necesarios producidos por nuestra estrategia, entre ellos podemos ver las fechas entre las que se hacen nuestras operaciones independientemente si se tiene activado algún filtro de tiempo, datos usuales como el Profit, Win Rate, Profit factor también son mostrados en este panel, adicionalmente se agregaron datos como el número total de operaciones, cuantos fueron ganancias y cuantos perdidas, el promedio de ganancias y pérdidas por cada operación y por ultimo las máximas ganancias y pérdidas seguidas, que son datos que nos serán muy útiles al elaborar nuestras estrategias.
Siéntete libre de usar esta plantilla para programar tus propias estrategias, si encuentras errores o quieres solicitar una nueva función házmelo saber en los comentarios o a través de mis redes sociales que se encuentran en mi perfil de tradingview.
| Actualización 1.1 | | ES |
➕Añadidos:
Filtro de sesiones de tiempo y filtro de días de la semana agregados al apartado de filtro de tiempo.
Opción para agregar apalancamiento a la estrategia.
5 Moving Averages, RSI, Stochastic RSI, ADX, y Parabolic Sar se han agregado como indicadores para la estrategia.
Puedes escoger entre los 6 indicadores disponibles la forma de operar, alerta de entrada o filtro de entrada.
Añadido la opción de ATR para Take Profit.
La información del ticker y la temporalidad ahora se muestran en el dashboard.
Añadido personalización de visualización y color de los plots de indicadores.
Añadido personalización de visualización y color de los plots de operaciones mostradas en grafica.
📝Cambios:
Ahora al activar el filtro de tiempo es opcional añadir una fecha y hora de inicio o fin, pudiendo únicamente agregar una fecha de inicio o solamente una fecha de fin.
Los plots de operaciones han cambiados de plot() a creación de líneas con line.new().
Los plots de indicadores ahora se pueden controlar desde el apartado "plots".
Ahora se puede elegir el rango aceptable y negable de profit, winrate y profit factor desde el apartado "plots" para mostrarse en el dashboard.
Cambios estéticos en las separaciones de secciones dentro del apartado de configuraciones y dentro del propio código.
Se ha cambiado la función que hacía que los indicadores dieran entradas en base a velas heikin ashi, mire el código para más información.
⚙️Arreglos:
El dashboard label ahora se proyecta correctamente en todas las temporalidades incluyendo las temporalidades personalizadas.
Se han eliminado líneas y variables innecesarias para ocupar menos espacio en el código.
Se ha optimizado todo el código en general para evitar el uso de variables, líneas innecesarias y evitar los cálculos innecesarios, liberando espacio para declarar más variables y poder utilizar menos líneas de código.

[D] Dudu 95 Strategy Template ver.1.1.Hello Guys! Nice to meet you all!
This is my Second script after changing My Profile Name!
I updated my strategy template before - I added some filter conditions (EMA, ADX, DMI).
If there's something to update, I will update this script!
Thank you!
-----
I made this based on the open source strategies by jason5480, kevinmck100, myncrypto.
Thank you All!
### Filter
1. Can Choose whether to use filter.
2. Filters Based on ATR, EMA, ADX, and DMI are ready to use.
### StopLoss
1. Can Choose Stop Loss Type: Percent, ATR, Previous Low / High.
2. Can Chosse inputs of each Stop Loss Type.
### Take Profit
1. Can set Risk Reward Ratio for Take Profit.
- To simplify backtest, I erased all other options except RR Ratio.
- You can add Take Profit Logic by adding options in the code.
2. Can set Take Profit Quantity.
### Risk Manangement
1. Can choose whether to use Risk Manangement Logic.
- This controls the Quantity of the Entry.
- e.g. If you want to take 3% risk per trade and stop loss price is 6% below the long entry price,
then 50% of your equity will be used for trade.
2. Can choose How much risk you would take per trade.
### Plot
1. Added Labels to check the data of entry / exit positions.
2. Changed and Added color different from the original one. (green: #02732A, red: #D92332, yellow: #F2E313)

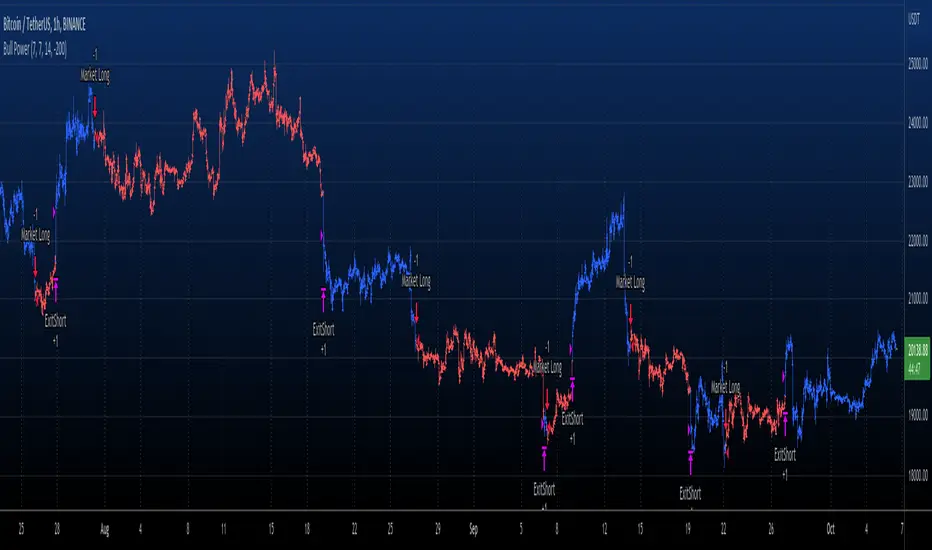
Elder Ray (Bull Power) TP and SL Developed by Dr Alexander Elder, the Elder-ray indicator measures buying
and selling pressure in the market. The Elder-ray is often used as part
of the Triple Screen trading system but may also be used on its own.
Dr Elder uses a 13-day exponential moving average (EMA) to indicate the
market consensus of value. Bull Power measures the ability of buyers to
drive prices above the consensus of value. Bear Power reflects the ability
of sellers to drive prices below the average consensus of value.
Bull Power is calculated by subtracting the 13-day EMA from the day's High.
Bear power subtracts the 13-day EMA from the day's Low.
WARNING:
- For purpose educate only
- This script to change bars colors.
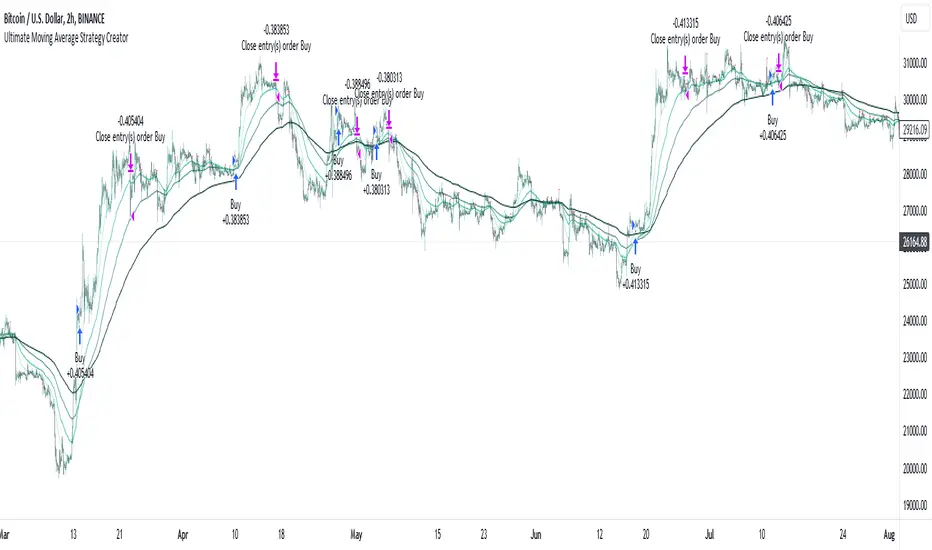
Ultimate Moving Average Strategy CreatorHave you ever wanted to create your OWN strategy, but don't have coding experience? Well now you can.
With simple settings, but millions of potential strategies and combinations, this indicator / strategy lets YOU make ALL the rules.
Start by choosing up to 4 moving averages from all the various types - Simple, Exponential, Hull, Volume-Weighted, etc. Choose the period and choose price source.
Now the fun part.
You select your values to compare and how to compare them. Want to test if the Fast Moving Average crosses over the Slow Moving Average? No problem. Want to add an additional test to check the closing price is greater than the Fast Moving Average? Done.
With additonal options to set take profit % and stop loss %, as well as a date range and the option for 'Long Only' positions, you can instantly see the results of any strategy in the strategy tester, then simply make an adjustment and refine the criteria without having to know or understand any of the complex coding and scripting.
I have tried many popular moving average strategies, but irrespective of the results, the thing that stood out to me was how inflexible they were. If it was designed to test a triple crossover, that's all it could do. With this indicator, literally anything is possible and modifying the parameters couldn't be easier.
Crypto BTC Correlation Scalper Gaps StrategyThis strategy is based on the gaps theory.
In this case we have the BTC futures from CME, which acts in a way similar to stocks, and we can have gaps present between close/open session, and also sometimes between same candle due to huge movements intra candle.
At the same time I have combined this with a daily moving average, to help out a bit with the trend, since we are looking at small timeframe like 1-15/30min .
On top of that we have a reverse option, where long = short and viceversa, which can be used with against BTC pairs .
Rule are simple:
For long, we have a long gap and the close of the correlated candle is above daily sma
For short, we have a short gap and the close of the correlated candle is below daily sma
For exit:
For exit, we take the highest highest values for short entry TP, meaning we get the different from the HH and rest the current open candle distance, and use that distance as a TP.
At the same time for long entry, we take the lowest low value and rest current close of the candle to that value, and we get the TP.
Can also be applied this logic for SL aswell but from the test I have found out that exiting based on a reverse condition(when tp is not being hit), gives better results/dd overall.
If you have any questions, please let me know !

LarryWillians - Simple StrategyA simple and classic strategy on market, created by LarryWillians using a EMA9.
The brute model use a Cross from closing price on EMA9. But occurs many false entries.
In other to correct this kind of thing, I add a SMA21 to confirm the trend and decrease numbers of false trades.
The strategy waits to break the last High (for buy) a position.
As a strategy requires a Risk Mannager, I created a simple way to trailing this, as well a Take Proft and Stop Loss in %.
Is not the best strategy but, is one of the most famous on financial markets. I did my adaptive version as simples as it is :)

Faytterro Estimator StrategyWhat is "Faytterro Estimator Strategy"?
"Faytterro Estimator Strategy" is strategy of faytterro estimator. if you want to know more about faytterro estimator:
What it does?
It trades according to the signals given by faytterro estimator and some additional restrictions.
How it does it?
Using the faytterro estimator and the following variables, it gives buy and sell signals in different sizes at ideal points.
How to use it?
The "source" part is used to change the source of faytterro estimator.
The "length" is the length of the fayterro estimator.
"Minimum entry-close gap" is the minimum distance between two transactions opened in opposite directions. For example, if you opened long at 20 500 and "Minimum entry-close gap" is 400, you will not receive a sell signal before the price goes above 20900.
If "minimum entry-entry gap" is the minimum difference between two transactions opened in the same direction. For example, if you open long at 20500 level and the "minimum entry-entry gap" is 400, you will not receive a "buy" signal before the price goes below the 20100 level.
"strong entry size" determines the size of strong signals. The size of ordinary signals is always 1.
note: default values for btc/usdt 1 hour timeframe.

Open High Low StrategyThis is a very simple, yet effective and to some extend widely followed scalping strategy to capture the underling sentiments of the counter whether it will go up or down.
What is it?
This is Open-High-Low (OLH) strategy.
As you already aware of Candlestick patterns, there is patterns called as Marubozu patterns where the sell wick or buy wick either ceases to exists (or very small). This is exactly in the same principle.
In OLH strategy: The buy signal appears when the Open Price is the Low Price. It means if you draw the candlestick, there is no bottom wick. So after the opening of the candle, the demand drives the price up to the level, some selling may or may not come and closes in green. This indicates a strong upward biasness of the underlying counter.
Similarly, a sell signal appears when the Open price is the High Price. It means there is no upper wick. So there is no buying pressure, since the opening of the candle, sellers are in force and pulls down the price to a closing.
This strategy generates the signal at the close of the candle (technically barstate.isconfirmed). Because until the bar is real-time there is no option to know the final closing or high. So you will see the bar on which it generates the buy or sell signal is actually indicates the previous bar as OLH bar.
To determine the Stop-Loss, it uses the most widely known SL calculation of:
For buy signal, it takes the low of the last 7 candles and substract the ATR (Average True Range) of 14-period.
For sell signal, it takes the high of the last 7 candles and add it to the ATR (Average True Range) of 14-period.
One can plot the SL lines as dotted green and red lines as well to see visually.
Default Risk:Reward is 1:2, Can be customizable.
What is Unique?
Of course the utter simplistic nature of this strategy is it's key point. Very easy and intuitive to understand.
There are awesome strategies in this forum that talks about the various indicators combinations and what not.
Instead of all this, in a 15m NSE:NIFTY chart, it generates a good ~ 47% profit-factor with 1:2 Risk Reward ratio. Means if you loose a trade you will loose 1% of account and if you win you will gain 2%. Means 3 trades (2 profits and 1 loss) in a trading session result 3% overall gain for the day. (Assuming you are ready with 1% draw down of your account per trade, at max).
Disclaimer:
This piece of software does not come up with any warrantee or any rights of not changing it over the future course of time.
We are not responsible for any trading/investment decision you are taking out of the outcome of this indicator.
