Nifty50 Swing Trading Super Indicator# 🚀 Nifty50 Swing Trading Super Indicator - Complete Guide
**Created by:** Gaurav
**Date:** August 8, 2025
**Version:** 1.0 - Optimized for Indian Markets
---
## 📋 Table of Contents
1. (#quick-start-guide)
2. (#indicator-overview)
3. (#installation-instructions)
4. (#parameter-settings)
5. (#signal-interpretation)
6. (#trading-strategy)
7. (#risk-management)
8. (#optimization-tips)
9. (#troubleshooting)
---
## 🎯 Quick Start Guide
### What You Get
✅ **2 Complete Pine Script Indicators:**
- `swing_trading_super_indicator.pine` - Universal version for all markets
- `nifty_optimized_super_indicator.pine` - Specifically optimized for Nifty50 & Indian stocks
✅ **Key Features:**
- Multi-component signal confirmation system
- Optimized for daily and 3-hour timeframes
- Built-in risk management with dynamic stops and targets
- Real-time signal strength monitoring
- Gap analysis for Indian market characteristics
### Immediate Setup
1. Copy the Pine Script code from `nifty_optimized_super_indicator.pine`
2. Paste into TradingView Pine Editor
3. Add to chart on daily or 3-hour timeframe
4. Look for 🚀BUY and 🔻SELL signals
5. Use the information table for signal confirmation
---
## 🔍 Indicator Overview
### Core Components Integration
**🎯 Range Filter (35% Weight)**
- Primary trend identification using adaptive volatility filtering
- Optimized sampling period: 21 bars for Indian market volatility
- Enhanced range multiplier: 3.0 to handle market gaps
- Provides trend direction and strength measurement
**⚡ PMAX (30% Weight)**
- Volatility-adjusted trend confirmation using ATR-based calculations
- Dynamic multiplier adjustment based on market volatility
- 14-period ATR with 2.5 multiplier for swing trading sensitivity
- Offers trailing stop functionality
**🏗️ Support/Resistance (20% Weight)**
- Dynamic level identification using pivot point analysis
- Tighter channel width (3%) for precise Indian market levels
- Enhanced strength calculation with historical interaction weighting
- Provides entry/exit timing and breakout signals
**📊 EMA Alignment (15% Weight)**
- Multi-timeframe moving average confirmation
- Key EMAs: 9, 21, 50, 200 (popular in Indian markets)
- Hierarchical alignment scoring for trend strength
- Additional trend validation layer
### Advanced Features
**🌅 Gap Analysis**
- Automatic detection of significant price gaps (>2%)
- Gap strength measurement and impact on signals
- Specific optimization for Indian market overnight gaps
- Visual gap markers on chart
**⏰ Multi-Timeframe Integration**
- Higher timeframe bias from daily/weekly data
- Configurable daily bias weight (default 70%)
- 3-hour confirmation for precise entry timing
- Prevents counter-trend trades against major timeframe
**🛡️ Risk Management**
- Dynamic stop-loss calculation using multiple methods
- Automatic profit target identification
- Position sizing guidance based on signal strength
- Anti-whipsaw logic to prevent false signals
---
## 📥 Installation Instructions
### Step 1: Access TradingView
1. Open TradingView.com
2. Navigate to Pine Editor (bottom panel)
3. Create a new indicator
### Step 2: Copy the Code
**For Nifty50 & Indian Stocks (Recommended):**
```pinescript
// Copy entire content from nifty_optimized_super_indicator.pine
```
**For Universal Use:**
```pinescript
// Copy entire content from swing_trading_super_indicator.pine
```
### Step 3: Configure and Apply
1. Click "Add to Chart"
2. Select daily or 3-hour timeframe
3. Adjust parameters if needed (defaults are optimized)
4. Enable alerts for signal notifications
### Step 4: Verify Installation
- Check that all components are visible
- Confirm information table appears in top-right
- Test with known trending stocks for signal validation
---
## ⚙️ Parameter Settings
### 🎯 Range Filter Settings
```
Sampling Period: 21 (optimized for Indian market volatility)
Range Multiplier: 3.0 (handles overnight gaps effectively)
Source: Close (most reliable for swing trading)
```
### ⚡ PMAX Settings
```
ATR Length: 14 (standard for daily/3H timeframes)
ATR Multiplier: 2.5 (balanced for swing trading sensitivity)
Moving Average Type: EMA (responsive to price changes)
MA Length: 14 (matches ATR period for consistency)
```
### 🏗️ Support/Resistance Settings
```
Pivot Period: 8 (shorter for Indian market dynamics)
Channel Width: 3% (tighter for precise levels)
Minimum Strength: 3 (higher quality levels only)
Maximum Levels: 4 (focus on strongest levels)
Lookback Period: 150 (sufficient historical data)
```
### 🚀 Super Indicator Settings
```
Signal Sensitivity: 0.65 (balanced for swing trading)
Trend Strength Requirement: 0.75 (high quality signals)
Gap Threshold: 2.0% (significant gap detection)
Daily Bias Weight: 0.7 (strong higher timeframe influence)
```
### 🎨 Display Options
```
Show Range Filter: ✅ (trend visualization)
Show PMAX: ✅ (trailing stops)
Show S/R Levels: ✅ (key price levels)
Show Key EMAs: ✅ (trend confirmation)
Show Signals: ✅ (buy/sell alerts)
Show Trend Background: ✅ (visual trend state)
Show Gap Markers: ✅ (gap identification)
```
---
## 📊 Signal Interpretation
### 🚀 BUY Signals
**Requirements for BUY Signal:**
- Price above Range Filter with upward trend
- PMAX showing bullish direction (MA > PMAX line)
- Support/resistance breakout or favorable positioning
- EMA alignment supporting upward movement
- Higher timeframe bias confirmation
- Overall signal strength > 75%
**Signal Strength Indicators:**
- **90-100%:** Extremely strong - Maximum position size
- **80-89%:** Very strong - Large position size
- **75-79%:** Strong - Standard position size
- **65-74%:** Moderate - Reduced position size
- **<65%:** Weak - Wait for better opportunity
### 🔻 SELL Signals
**Requirements for SELL Signal:**
- Price below Range Filter with downward trend
- PMAX showing bearish direction (MA < PMAX line)
- Resistance breakdown or unfavorable positioning
- EMA alignment supporting downward movement
- Higher timeframe bias confirmation
- Overall signal strength > 75%
### ⚖️ NEUTRAL Signals
**Characteristics:**
- Conflicting signals between components
- Low overall signal strength (<65%)
- Range-bound market conditions
- Wait for clearer directional bias
### 📈 Information Table Guide
**Component Status:**
- **BULL/BEAR:** Current signal direction
- **Strength %:** Component contribution strength
- **Status:** Additional context (STRONG/WEAK/ACTIVE/etc.)
**Overall Signal:**
- **🚀 STRONG BUY:** All systems aligned bullish
- **🔻 STRONG SELL:** All systems aligned bearish
- **⚖️ NEUTRAL:** Mixed or weak signals
---
## 💼 Trading Strategy
### Daily Timeframe Strategy
**Setup:**
1. Apply indicator to daily chart of Nifty50 or Indian stocks
2. Wait for 🚀BUY or 🔻SELL signal with >75% strength
3. Confirm higher timeframe bias alignment
4. Check for significant support/resistance levels
**Entry:**
- Enter on signal bar close or next bar open
- Use 3-hour chart for precise entry timing
- Avoid entries during major news events
- Consider gap analysis for overnight positions
**Position Sizing:**
- **>90% Strength:** 3-4% of portfolio
- **80-89% Strength:** 2-3% of portfolio
- **75-79% Strength:** 1-2% of portfolio
- **<75% Strength:** Avoid or minimal size
### 3-Hour Timeframe Strategy
**Setup:**
1. Confirm daily timeframe bias first
2. Apply indicator to 3-hour chart
3. Look for signals aligned with daily trend
4. Use for entry/exit timing optimization
**Entry Refinement:**
- Wait for 3H signal confirmation
- Enter on pullbacks to key levels
- Use tighter stops for better risk/reward
- Monitor intraday support/resistance
### Risk Management Rules
**Stop Loss Placement:**
1. **Primary:** Use indicator's dynamic stop level
2. **Secondary:** Below/above nearest support/resistance
3. **Maximum:** 2-3% of portfolio per trade
4. **Trailing:** Move stops with PMAX line
**Profit Taking:**
1. **Target 1:** First resistance/support level (50% position)
2. **Target 2:** Second resistance/support level (30% position)
3. **Runner:** Trail remaining 20% with PMAX
**Position Management:**
- Review positions at daily close
- Adjust stops based on new signals
- Exit if trend changes to opposite direction
- Reduce size during high volatility periods
---
## 🎯 Optimization Tips
### For Nifty50 Trading
- Use daily timeframe for primary signals
- Monitor sector rotation impact
- Consider index futures for better liquidity
- Watch for RBI policy and global cues impact
### For Individual Stocks
- Verify stock follows Nifty correlation
- Check sector-specific news and events
- Ensure adequate liquidity for position size
- Monitor earnings calendar for volatility
### Market Condition Adaptations
**Trending Markets:**
- Increase position sizes for strong signals
- Use wider stops to avoid whipsaws
- Focus on trend continuation signals
- Reduce counter-trend trading
**Range-Bound Markets:**
- Reduce position sizes
- Use tighter stops and quicker profits
- Focus on support/resistance bounces
- Increase signal strength requirements
**High Volatility Periods:**
- Reduce overall exposure
- Use smaller position sizes
- Increase stop-loss distances
- Wait for clearer signals
### Performance Monitoring
- Track win rate and average profit/loss
- Monitor signal quality over time
- Adjust parameters based on market changes
- Keep trading journal for pattern recognition
---
## 🔧 Troubleshooting
### Common Issues
**Q: Signals appear too frequently**
A: Increase "Trend Strength Requirement" to 0.8-0.9
**Q: Missing obvious trends**
A: Decrease "Signal Sensitivity" to 0.5-0.6
**Q: Too many false signals**
A: Enable "3H Confirmation" and increase strength requirements
**Q: Indicator not loading**
A: Check Pine Script version compatibility (requires v5)
### Parameter Adjustments
**For More Sensitive Signals:**
- Decrease Signal Sensitivity to 0.5-0.6
- Decrease Trend Strength Requirement to 0.6-0.7
- Increase Range Filter multiplier to 3.5-4.0
**For More Conservative Signals:**
- Increase Signal Sensitivity to 0.7-0.8
- Increase Trend Strength Requirement to 0.8-0.9
- Enable all confirmation features
### Performance Issues
- Reduce lookback periods if chart loads slowly
- Disable some visual elements for better performance
- Use on liquid stocks/indices for best results
---
## 📞 Support & Updates
This super indicator combines the best of Range Filter, PMAX, and Support/Resistance analysis specifically optimized for Indian market swing trading. The multi-component approach significantly improves signal quality while the built-in risk management features help protect capital.
**Remember:** No indicator is 100% accurate. Always combine with proper risk management, market analysis, and your trading experience for best results.
**Happy Trading! 🚀**
Supertrend

Mutanabby_AI | Fresh Algo V24Mutanabby_AI | Fresh Algo V24: Advanced Multi-Mode Trading System
Overview
The Mutanabby_AI Fresh Algo V24 represents a sophisticated evolution of multi-component trading systems that adapts to various market conditions through advanced operational configurations and enhanced analytical capabilities. This comprehensive indicator provides traders with multiple signal generation approaches, specialized assistant functions, and dynamic risk management tools designed for professional market analysis across diverse trading environments.
Primary Signal Generation Framework
The Fresh Algo V24 operates through two fundamental signal generation approaches that accommodate different market perspectives and trading philosophies. The Trending Signals Mode serves as the primary trend-following mechanism, combining Wave Trend Oscillator analysis with Supertrend directional signals and Squeeze Momentum breakout detection. This mode incorporates ADX filtering that requires values exceeding 20 to ensure sufficient trend strength exists before signal activation, making it particularly effective during sustained directional market movements where momentum persistence creates profitable trading opportunities.
The Contrarian Signals Mode provides an alternative approach targeting reversal opportunities through extreme market condition identification. This mode activates when the Wave Trend Oscillator reaches critical threshold levels, specifically when readings surpass 65 indicating potential bearish reversal conditions or drop below 35 suggesting bullish reversal opportunities. This methodology proves valuable during overextended market phases where mean reversion becomes statistically probable.
Advanced Filtering Mechanisms
The system incorporates multiple sophisticated filtering mechanisms designed to enhance signal quality and reduce false positive occurrences. The High Volume Filter requires volume expansion confirmation before signal activation, utilizing exponential moving average calculations to ensure institutional participation accompanies price movements. This filter substantially improves signal reliability by eliminating low-conviction breakouts that lack adequate volume support from professional market participants.
The Strong Filter provides additional trend confirmation through 200-period exponential moving average analysis. Long position signals require price action above this benchmark level, while short position signals necessitate price action below it. This ensures strategic alignment with longer-term trend direction and reduces the probability of trading against major market movements that could invalidate shorter-term signals.
Cloud Filter Configuration System
The Fresh Algo V24 offers four distinct cloud filter configurations, each optimized for specific trading timeframes and market approaches. The Smooth Cloud Filter utilizes the mathematical relationship between 150-period and 250-period exponential moving averages, providing stable trend identification suitable for position trading strategies. This configuration generates signals exclusively when price action aligns with cloud direction, creating a more deliberate but highly reliable signal generation process.
The Swing Cloud Filter employs modified Supertrend calculations with parameters specifically optimized for swing trading timeframes. This filter achieves optimal balance between responsiveness and stability, adapting effectively to medium-term price movements while filtering excessive market noise that typically affects shorter-term analytical systems.
For active intraday traders, the Scalping Cloud Filter utilizes accelerated Supertrend calculations designed to capture rapid trend changes effectively. This configuration provides enhanced signal generation frequency suitable for compressed timeframe strategies. The advanced Scalping+ Cloud Filter incorporates Hull Moving Average confirmation, delivering maximum responsiveness for ultra-short-term trading while maintaining signal quality through additional momentum validation processes.
Specialized Assistant Functionality
The system includes two distinct assistant modes that provide supplementary market analysis capabilities. The Trend Assistant Mode activates advanced cloud analysis overlays that display dynamic support and resistance zones calculated through adaptive volatility algorithms. These levels automatically adjust to current market conditions, providing visual guidance for identifying trend continuation patterns and potential reversal areas with mathematical precision.
The Trend Tracker Mode concentrates on long-term trend identification by displaying major exponential moving averages with color-coded fill areas that clarify directional bias. This mode maintains visual simplicity while providing comprehensive trend context evaluation, enabling traders to quickly assess broader market direction and align shorter-term strategies accordingly.
Dynamic Risk Management System
The integrated risk management system automatically adapts across all operational modes, calculating stop loss and take profit targets using Average True Range multiples that adjust to current market volatility. This approach ensures consistent risk parameters regardless of selected operational mode while maintaining relevance to prevailing market conditions.
Stop loss placement occurs at dynamically calculated distances from entry points, while three progressive take profit targets establish at customizable ATR multiples respectively. The system automatically updates these levels upon trend direction changes, ensuring current market volatility influences all risk calculations and maintains appropriate risk-reward ratios throughout trade management.
Comprehensive Market Analysis Dashboard
The sophisticated dashboard provides real-time market analysis including volatility measurements, institutional activity assessment, and multi-timeframe trend evaluation across five-minute through four-hour periods. This comprehensive market context assists traders in selecting appropriate operational modes based on current market characteristics rather than relying exclusively on historical performance data.
The multi-timeframe analysis ensures mode selection considers broader market context beyond the primary trading timeframe, improving overall strategic alignment and reducing conflicts between different temporal market perspectives. The dashboard displays market state classification, volatility percentages, institutional activity levels, current trading session information, and trend pressure indicators with professional formatting and clear visual hierarchy.
Enhanced Trading Assistants
The Fresh Algo V24 includes specialized trading assistant features that complement the primary signal generation system. The Reversal Dot functionality identifies potential reversal points through Wave Trend Oscillator analysis, displaying visual indicators when crossover conditions occur at extreme levels. These reversal indicators provide early warning signals for potential trend changes before they appear in the primary signal system.
The Dynamic Take Profit Labels feature automatically identifies optimal profit-taking opportunities through RSI threshold analysis, marking potential exit points at multiple levels for long positions and corresponding levels for short positions. This automated profit management system helps traders optimize exit timing without requiring constant manual monitoring of technical indicators.
Advanced Alert System
The comprehensive alert system accommodates all operational modes while providing granular notification control for various signal types and risk management events. Traders can configure separate alerts for normal buy signals, strong buy signals, normal sell signals, strong sell signals, stop loss triggers, and individual take profit target achievements.
Cloud crossover alerts notify traders when trend direction changes occur, providing early indication of potential strategy adjustments. The alert system includes detailed trade setup information, timeframe data, and relevant entry and exit levels, ensuring traders receive complete context for informed decision-making without requiring constant chart monitoring.
Technical Foundation Architecture
The Fresh Algo V24 combines multiple proven technical analysis components including Wave Trend Oscillator for momentum assessment, Supertrend for directional bias determination, Squeeze Momentum for volatility analysis, and various exponential moving averages for trend confirmation. Each component contributes specific market insights while the unified system provides comprehensive market evaluation through their mathematical integration.
The multi-component approach reduces dependency on individual indicator limitations while leveraging the analytical strengths of each technical tool. This creates a robust analytical framework capable of adapting to diverse market conditions through appropriate mode selection and parameter optimization, ensuring consistent performance across varying market environments.
Market State Classification
The indicator incorporates advanced market state classification through ADX analysis, distinguishing between trending, ranging, and transitional market conditions. This classification system automatically adjusts signal sensitivity and filtering parameters based on current market characteristics, optimizing performance for prevailing conditions rather than applying static analytical approaches.
The volatility measurement system calculates current market activity levels as percentages, providing quantitative assessment of market energy and helping traders select appropriate operational modes. Institutional activity detection through volume analysis ensures signal generation aligns with professional market participation patterns.
Implementation Strategy Considerations
Successful implementation requires careful matching of operational modes to prevailing market conditions and individual trading objectives. Trending modes demonstrate optimal performance during directional markets with sustained momentum characteristics, while contrarian modes excel during range-bound or overextended market conditions where reversal probability increases.
The cloud filter configurations provide varying degrees of confirmation strength, with smoother settings reducing false signal occurrence at the expense of some responsiveness to price changes. Traders must balance signal quality against signal frequency based on their risk tolerance and available trading time, utilizing the comprehensive customization options to optimize performance for their specific requirements.
Multi-Timeframe Integration
The system provides seamless multi-timeframe analysis through the integrated dashboard, displaying trend alignment across multiple time horizons from five-minute through four-hour periods. This analysis helps traders understand broader market context and avoid conflicts between different temporal perspectives that could compromise trade outcomes.
Session analysis identifies current trading session characteristics, providing context for expected market behavior patterns and helping traders adjust their approach based on typical session volatility and participation levels. This geographic market awareness enhances strategic decision-making and improves timing for trade execution.
Advanced Visualization Features
The indicator includes sophisticated visualization capabilities through gradient candle coloring based on MACD analysis, providing immediate visual feedback on momentum strength and direction. This enhancement allows rapid market assessment without requiring detailed indicator analysis, improving efficiency for traders managing multiple instruments simultaneously.
The cloud visualization system uses color-coded fill areas to clearly indicate trend direction and strength, with automatic adaptation to selected operational modes. This visual clarity reduces analytical complexity while maintaining comprehensive market information display through professional chart presentation.
Performance Optimization Framework
The Fresh Algo V24 incorporates performance optimization features including signal strength classification, automatic parameter adjustment based on market conditions, and dynamic filtering that adapts to current volatility levels. These optimizations ensure consistent performance across varying market environments while maintaining signal quality standards.
The system automatically adjusts sensitivity levels based on selected operational modes, ensuring appropriate responsiveness for different trading approaches. This adaptive framework reduces the need for manual parameter adjustments while maintaining optimal performance characteristics for each operational configuration.
Conclusion
The Mutanabby_AI Fresh Algo V24 represents a comprehensive solution for professional trading analysis, combining multiple analytical approaches with advanced visualization and risk management capabilities. The system's strength lies in its adaptive multi-mode design and sophisticated filtering mechanisms, providing traders with versatile tools for various market conditions and trading styles.
Success with this system requires understanding the relationship between different operational modes and their optimal application scenarios. The comprehensive dashboard and alert system provide essential market context and trade management support, enabling systematic approach to market analysis while maintaining flexibility for individual trading preferences.
The indicator's sophisticated architecture and extensive customization options make it suitable for traders at all experience levels, from those seeking systematic signal generation to advanced practitioners requiring comprehensive market analysis tools. The multi-timeframe integration and adaptive filtering ensure consistent performance across diverse market conditions while providing clear guidelines for strategic implementation.

Mutanabby_AI | Ultimate Algo | Remastered+Overview
The Mutanabby_AI Ultimate Algo Remastered+ represents a sophisticated trend-following system that combines Supertrend analysis with multiple moving average confirmations. This comprehensive indicator is designed specifically for identifying high-probability trend continuation and reversal opportunities across various market conditions.
Core Algorithm Components
**Supertrend Foundation**: The primary signal generation relies on a customizable Supertrend indicator with adjustable sensitivity (1-20 range). This adaptive trend-following tool uses Average True Range calculations to establish dynamic support and resistance levels that respond to market volatility.
**SMA Confirmation Matrix**: Multiple Simple Moving Averages (SMA 4, 5, 9, 13) provide layered confirmation for signal strength. The algorithm distinguishes between regular signals and "Strong" signals based on SMA 4 vs SMA 5 relationship, offering traders different conviction levels for position sizing.
**Trend Ribbon Visualization**: SMA 21 and SMA 34 create a visual trend ribbon that changes color based on their relationship. Green ribbon indicates bullish momentum while red signals bearish conditions, providing immediate visual trend context.
**RSI-Based Candle Coloring**: Advanced 61-tier RSI system colors candles with gradient precision from deep red (RSI ≤20) through purple transitions to bright green (RSI ≥79). This visual enhancement helps traders instantly assess momentum strength and overbought/oversold conditions.
Signal Generation Logic
**Buy Signal Criteria**:
- Price crosses above Supertrend line
- Close price must be above SMA 9 (trend confirmation)
- Signal strength determined by SMA 4 vs SMA 5 relationship
- "Strong Buy" when SMA 4 ≥ SMA 5
- Regular "Buy" when SMA 4 < SMA 5
**Sell Signal Criteria**:
- Price crosses below Supertrend line
- Close price must be below SMA 9 (trend confirmation)
- Signal strength based on SMA relationship
- "Strong Sell" when SMA 4 ≤ SMA 5
- Regular "Sell" when SMA 4 > SMA 5
Advanced Risk Management System
**Automated TP/SL Calculation**: The indicator automatically calculates stop loss and take profit levels using ATR-based measurements. Risk percentage and ATR length are fully customizable, allowing traders to adapt to different market conditions and personal risk tolerance.
**Multiple Take Profit Targets**:
- 1:1 Risk-Reward ratio for conservative profit taking
- 2:1 Risk-Reward for balanced trade management
- 3:1 Risk-Reward for maximum profit potential
**Visual Risk Display**: All risk management levels appear as both labels and optional trend lines on the chart. Customizable line styles (solid, dashed, dotted) and positioning ensure clear visualization without chart clutter.
**Dynamic Level Updates**: Risk levels automatically recalculate with each new signal, maintaining current market relevance throughout position lifecycles.
Visual Enhancement Features
**Customizable Display Options**: Toggle trend ribbon, TP/SL levels, and risk lines independently. Decimal precision adjustments (1-8 decimal places) accommodate different instrument price formats and personal preferences.
**Professional Label System**: Clean, informative labels show entry points, stop losses, and take profit targets with precise price levels. Labels automatically position themselves for optimal chart readability.
**Color-Coded Momentum**: The gradient RSI candle coloring system provides instant visual feedback on momentum strength, helping traders assess market energy and potential reversal zones.
Implementation Strategy
**Timeframe Optimization**: The algorithm performs effectively across multiple timeframes, with higher timeframes (4H, Daily) providing more reliable signals for swing trading. Lower timeframes work well for day trading with appropriate risk adjustments.
**Sensitivity Adjustment**: Lower sensitivity values (1-5) generate fewer but higher-quality signals, ideal for conservative approaches. Higher sensitivity (15-20) increases signal frequency for active trading styles.
**Risk Management Integration**: Use the automated risk calculations as baseline parameters, adjusting risk percentage based on account size and market conditions. The 1:1, 2:1, 3:1 targets enable systematic profit-taking strategies.
Market Application
**Trend Following Excellence**: Primary strength lies in capturing significant trend movements through the Supertrend foundation with SMA confirmation. The dual-layer approach reduces false signals common in single-indicator systems.
**Momentum Assessment**: RSI-based candle coloring provides immediate momentum context, helping traders assess signal strength and potential continuation probability.
**Range Detection**: The trend ribbon helps identify ranging conditions when SMA 21 and SMA 34 converge, alerting traders to potential breakout opportunities.
Performance Optimization
**Signal Quality**: The requirement for both Supertrend crossover AND SMA 9 confirmation significantly improves signal reliability compared to basic trend-following approaches.
**Visual Clarity**: The comprehensive visual system enables rapid market assessment without complex calculations, ideal for traders managing multiple instruments.
**Adaptability**: Extensive customization options allow fine-tuning for specific markets, trading styles, and risk preferences while maintaining the core algorithm integrity.
## Non-Repainting Design
**Educational Note**: This indicator uses standard TradingView functions (Supertrend, SMA, RSI) with normal behavior patterns. Real-time updates on current candles are expected and standard across all technical indicators. Historical signals on closed candles remain fixed and unchanged, ensuring reliable backtesting and analysis.
**Signal Confirmation**: Final signals are confirmed only when candles close, following standard technical analysis principles. The algorithm provides clear distinction between developing signals and confirmed entries.
Technical Specifications
**Supertrend Parameters**: Default sensitivity of 4 with ATR length of 11 provides balanced signal generation. Sensitivity range from 1-20 allows adaptation to different market volatilities and trading preferences.
**Moving Average Configuration**: SMA periods of 8, 9, and 13 create multi-layered trend confirmation, while SMA 21 and 34 form the visual trend ribbon for broader market context.
**Risk Management**: ATR-based calculations with customizable risk percentage ensure dynamic adaptation to market volatility while maintaining consistent risk exposure principles.
Recommended Settings
**Conservative Approach**: Sensitivity 4-5, RSI length 14, higher timeframes (4H, Daily) for swing trading with maximum signal reliability.
**Active Trading**: Sensitivity 6-8, RSI length 8-10, intermediate timeframes (1H) for balanced signal frequency and quality.
**Scalping Setup**: Sensitivity 10-15, RSI length 5-8, lower timeframes (15-30min) with enhanced risk management protocols.
## Conclusion
The Mutanabby_AI Ultimate Algo Remastered+ combines proven trend-following principles with modern visual enhancements and comprehensive risk management. The algorithm's strength lies in its multi-layered confirmation approach and automated risk calculations, providing both novice and experienced traders with clear signals and systematic trade management.
Success with this system requires understanding the relationship between signal strength indicators and adapting sensitivity settings to match current market conditions. The comprehensive visual feedback system enables rapid decision-making while the automated risk management ensures consistent trade parameters.
Practice with different sensitivity settings and timeframes to optimize performance for your specific trading style and risk tolerance. The algorithm's systematic approach provides an excellent framework for disciplined trend-following strategies across various market environments.

Alma SD SuperTrend | OquantAlma SD SuperTrend | Oquant
The "Alma SD SuperTrend | Oquant" is a trend-following indicator that integrates the Arnaud Legoux Moving Average (ALMA) with a SuperTrend calculation based on standard deviation (SD). Designed to quickly identify and follow market trends while reducing noise, this script provides buy and sell signals for traders across various assets and timeframes.
This script offers a unique approach by combining ALMA with a SuperTrend framework that uses standard deviation instead of the traditional Average True Range (ATR). This implementation focuses on fast trend detection with minimized noise, making it suitable for trend-following or swing trading strategies. The script’s customizable parameters allow traders to adapt it to their preferred trading style.
How It Works
Arnaud Legoux Moving Average (ALMA): ALMA is an advanced moving average that applies a Gaussian filter to smooth price data, reducing market noise while preserving responsiveness to price changes. It uses three parameters:
Length: Sets the lookback period for smoothing. Longer periods produce smoother results.
Offset: Shifts the moving average toward recent prices. Higher offsets emphasize newer data for faster trend detection.
Sigma controls the smoothness and lag of the Alma by adjusting the spread of the Gaussian distribution used in the calculation.
Standard Deviation (SD) Calculation: The script calculates the standard deviation of the price over a specified period to measure volatility. SD measures how much the prices deviate from its mean, offering a statistical perspective on market volatility. This is used to create dynamic upper and lower bands around the ALMA line, adjusted by a user-defined factor. The bands expand in volatile markets and contract in stable conditions, helping in trend detection.
SuperTrend Logic: The script generates a SuperTrend line that dynamically tracks market trends by switching between upper and lower volatility bands based on price movement. Here's how it works:
The SuperTrend line is calculated using the ALMA (Arnaud Legoux Moving Average) as a baseline, with upper and lower bands created by adding and subtracting a multiple(Factor) of the standard deviation (SD) from the ALMA.
When the price moves above the upper band, the SuperTrend line shifts to the lower band, indicating a bullish trend (potential buy signal).
When the price falls below the lower band, the SuperTrend line switches to the upper band, signaling a bearish trend (potential sell signal).
To avoid quick, unreliable changes, this script intelligently adjusts the SuperTrend bands for stability. While the SuperTrend line dynamically follows market movements, it's designed to hold at its previous level if the price doesn't cross a band or confirm a new trend direction. This approach ensures the SuperTrend quickly identifies and follows genuine market trends, providing clear signals while effectively reducing false alerts from short-term price swings.
Differences from Traditional SuperTrend:
Baseline: The traditional SuperTrend typically uses a hl2((high + low)/2)as its baseline, while this script employs ALMA for a smoother, noise-filtered trend foundation.
Volatility Measure: Instead of ATR, this script uses standard deviation to calculate the bands. Standard deviation measures how much the prices vary or spread out from its mean.
Visualization: The script plots the SuperTrend line, colors candles to match the trend, and fills the area between the price and the SuperTrend line for visual clarity, helping traders quickly identify trend direction and strength (green for bullish, purple for bearish).
How to Use It
Add to Chart: Apply the indicator to any market and timeframe.
Interpret Signals:
Green Line and Candles: Bullish trend (price above the SuperTrend line). Consider long entries.
Purple Line and Candles: Bearish trend (price below the SuperTrend line). Consider short entries.
Filled Area: The shaded area between price and the SuperTrend line highlights trend direction(green for bullish, purple for bearish).
Adjust Inputs:
Source: Select the price data to use (e.g., close, open, high, low).
Factor: Adjusts band width. Higher values widen bands, reducing sensitivity.
SD Length: Period for calculating standard deviation. Longer periods smooth volatility.
ALMA Length: Period for ALMA. Longer periods increase smoothness.
Alma Offset: Shift the moving average toward recent or older prices. Higher offsets emphasize newer data for faster trend detection.
ALMA Sigma control the smoothness and lag of the Alma by adjusting the spread of the Gaussian distribution used in the calculation.
Alerts
This indicator includes optional built-in alert conditions that notify you when the signal crosses above 0 (long signal, price above upper band) or below 0 (short signal, price below lower band). Enable these alerts to get timely updates on potential trend shifts without constantly monitoring the chart.
⚠️ Disclaimer: This indicator is intended for educational and informational purposes only. Trading/investing involves risk, and past performance does not guarantee future results. Always test and evaluate indicators/strategies before applying them in live markets. Use at your own risk.

Momentum Trail Oscillator [AlgoAlpha]🟠 OVERVIEW
This script builds a Momentum Trail Oscillator designed to measure directional momentum strength and dynamically track shifts in trend bias using a combination of smoothed price change calculations and adaptive trailing bands. The oscillator aims to help traders visualize when momentum is expanding or contracting and to identify transitions between bullish and bearish conditions.
🟠 CONCEPTS
The core idea combines two methods. First, the script calculates a normalized momentum measure by smoothing price changes relative to their absolute values, which creates a bounded oscillator that highlights whether moves are directional or choppy. Second, it uses a trailing band mechanism inspired by volatility stops, where bands adapt to the oscillator’s volatility, adjusting the thresholds that define a shift in directional bias. This dual approach seeks to address both the magnitude and persistence of momentum, reducing false signals in ranging markets.
🟠 FEATURES
The momentum calculation applies Hull Moving Averages and double EMA smoothing to price changes, producing a smooth, responsive oscillator.
The trailing bands are derived by offsetting a weighted moving average of the oscillator by a multiple of recent momentum volatility. A directional state variable tracks whether the oscillator is above or below the bands, updating when the momentum crosses these dynamic thresholds.
Overbought and oversold zones are visually marked between fixed levels (+30/+40 and -30/-40), with color fills to highlight when momentum is in extreme areas. The script plots signals on both the oscillator pane and optionally overlays markers on the main price chart for clarity.
🟠 USAGE
To use the indicator, apply it to any symbol and timeframe. The “Oscillator Length” controls how sensitive the momentum line is to recent price changes—lower values react faster, higher values smooth out noise. The “Trail Multiplier” sets how far the adaptive bands sit from the oscillator mid-line, which affects how often trend state changes occur. When the momentum line rises into the upper filled area and then crosses back below +40, it signals potential overbought exhaustion. The opposite applies for the oversold zone below -40. The plotted trailing bands switch visibility depending on the current directional state: when momentum is trending up, the lower band acts as the active trailing stop, and when trending down, the upper band becomes active. Trend changes are marked with circular symbols when the direction variable flips, and optional overlay arrows appear on the price chart to highlight overbought or oversold reversals. Traders can combine these signals with their own price action or volume analysis to confirm entries or exits.

Heatmap Trailing Stop with Breakouts (Zeiierman)█ Overview
Heatmap Trailing Stop with Breakouts (Zeiierman) is a trend and breakout detection tool that combines dynamic trailing stop logic, Fibonacci-based levels, and a real-time market heatmap into a single, intuitive system.
This indicator is designed to help traders visualize pressure zones, manage stop placement, and identify breakout opportunities supported by contextual price–derived heat. Whether you're trailing trends, detecting reversals, or entering on explosive breakouts — this tool keeps you anchored in structure and sentiment.
It projects adaptive trailing stop levels and calculates Fibonacci extensions from swing-based extremes. These levels are then colored by a market heatmap engine that tracks price interaction intensity — showing where the market is "hot" and likely to respond.
On top of that, it includes breakout signals powered by HTF momentum conditions, trend direction, and heatmap validation — giving you signals only when the context is strong.
█ How It Works
⚪ Trailing Stop Engine
At its core, the script uses an ATR-based trailing stop with trend detection:
ATR Length – Defines volatility smoothing using EMA MA of true range.
Multiplier – Expands/retracts the trailing offset depending on market aggression.
Real-Time Extremum Tracking – Uses local highs/lows to define Fibonacci anchors.
⚪ Fibonacci Projection + Heatmap
With each trend shift, Fibonacci levels are projected from the new swing to the current trailing stop. These include:
Fib 61.8, 78.6, 88.6, and 100% (trailing stop) lines
Heatmap Coloring – Each level'slevel's color is determined by how frequently price has interacted with that level in the recent range (defined by ATR).
Strength Score (1–10) – The number of touches per level is normalized and averaged to create a heatmap ""score"" displayed as a colored bar on the chart.
⚪ Breakout Signal System
This engine detects high-confidence breakout signals using a higher timeframe candle structure:
Bullish Breakout – Strong bullish candle + momentum + trend confirmation + heatmap score threshold.
Bearish Breakout – Strong bearish candle + momentum + trend confirmation + heatmap score threshold.
Cooldown Logic – Prevents signals from clustering too frequently during volatile periods.
█ How to Use
⚪ Trend Following & Trail Stops
Use the Trailing Stop line to manage positions or time entries in line with trend direction. Trailing stop flips are highlighted with dot markers.
⚪ Fibonacci Heat Zones
The projected Fibonacci levels serve as price magnets or support/resistance zones. Watch how price reacts at Fib 61.8/78.6/88.6 levels — especially when they're glowing with high heatmap scores (more glow = more historical touches = stronger significance).
⚪ Breakout Signals
Enable breakout signals when you want to trade breakouts only under strong context. Use the "Heatmap Strength Threshold" to require a minimum score (1–10).
█ Settings
Stop Distance ATR Length – ATR period for volatility smoothing
Stop Distance Multiplier – Adjusts the trailing stop'sstop's distance from price
Heatmap Range ATR Length – Defines how far back the heatmap scans for touches
Number of Heat Levels – Total levels used in the heatmap (more = finer resolution)
Minimum Touches per Level – Defines what counts as a ""hot"" level
Heatmap Strength Threshold – Minimum average heat score (1–10) required for breakouts
Timeframe – HTF source used to evaluate breakout momentum structure
-----------------
Disclaimer
The content provided in my scripts, indicators, ideas, algorithms, and systems is for educational and informational purposes only. It does not constitute financial advice, investment recommendations, or a solicitation to buy or sell any financial instruments. I will not accept liability for any loss or damage, including without limitation any loss of profit, which may arise directly or indirectly from the use of or reliance on such information.
All investments involve risk, and the past performance of a security, industry, sector, market, financial product, trading strategy, backtest, or individual's trading does not guarantee future results or returns. Investors are fully responsible for any investment decisions they make. Such decisions should be based solely on an evaluation of their financial circumstances, investment objectives, risk tolerance, and liquidity needs.

CoffeeShopCrypto Supertrend Liquidity EngineMost SuperTrend indicators use fixed ATR multipliers that ignore context—forcing traders to constantly tweak settings that rarely adapt well across timeframes or assets.
This Supertrend is a nodd to and a more completion of the work
done by Olivier Seban ( @olivierseban )
This version replaces guesswork with an adaptive factor based on prior session volatility, dynamically adjusting stops to match current conditions. It also introduces liquidity-aware zones, real-time strength histograms, and a visual control panel—making your stoploss smarter, more responsive, and aligned with how the market actually moves.
📏 The Multiplier Problem & Adaptive Factor Solution
Traditional SuperTrend indicators rely on fixed ATR multipliers—often arbitrary numbers like 1.5, 2, or 3. The issue? No logical basis ties these values to actual market conditions. What works on a 5-minute Nasdaq chart fails on a daily EUR/USD chart. Traders spend hours tweaking multipliers per asset, timeframe, or volatility phase—and still end up with stoplosses that are either too tight or too loose. Worse, the market doesn’t care about your setting—it behaves according to underlying volatility, not your parameter.
This version fixes that by automating the multiplier selection entirely. It uses a 4-zone model based on the current ATR relative to the previous session’s ATR, dynamically adjusting the SuperTrend factor to match current volatility. It eliminates guesswork, adapts to the asset and timeframe, and ensures you’re always using a context-aware stoploss—one that evolves with the market instead of fighting it.
ATR EXAMPLE
Let’s say prior session ATR = 2.00
Now suppose current ATR = 0.32
This places us in Zone 1 (Very Low Volatility)
It doesn’t imply "overbought" or "oversold" — it tells you the market is moving very little, which often means:
Lower risk | Smaller stops | Smaller opportunities (and losses)
🔁 Liquidity Zones vs. Arbitrary Pullbacks
The standard SuperTrend stop loss line often looks like price “barely misses it” before continuing its trend. Traders call this "stop hunting," but what’s really happening is liquidity collection—price pulls back into a zone rich in orders before continuing. The problem? The old SuperTrend doesn’t show this zone. It only draws the outer limit, leaving no visual cue for where entries or continuation moves might realistically originate.
This script introduces 2 levels in the Liquidity Zone. One for Support and one for Stophunts, which draw dynamically between the current price and the SuperTrend line. These levels reflect where the market is most likely to revisit before resuming the trend. By visualizing the area just above the Supertrend stop loss, you can anticipate pullbacks, spot ideal re-entries, and avoid premature exits. This bridges the gap between mechanical stoploss logic and real-world liquidity behavior.
⏳ Prior Session ATR vs. Live ATR
Using real-time ATR to determine movement potential is like driving by looking in your rearview mirror. It’s reactive, not predictive. Traders often base decisions on live ATR, unaware that today’s range is still unfolding —creating volatility mismatches between what’s calculated and what actually matters. Since ATR reflects range, calculating it mid-session gives an incomplete and misleading picture of true volatility.
Instead, this system uses the ATR from the previous session , anchoring your volatility assumptions in a fully-formed price structure . It tells you how far price moved in the last full market phase—be it London, New York, or Tokyo—giving you a more reliable gauge of expected range today. This is a smarter way to estimate how far price could move rather than how far it has moved.
The Smoothing function will take the ATR, Support, Resistance, Stophunt Levels, and the Moving Avearage and smooth them by the calculation you choose.
It will also plot a moving average on your chart against closing prices by the smoothing function you choose.
🧭 Scalping vs. Trending Modes
The market moves in at least 4 phases. Trending, Ranging, Consolidation, Distribution.
Every trader has a different style —some scalp low-volatility moves during off-hours, while others ride macro trends across days. The problem with classic SuperTrend? It treats every market condition the same. A fixed system can’t possibly provide proper stoploss spacing for both a fast scalp and a long-term swing. Traders are forced to rebuild their system every time the market changes character or the session shifts.
This version solves that with a simple toggle:
Scalping or Trend Mode . With one switch, it inverts the logic of the adaptive factor to either tighten or loosen your trailing stops. During low-liquidity hours or consolidation phases, Scalping Mode offers snug stoplosses. During expansion or clear directional bias.
Trend Mode lets the trade breathe. This is flexibility built directly into the logic—not something you have to recalibrate manually.
📉 Histogram Oscillator for Move Strength
In legacy indicators, there’s no built-in way to gauge when the move is losing power . Traders rely on price action or momentum indicators to guess if a trend is fading. But this adds clutter, lag, and often contradiction. The classic SuperTrend doesn’t offer insight into how strong or weak the current trend leg is—only whether price has crossed a line.
This version includes a Trending Liquidity Histogram —a histogram that shows whether the liquidity in the SuperTrend zone is expanding or compressing. When the bars weaken or cross toward zero, it signals liquidity exhaustion . This early warning gives you time to prep for reversals or anticipate pullbacks. It even adapts visually depending on your trading mode, showing color-coded signals for scalping vs. trending behavior. It's both a strength gauge and a trade timing tool—built into your stoploss logic.
Histogram in Scalping Mode
Histogram in Trending Mode
📊 Visual Table for Real-Time Clarity
A major issue with custom indicators is opacity —you don’t always know what settings or values are currently being used. Even worse, if your dynamic logic changes mid-trade, you may not notice unless you go digging into the code or logs. This can create confusion, especially for discretionary traders.
This SuperTrend solves it with a clean visual summary table right on your chart. It shows your current ATR value, adaptive multiplier, trailing stop level, and whether a new zone size is active. That means no surprises and no second-guessing—everything important is visible and updated in real-time.

TitanGrid L/S SuperEngineTitanGrid L/S SuperEngine
Experimental Trend-Aligned Grid Signal Engine for Long & Short Execution
🔹 Overview
TitanGrid is an advanced, real-time signal engine built around a tactical grid structure.
It manages Long and Short trades using trend-aligned entries, layered scaling, and partial exits.
Unlike traditional strategy() -based scripts, TitanGrid runs as an indicator() , but includes its own full internal simulation engine.
This allows it to track capital, equity, PnL, risk exposure, and trade performance bar-by-bar — effectively simulating a custom backtest, while remaining compatible with real-time alert-based execution systems.
The concept was born from the fusion of two prior systems:
Assassin’s Grid (grid-based execution and structure) + Super 8 (trend-filtering, smart capital logic), both developed under the AssassinsGrid framework.
🔹 Disclaimer
This is an experimental tool intended for research, testing, and educational use.
It does not provide guaranteed outcomes and should not be interpreted as financial advice.
Use with demo or simulated accounts before considering live deployment.
🔹 Execution Logic
Trend direction is filtered through a custom SuperTrend engine. Once confirmed:
• Long entries trigger on pullbacks, exiting progressively as price moves up
• Short entries trigger on rallies, exiting as price declines
Grid levels are spaced by configurable percentage width, and entries scale dynamically.
🔹 Stop Loss Mechanism
TitanGrid uses a dual-layer stop system:
• A static stop per entry, placed at a fixed percentage distance matching the grid width
• A trend reversal exit that closes the entire position if price crosses the SuperTrend in the opposite direction
Stops are triggered once per cycle, ensuring predictable and capital-aware behavior.
🔹 Key Features
• Dual-side grid logic (Long-only, Short-only, or Both)
• SuperTrend filtering to enforce directional bias
• Adjustable grid spacing, scaling, and sizing
• Static and dynamic stop-loss logic
• Partial exits and reset conditions
• Webhook-ready alerts (browser-based automation compatible)
• Internal simulation of equity, PnL, fees, and liquidation levels
• Real-time dashboard for full transparency
🔹 Best Use Cases
TitanGrid performs best in structured or mean-reverting environments.
It is especially well-suited to assets with the behavioral profile of ETH — reactive, trend-intraday, and prone to clean pullback formations.
While adaptable to multiple timeframes, it shows strongest performance on the 15-minute chart , offering a balance of signal frequency and directional clarity.
🔹 License
Published under the Mozilla Public License 2.0 .
You are free to study, adapt, and extend this script.
🔹 Panel Reference
The real-time dashboard displays performance metrics, capital state, and position behavior:
• Asset Type – Automatically detects the instrument class (e.g., Crypto, Stock, Forex) from symbol metadata
• Equity – Total simulated capital: realized PnL + floating PnL + remaining cash
• Available Cash – Capital not currently allocated to any position
• Used Margin – Capital locked in open trades, based on position size and leverage
• Net Profit – Realized gain/loss after commissions and fees
• Raw Net Profit – Gross result before trading costs
• Floating PnL – Unrealized profit or loss from active positions
• ROI – Return on initial capital, including realized and floating PnL. Leverage directly impacts this metric, amplifying both gains and losses relative to account size.
• Long/Short Size & Avg Price – Open position sizes and volume-weighted average entry prices
• Leverage & Liquidation – Simulated effective leverage and projected liquidation level
• Hold – Best-performing hold side (Long or Short) over the session
• Hold Efficiency – Performance efficiency during holding phases, relative to capital used
• Profit Factor – Ratio of gross profits to gross losses (realized)
• Payoff Ratio – Average profit per win / average loss per loss
• Win Rate – Percent of profitable closes (including partial exits)
• Expectancy – Net average result per closed trade
• Max Drawdown – Largest recorded drop in equity during the session
• Commission Paid – Simulated trading costs: maker, taker, funding
• Long / Short Trades – Count of entry signals per side
• Time Trading – Number of bars spent in active positions
• Volume / Month – Extrapolated 30-day trading volume estimate
• Min Capital – Lowest equity level recorded during the session
🔹 Reference Ranges by Strategy Type
Use the following metrics as reference depending on the trading style:
Grid / Mean Reversion
• Profit Factor: 1.2 – 2.0
• Payoff Ratio: 0.5 – 1.2
• Win Rate: 50% – 70% (based on partial exits)
• Expectancy: 0.05% – 0.25%
• Drawdown: Moderate to high
• Commission Impact: High
Trend-Following
• Profit Factor: 1.5 – 3.0
• Payoff Ratio: 1.5 – 3.5
• Win Rate: 30% – 50%
• Expectancy: 0.3% – 1.0%
• Drawdown: Low to moderate
Scalping / High-Frequency
• Profit Factor: 1.1 – 1.6
• Payoff Ratio: 0.3 – 0.8
• Win Rate: 80% – 95%
• Expectancy: 0.01% – 0.05%
• Volume / Month: Very high
Breakout Strategies
• Profit Factor: 1.4 – 2.2
• Payoff Ratio: 1.2 – 2.0
• Win Rate: 35% – 60%
• Expectancy: 0.2% – 0.6%
• Drawdown: Can be sharp after failed breakouts
🔹 Note on Performance Simulation
TitanGrid includes internal accounting of fees, slippage, and funding costs.
While its logic is designed for precision and capital efficiency, performance is naturally affected by exchange commissions.
In frictionless environments (e.g., zero-fee simulation), its high-frequency logic could — in theory — extract substantial micro-edges from the market.
However, real-world conditions introduce limits, and all results should be interpreted accordingly.

SuperTrend Confluence Signals [AlgoAlpha]OVERVIEW
This script enhances the classic SuperTrend indicator by integrating volume dynamics, retracement detection, and a multi-asset trend matrix—alongside an automatic mitigation-level drawing system. It's designed for traders who want to see not just trend direction, but the confluence of trend strength, volatility-adjusted retracements, and capital flow through volume pressure. It visually maps key transitions in market structure while offering a clean, color-coded overview of multiple symbols and timeframes in a single chart.
CONCEPTS
At the core is the traditional SuperTrend , which determines directional bias using Average True Range (ATR) with a volatility multiplier. This script overlays that with a dynamic volume histogram that scales relative to recent volume standard deviation, coloring volume bursts within the trend. Retracement signals are triggered when price pulls back toward the SuperTrend level but respects it—quantified through normalized distance sensitivity. On top of that, the indicator automatically draws and manages horizontal support/resistance zones that appear at key trend shifts. These levels persist and are cleared based on configurable rules such as wick/body sweeps or consecutive candle closes. A multi-asset, multi-timeframe table then gives an instant snapshot of trend status across five user-defined symbols and timeframes.
FEATURES
SuperTrend : Configurable ATR length and multiplier for flexible trend sensitivity.
Volumetric Histogram : Gradient-filled candles anchored to SuperTrend bands, scaled by relative volume to indicate activity intensity during trends.
Retracement Arrows : Signals printed when price nears the SuperTrend level without breaking it, allowing identification of high-probability continuation zones.
Volume TP Markers : Diamond markers flag high-volume events, contextualizing price moves with liquidity bursts.
Automatic Structure Levels : Draws clean horizontal lines at significant trend transitions, with optional volatility-based band fills. These levels self-update and clear based on price interaction logic.
Trend Table : Displays trend direction (▲/▼) across five assets and five timeframes. Each cell is colored according to trend bias, providing a compact overview for multi-market confluence.
USAGE
Start by loading the indicator on your main chart and adjusting the ATR Length and Multiplier to match your strategy timeframe. Use lower values for scalping and higher values for swing trading. The histogram bars will appear as colored candles above or below the SuperTrend level, indicating how strong volume is within that trend. Arrow signals suggest minor pullbacks within the trend, which can act as entry opportunities. The level system will automatically plot key price zones during trend flips; if "Body" is selected for mitigation, price must close through the level to invalidate it. If "Wick" is chosen, a single wick breach is enough. Adjust expiry and rejection settings to fine-tune how long levels stay on chart. Finally, enable the Multi-Asset Table to view live trend signals across popular symbols like AAPL or NVDA in different timeframes, helping spot macro-to-micro alignment for higher-confidence trades.

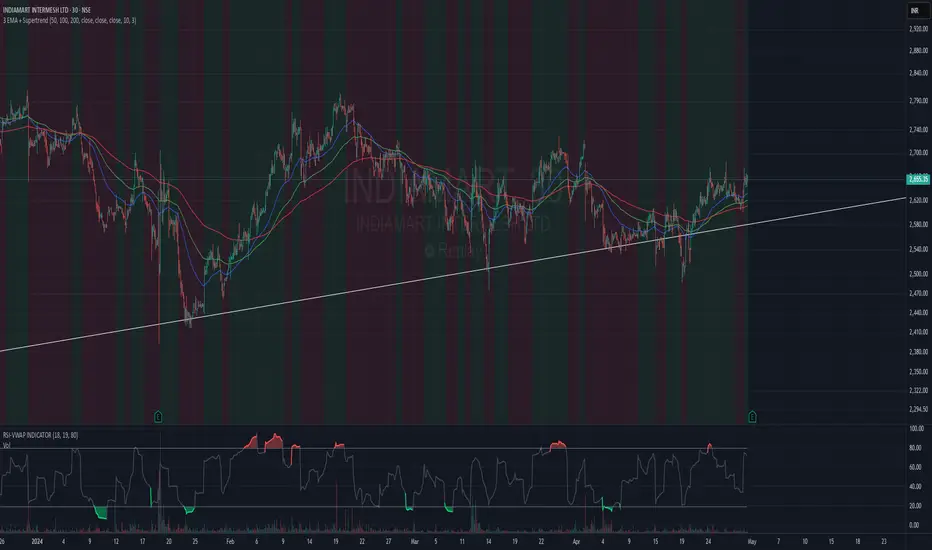
3 EMA + SupertrendThree EMAs: Helps you identify the general trend direction and potential crossovers.
When the Fast EMA crosses above the Medium or Slow EMAs, it may indicate a bullish trend, and vice versa for bearish trends.
Supertrend: Works as a trend filter. You can use it to identify overall market conditions:
When the Supertrend is green, it indicates an uptrend.
When the Supertrend is red, it indicates a downtrend.
Combination: The EMAs help you confirm the trend, and the Supertrend can act as a filter or confirmation tool for your entries and exits.
Potential Strategy Idea:
Long Entry: When the Fast EMA crosses above the Medium EMA, and the Supertrend is green.
Short Entry: When the Fast EMA crosses below the Medium EMA, and the Supertrend is red.
Exit: You can use either the Supertrend turning from green to red (for long exits) or vice versa.
SuperTrend: Silent Shadow 🕶️ SuperTrend: Silent Shadow — Operate in trend. Vanish in noise.
Overview
SuperTrend: Silent Shadow is an enhanced trend-following system designed for traders who demand clarity in volatile markets and silence during indecision.
It combines classic Supertrend logic with a proprietary ShadowTrail engine and an adaptive Silence Protocol to filter noise and highlight only the cleanest signals.
Key Features
✅ Core Supertrend Logic
Built on Average True Range (ATR), this trend engine identifies directional bias with visual clarity. Lines adjust dynamically with price action and flip when meaningful reversals occur.
✅ ShadowTrail: Stepped Counter-Barrier
ShadowTrail doesn’t predict reversals — it reinforces structure.
When price is trending, ShadowTrail forms a stepped ceiling in downtrends and a stepped floor in uptrends. This visual containment zone helps define the edges of price behavior and offers a clear visual anchor for stop-loss placement and trade containment.
✅ Silence Protocol: Adaptive Noise Filtering
During low-volatility zones, the system enters “stealth mode”:
• Trend lines turn white to indicate reduced signal quality
• Fill disappears to reduce distraction
This helps avoid choppy entries and keeps your focus sharp when the market isn’t.
✅ Visual Support & Stop-Loss Utility
When trendlines flatten or pause, they naturally highlight price memory zones. These flat sections often align with:
• Logical stop-loss levels
• Prior support/resistance areas
• Zones of reduced volatility where price recharges or rejects
✅ Custom Styling
Full control over line colors, width, transparency, fill visibility, and silence behavior. Tailor it to your strategy and visual preferences.
How to Use
• Use Supertrend color to determine bias — flips mark momentum shifts
• ShadowTrail mirrors the primary trend as a structural ceiling/floor
• Use flat segments of both lines to identify consolidation zones or place stops
• White lines = low-quality signal → stand by
• Combine with RSI, volume, divergence, or your favorite tools for confirmation
Recommended For:
• Traders seeking clearer trend signals
• Avoiding false entries in sideways or silent markets
• Identifying key support/resistance visually
• Structuring stops around real market containment levels
• Scalping, swing, or position trading with adaptive clarity
Built by Sherlock Macgyver
Forged for precision. Designed for silence.
When the market speaks, you listen.
When it doesn’t — you wait in the shadows.

The Ultimate Buy and Sell Indicator: Unholy Grail Edition"You see, Watson, the market is not random—it simply whispers in a code too complex for the average trader. Lucky for you, I am not average."
They searched for the Holy Grail of trading for decades—promises, false prophets, and overpriced PDFs.
But they were all looking in the wrong place.
This isn’t a relic buried in the desert.
This is the Unholy Grail — a machine-forged fusion of logic, engineering, and tactical overkill .
Built by Sherlock Macgyver , this is not a mystical object. It’s a surveillance system for trend detection, signal validation, and precision entries .
⚠️ Important: This script draws its own candles.
To see it properly, disable regular candles by turning off "Body", "Wick" and "Border" colors.
🔧 What You’re Looking At
This overlay plots confirmed Buy/Sell signals , momentum-based “watch” zones , adaptive candle coloring , SuperTrend bias detection , dual Bollinger Bands , and a moving average ribbon .
It’s not “minimalist” —it’s comprehensive .
📍 Configuring the Tool: Follow the Breadcrumbs
Every setting includes a tooltip — read them . They're not filler. They explain exactly how each feature functions so you can dial this thing in like you're tuning a surveillance rig in a Cold War bunker .
If you skip them, you're walking blind in a minefield .
🕰️ Timeframes: The Signal Sweet Spot
Each asset has a tempo . You need to find the one where signals align with clarity —not chaos .
Start with 4H or 1H —work up or down from there.
Too many fakeouts? → Higher timeframe
Too slow? → Drop to 15m or 5m —but expect more noise and adjust settings accordingly.
The signals scale with time, but you must find the rhythm that best fits your asset—and your trading lifestyle .
♻️ RSI Cycle = Signal Sensitivity
This is the heart of the system . It controls how reactive the RSI engine is.
Adjust based on noise level and how often you can actually monitor your charts.
Short cycle (14–24): More signals, more speed, more noise
Longer cycle (36–64): Smoother entries, better for swing traders
Tip: If your signals feel too jittery, increase the cycle. If they lag too much, reduce it.
📉 SuperTrend: Your Trend Bias Compass
This isn’t your average SuperTrend. It adapts with RSI overlay logic and detects market “silence” via EMA compression— turning white right before the chaos . That said, you still control its aggression.
ATR Length = how many bars to average
ATR Factor = how tight or loose it hugs price
Lower = more sensitive (more trades, more noise)
Higher = confirmation only (fewer, but stronger signals)
Tweak until it feels like a sniper rifle.
No, you won’t get it perfect on the first try.
Yes, it’s worth it.
🛠️ Modular Signals: Why Things Fire (or Don’t)
Buy/Sell entries require conditions to align. The logic is modular, and that’s on purpose.
RSI signals only fire if RSI crosses its smoothed MA outside the dead zone and a “Watch” condition is active.
SuperTrend signals can be enabled to act on crossovers, optionally ignoring the Watch filter .
Watch conditions (colored squares) act as early recon and hint at possible upcoming trades.
Background color changes are “pre-signal warnings” and will repaint . Use them as leading signals, not gospel.
Want more trades? Loosen your filters .
Want sniper entries? Lock them down .
🌈 Candles and MAs: Visual Market Structure
Candles adapt in real-time to MA structure:
Green = bullish (above both fast/slow MAs)
Yellow = indecision (between)
Red = bearish (below both)
Buy/Sell signals override candles with bright orange and fuchsia —because subtlety doesn’t win wars .
You can also enable up to 8 customizable moving averages —great for confluence , trend confirmation , or just looking like a wizard .
🧠 Pro Usage Tips (TL;DR for Smart People):
Use tooltips in the settings menu —every toggle and slider is explained
Test timeframes until signal frequency and reliability match your goals
Adjust RSI cycle to reduce noise or speed up signals based on how frequently you trade
Tweak SuperTrend factor and ATR to fit volatility on your asset
Start with visual confirmation :
• Are watch signals lining up with trend zones?
• Are backgrounds firing before price moves?
• Are candle colors agreeing with signal direction?
📣 Alerts & Integration
Alerts are available for:
Buy/Sell entries (confirmed or advanced background)
Watch signals
Full band agreement (both Bollinger bands bullish or bearish)
Use these with webhook systems , bots , or your own trade journals .
Created by Sherlock Macgyver
Because sometimes the best trade…
is knowing exactly when not to take one.

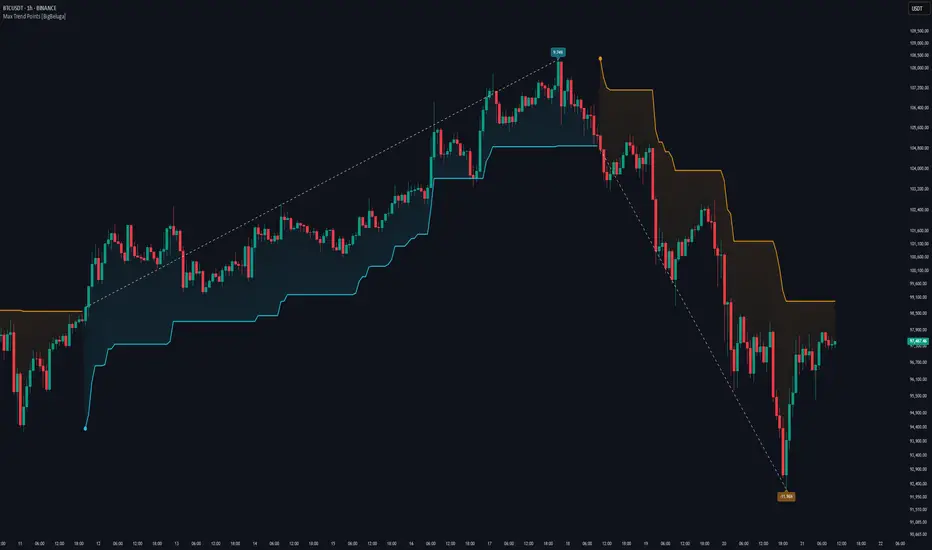
Max Trend Points [BigBeluga]🔵 OVERVIEW
A clean and powerful tool for identifying major trend shifts and quantifying the strength of each move using dynamically calculated price extremes.
This indicator helps traders visualize the most significant trend changes by plotting trend direction lines and dynamically tracking the highest or lowest point within each trend leg. It’s ideal for identifying key price impulses and measuring their magnitude in real time.
🔵 CONCEPTS
Uses an adaptive trend-following logic based on volatility envelopes created from HMA of the price range (high - low).
Identifies trend direction and flips when price breaks above or below these dynamic envelopes.
Tracks swing highs and lows within the current trend leg to highlight trend extremes.
Calculates and displays the percentage gain or drop from trend start to trend peak/valley.
🔵 FEATURES
Trend Shift Detection:
Plots a colored trend line (uptrend or downtrend) that updates based on price action volatility.
Impulse Mapping:
Draws a dashed line between the point of trend change (close) and the current trend leg's extreme (highest high or lowest low).
Percentage Labeling:
Displays a floating label showing the exact percent change from the trend start to the current extreme.
Real-Time Adjustments:
As the trend progresses, the extreme point and the percent label update automatically to reflect new highs/lows.
🔵 HOW TO USE
Look for the trend color shift and circular marker to identify a new potential trend direction.
Use the dashed lines and percent label to evaluate the strength and potential maturity of each move.
Combine this tool with support/resistance levels or other indicators to identify confluence zones.
Adjust the "Factor" input to make the trend detection more or less sensitive depending on your timeframe.
🔵 CONCLUSION
Max Trend Points is an efficient visual indicator for understanding the structure and magnitude of trending moves. It provides essential feedback on how far a trend has traveled, where momentum may be peaking, and when a shift may be underway—all with real-time adaptability and clean presentation.
ADX Supertrend | [DeV]The "ADX Supertrend" indicator is a user-friendly tool that blends two popular trading indicators—the Supertrend and the Average Directional Index (ADX)—to help traders spot trends and make smarter trading decisions. By combining these two, it offers a clearer picture of when a market is trending strongly and in which direction, while cutting down on misleading signals. Here’s a straightforward explanation of how each part works, how they team up, the benefits of using them together, and why the ADX makes the Supertrend even better.
Supertrend:
It's like a guide that follows the market’s price movements to tell you whether prices are trending up or down. It creates two lines, one above and one below the price, based on how much the market is bouncing around (its volatility). When the price moves above the upper line, it signals an uptrend (a good time to buy), and the indicator draws a line below the price to show support. When the price drops below the lower line, it signals a downtrend (a potential time to sell), and the line appears above the price as resistance. The Supertrend is great because it adjusts to market conditions, widening the gap between lines in wild markets and tightening it in calm ones.
Average Directional Index:
The ADX is all about measuring how strong a trend is, without caring whether it’s going up or down. Think of it as a meter that tells you if the market is charging forward with purpose or just drifting aimlessly. It uses a scale from 0 to 100, where higher numbers mean a stronger trend. For example, an ADX above 25 often suggests a solid trend worth paying attention to, while a low ADX signals a sleepy, sideways market. The ADX also looks at whether buyers or sellers are in control to confirm the trend’s direction.
Confluence:
The Supertrend is great at spotting trends, but it can be a bit trigger-happy, giving signals in markets that aren’t really trending. That’s where the ADX shines. It acts like a quality control check, making sure the Supertrend’s signals only count when the market is moving with conviction. By filtering out weak or messy trends, the ADX helps you avoid wasting time on trades that fizzle out. It also double-checks the trend’s direction, so you’re not just guessing whether buyers or sellers are in charge. This teamwork means you get signals that are more reliable and less likely to lead you astray, especially in tricky markets where prices bounce around without a clear path.
Trend Targets [AlgoAlpha]OVERVIEW
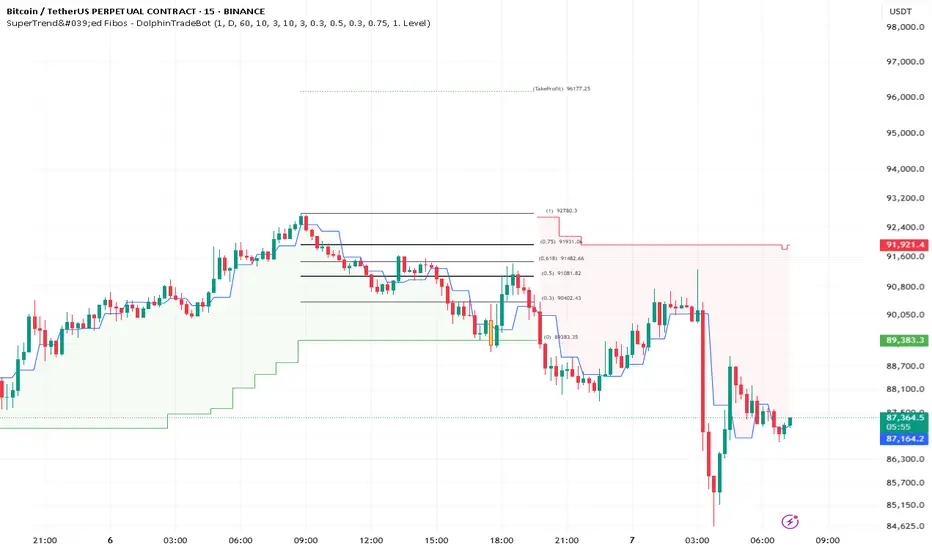
This script combines a smoothed trend-following model with dynamic price rejection logic and ATR-based target projection to give traders a complete visual framework for trading trend continuations. It overlays on price and automatically detects potential trend shifts, confirms rejections near dynamic support/resistance, and displays calculated stop-loss and take-profit levels to support structured risk-reward management. Unlike traditional indicators that only show trend direction or signal entries, this tool brings together a unique mix of signal validation, volatility-aware positioning, and layered profit-taking to guide decision-making with more context.
CONCEPTS
The core trend logic is built on a custom Supertrend that uses an ATR-based band structure with long smoothing chains—first through a WMA, then an EMA—allowing the trend line to respond to major shifts while ignoring noise. A key addition is the use of rejection logic: the script looks for consolidation candles that "hug" the smoothed trend line and counts how many consecutive bars reject from it. This behavior often precedes significant moves. A user-defined threshold filters out weak tests and highlights only meaningful rejections.
FEATURES
Trend Detection : Automatically identifies trend direction using a smoothed Supertrend (WMA + EMA), with shape markers on trend shifts and color-coded bars for clarity.
Rejection Signals : Detects price rejections at the trend line after a user-defined number of consolidation bars; plots ▲/▼ icons to highlight strong continuation setups.
Target Projection : On trend confirmation, plots entry, stop-loss (ATR-based), and three dynamic take-profit levels based on customizable multiples.
Dynamic Updates : All levels (entry, SL, TP1–TP3) auto-adjust based on volatility and are labeled in real time on the chart.
Customization : Users can tweak trend parameters, rejection confirmation count, SL/TP ratios, smoothing lengths, and appearance settings.
Alerts : Built-in alerts for trend changes, rejection events, and when TP1, TP2, or TP3 are reached.
Chart Overlay : Plots directly on price chart with minimal clutter and clearly labeled levels for easy trading.
USAGE
Start by tuning the Supertrend factor and ATR period to fit your asset and timeframe—higher values will catch bigger swings, lower values catch faster moves. The confirmation count should match how tightly you want to filter rejection behavior—higher values make signals rarer but stronger. When the trend shifts, the indicator colors the bars and line accordingly, and if enabled, plots the full entry-TP-SL structure. Rejection markers appear only after enough qualifying bars confirm price pressure at the trend line. This is especially useful for continuation plays where price retests the trend but fails to break it. All calculations are based on volatility (ATR), so targets naturally adjust with market conditions. Add alerts to get notified of important signals even when away from the chart.

Volatility Layered Supertrend [NLR]We’ve all used Supertrend, but do you know where to actually enter a trade? Volatility Layered Supertrend (VLS) is here to solve that! This advanced trend-following indicator builds on the classic Supertrend by not only identifying trends and their strength but also guiding you to the best trade entry points. VLS divides the main long-term trend into “Strong” and “Weak” Zones, with a clear “Trade Entry Zone” to help you time your trades with precision. With layered trends, dynamic profit targets, and volatility-adaptive bands, VLS delivers actionable signals for any market.
Why I Created VLS Over a Plain Supertrend
I built VLS to address the gaps in traditional Supertrend usage and make trade entries clearer:
Single-Line Supertrend Issues: The default Supertrend sets stop-loss levels that are too wide, making it impractical for most traders to use effectively.
Unclear Entry Points: Standard Supertrend doesn’t tell you where to enter a trade, often leaving you guessing or entering too early or late.
Multi-Line Supertrend Enhancement: Many traders use short, medium, and long Supertrends, which is helpful but can lack focus. In VLS, I include Short, Medium, and Long trends (using multipliers 1 to 3), and add multipliers 4 and 5 to track extra long-term trends—helping to avoid fakeouts that sometimes occur with multiplier 3.
My Solution: I focused on the main long-term Supertrend and split it into “Weak Zone” and “Strength Zone” to show the trend’s reliability. I also defined a “Trade Entry Zone” (starting from the Mid Point, with the first layer’s background hidden for clarity) to guide you on where to enter trades. The zones include Short, Medium, and Long Trend layers for precise entries, exits, and stop-losses.
Practical Trading: This approach provides realistic stop-loss levels, clear entry points, and a “Profit Target” line that aligns with your risk tolerance, while filtering out false signals with longer-term trends.
Key Features
Layered Trend Zones: Short, Medium, Long, and Extra Long Trend layers (up to multipliers 4 and 5) for timing entries and exits.
Strong & Weak Zones: See when the trend is reliable (Strength Zone) or needs caution (Weak Zone).
Trade Entry Zone: A dedicated zone starting from the Mid Point (first layer’s background hidden) to show the best entry points.
Dynamic Profit Targets: A “Profit Target” line that adjusts with the trend for clear goals.
Volatility-Adaptive: Uses ATR to adapt to market conditions, ensuring reliable signals.
Color-Coded: Green for uptrends, red for downtrends—simple and clear.
How It Works
VLS enhances the main long-term Supertrend by dividing it into two zones:
Weak Zone: Indicates a less reliable trend—use tighter stop-losses or wait for the price to reach the Trade Entry Zone.
Strength Zone: Signals a strong trend—ideal for entries with wider stop-losses for bigger moves.
The “Trade Entry Zone” starts at the Mid Point (last layer’s background hidden for clarity), showing you the best area to enter trades. Each zone includes Short, Medium, Long, and Extra Long Trend sublevels (up to multipliers 4 and 5) for precise trade timing and to filter out fakeouts. The “Profit Target” updates dynamically based on trend direction and volatility, giving you a clear goal.
How to Use
Spot the Trend: Green bands = buy, red bands = sell.
Check Strength: Price in Strength Zone? Trend’s reliable—trade confidently. In Weak Zone? Use tighter stops or wait.
Enter Trades: Use the “Trade Entry Zone” (from the Mid Point upward) for the best entry points.
Use Sublevels: Short, Medium, Long, and Extra Long layers in each zone help fine-tune entries and exits.
Set Targets: Follow the Profit Target line for goals—it updates automatically.
Combine Tools: Pair with RSI, MACD, or support/resistance for added confirmation.
Settings
ATR Length: Adjust the ATR period (default 10) to change sensitivity.
Up/Down Colors: Customize colors—green for up, red for down, by default.

IDX - 5UPThe UDX-5UP is a custom indicator designed to assist traders in identifying trends, entry and exit signals, and market reversal moments with greater accuracy. It combines price analysis, volume, and momentum (RSI) to provide clear buy ("Buy") and sell ("Sell") signals across any asset and timeframe, whether you're a scalper on the 5M chart or a swing trader on the 4H chart. Inspired by robust technical analysis strategies, the UDX-5UP is ideal for traders seeking a reliable tool to operate in volatile markets such as cryptocurrencies, forex, stocks, and futures.
Components of the UDX-5UP
The UDX-5UP consists of three main panels that work together to provide a comprehensive view of the market:
Main Panel (Price):
Pivot Supertrend: A dynamic line that changes color to indicate the trend. Green for an uptrend (look for buys), red for a downtrend (look for sells).
SMAs (Simple Moving Averages): Two SMAs (8 and 21 periods) to confirm the trend direction. When the SMA 8 crosses above the SMA 21, it’s a bullish signal; when it crosses below, it’s a bearish signal.
Entry/Exit Signals: "Buy" (green) and "Sell" (red) labels are plotted on the chart when entry or exit conditions are met.
Volume Panel:
Colored Volume Bars: Green bars indicate dominant buying volume, while red bars indicate dominant selling volume.
Volume Moving Average (MA 20): A blue line that helps identify whether the current volume is above or below the average, confirming the strength of the movement.
RSI Panel:
RSI (Relative Strength Index): Calculated with a period of 14, with overbought (70) and oversold (30) lines to identify momentum extremes.
Divergences: The indicator detects divergences between the RSI and price, plotting signals for potential reversals.
How the UDX-5UP Works
The UDX-5UP uses a combination of rules to generate buy and sell signals:
Buy Signal ("Buy"):
The Pivot Supertrend changes from red to green.
The SMA 8 crosses above the SMA 21.
The volume is above the MA 20, with green bars (indicating buying pressure).
The RSI is rising and, ideally, below 70 (not overbought).
Example: On the 4H chart, the price of Tether (USDT) is at 0.05515. The Pivot Supertrend turns green, the SMA 8 crosses above the SMA 21, the volume shows green bars above the MA 20, and the RSI is at 46. The UDX-5UP plots a "Buy".
Sell Signal ("Sell"):
The Pivot Supertrend changes from green to red.
The SMA 8 crosses below the SMA 21.
The volume is above the MA 20, with red bars (indicating selling pressure).
The RSI is falling and, ideally, above 70 (overbought).
Example: On the 4H chart, the price of Tether rises to 0.05817. The Pivot Supertrend turns red, the SMA 8 crosses below the SMA 21, the volume shows red bars, and the RSI is above 70. The UDX-5UP plots a "Sell".
RSI Divergences:
The indicator identifies bullish divergences (price makes a lower low, but RSI makes a higher low) and bearish divergences (price makes a higher high, but RSI makes a lower high), plotting alerts for potential reversals.
Adjustable Settings
The UDX-5UP is highly customizable to suit your trading style:
Pivot Supertrend Period: Default is 2. Increase to 3 or 4 for more conservative signals (fewer false positives, but more lag).
SMA Periods: Default is 8 and 21. Adjust to 5 and 13 for smaller timeframes (e.g., 5M) or 13 and 34 for larger timeframes (e.g., 1D).
RSI Period: Default is 14. Reduce to 10 for greater sensitivity or increase to 20 for smoother signals.
Overbought/Oversold Levels: Default is 70/30. Adjust to 80/20 in volatile markets.
Display Panels: You can enable/disable the volume and RSI panels to simplify the chart.
How to Use the UDX-5UP
Identify the Trend:
Use the Pivot Supertrend and SMAs to determine the market direction. Uptrend: look for buys. Downtrend: look for sells.
Confirm with Volume and RSI:
For buys: Volume above the MA 20 with green bars, RSI rising and below 70.
For sells: Volume above the MA 20 with red bars, RSI falling and above 70.
Enter the Trade:
Enter a buy when the UDX-5UP plots a "Buy" and all conditions are aligned.
Enter a sell when the UDX-5UP plots a "Sell" and all conditions are aligned.
Plan the Exit:
Use Fibonacci levels or support/resistance on the price chart to set targets.
Exit the trade when the UDX-5UP plots an opposite signal ("Sell" after a buy, "Buy" after a sell).
Tips for Beginners
Start with Larger Timeframes: Use the 4H or 1D chart for more reliable signals and less noise.
Combine with Other Indicators: Use the UDX-5UP with tools like Fibonacci or the Candles RSI (another powerful indicator) to confirm signals.
Practice in Demo Mode: Test the indicator in a demo account before using real money.
Manage Risk: Always use a stop-loss and don’t risk more than 1-2% of your capital per trade.
Why Use the UDX-5UP?
Simplicity: Clear "Buy" and "Sell" signals make trading accessible even for beginners.
Versatility: Works on any asset (crypto, forex, stocks) and timeframe.
Multiple Confirmations: Combines price, volume, and momentum to reduce false signals.
Customizable: Adjust the settings to match your trading style.
Author’s Notes
The UDX-5UP was developed based on years of trading and technical analysis experience. It is an evolution of tested strategies, designed to help traders navigate volatile markets with confidence. However, no indicator is infallible. Always combine the UDX-5UP with proper risk management and fundamental analysis, especially in unpredictable markets. Feedback is welcome – leave a comment or reach out with suggestions for improvements!

SuperTrend MTF Pro [Cometreon]The SuperTrend MTF Pro takes the classic SuperTrend to a whole new level of customization and accuracy. Unlike the standard version, this indicator allows you to select different moving averages, apply it to various chart types, and fine-tune every key parameter.
If you're looking for an advanced, non-repainting, and highly configurable SuperTrend, this is the right choice for you.
🔷 New Features and Improvements
🟩 Multi-MA SuperTrend
Now you can customize the SuperTrend calculation by choosing from 15 different moving averages:
SMA (Simple Moving Average)
EMA (Exponential Moving Average)
WMA (Weighted Moving Average)
RMA (Smoothed Moving Average)
HMA (Hull Moving Average)
JMA (Jurik Moving Average)
DEMA (Double Exponential Moving Average)
TEMA (Triple Exponential Moving Average)
LSMA (Least Squares Moving Average)
VWMA (Volume-Weighted Moving Average)
SMMA (Smoothed Moving Average)
KAMA (Kaufman’s Adaptive Moving Average)
ALMA (Arnaud Legoux Moving Average)
FRAMA (Fractal Adaptive Moving Average)
VIDYA (Variable Index Dynamic Average)
🟩 Multiple Chart Types
You're no longer limited to candlestick charts! Now you can use SuperTrend with different chart formats, including:
Heikin Ashi
Renko
Kagi
Line Break
Point & Figure
🟩 Customizable Timeframe
Now you can adjust the SuperTrend timeframe without repainting issues, avoiding signal distortions.
🔷 Technical Details and Customizable Inputs
SuperTrend offers multiple customization options to fit any trading strategy:
1️⃣ ATR Period – Defines the ATR length, affecting the indicator’s sensitivity.
2️⃣ Source – Selects the price value used for calculations (Close, HL2, Open, etc.).
3️⃣ ATR Mult – Multiplies the ATR to determine band distance. Higher values reduce false signals, lower values make it more reactive.
4️⃣ Change ATR Calculation Method – When enabled, uses the default ATR method; when disabled, allows selecting another Moving Average with "Use Different Type".
5️⃣ Source Break – Defines the price source for trend changes (Close for more stability, High/Low for more reactivity).
6️⃣ Use Different Type – Allows selecting an alternative Moving Average for ATR calculation if "Change ATR Calculation Method" is disabled.
7️⃣ SuperTrend Type – Advanced options for specific MAs (JMA, ALMA, FRAMA, VIDYA), with dedicated parameters like Phase, Sigma, and Offset for optimized responsiveness.
8️⃣ Ticker Settings – Customize parameters for special chart types such as Renko, Heikin Ashi, Kagi, Line Break, and Point & Figure, adjusting reversal, number of lines, and ATR length.
9️⃣ Timeframe – Enables using SuperTrend on a higher timeframe.
🔟 Wait for Timeframe Closes -
✅ Enabled – Prevents multiple signals, useful for precise alerts.
❌ Disabled – Displays SuperTrend smoothly without interruptions.
🔷 How to Use SuperTrend MTF Pro
🔍 Identifying Trends
SuperTrend follows the ongoing trend and provides clear visual signals:
When the price is above the line, the trend is bullish.
When the price is below the line, the trend is bearish.
📈 Interpreting Signals
Line color and position change → Possible trend reversal
Bounce off the line → Potential trend continuation
Strong breakout of the line → Possible reversal
🛠 Integration with Other Tools
RSI or MACD to filter false signals
Moving Averages to confirm trend direction
Support and Resistance to improve entry points
☄️ If you find this indicator useful, leave a Boost to support its development!
Every feedback helps to continuously improve the tool, offering an even more effective trading experience. Share your thoughts in the comments! 🚀🔥

Multi-Fibonacci Trend Average[FibonacciFlux]Multi-Fibonacci Trend Average (MFTA): An Institutional-Grade Trend Confluence Indicator for Discerning Market Participants
My original indicator/Strategy:
Engineered for the sophisticated demands of institutional and advanced traders, the Multi-Fibonacci Trend Average (MFTA) indicator represents a paradigm shift in technical analysis. This meticulously crafted tool is designed to furnish high-definition trend signals within the complexities of modern financial markets. Anchored in the rigorous principles of Fibonacci ratios and augmented by advanced averaging methodologies, MFTA delivers a granular perspective on trend dynamics. Its integration of Multi-Timeframe (MTF) filters provides unparalleled signal robustness, empowering strategic decision-making with a heightened degree of confidence.
MFTA indicator on BTCUSDT 15min chart with 1min RSI and MACD filters enabled. Note the refined signal generation with reduced noise.
MFTA indicator on BTCUSDT 15min chart without MTF filters. While capturing more potential trading opportunities, it also generates a higher frequency of signals, including potential false positives.
Core Innovation: Proprietary Fibonacci-Enhanced Supertrend Averaging Engine
The MFTA indicator’s core innovation lies in its proprietary implementation of Supertrend analysis, strategically fortified by Fibonacci ratios to construct a truly dynamic volatility envelope. Departing from conventional Supertrend methodologies, MFTA autonomously computes not one, but three distinct Supertrend lines. Each of these lines is uniquely parameterized by a specific Fibonacci factor: 0.618 (Weak), 1.618 (Medium/Golden Ratio), and 2.618 (Strong/Extended Fibonacci).
// Fibonacci-based factors for multiple Supertrend calculations
factor1 = input.float(0.618, 'Factor 1 (Weak/Fibonacci)', minval=0.01, step=0.01, tooltip='Factor 1 (Weak/Fibonacci)', group="Fibonacci Supertrend")
factor2 = input.float(1.618, 'Factor 2 (Medium/Golden Ratio)', minval=0.01, step=0.01, tooltip='Factor 2 (Medium/Golden Ratio)', group="Fibonacci Supertrend")
factor3 = input.float(2.618, 'Factor 3 (Strong/Extended Fib)', minval=0.01, step=0.01, tooltip='Factor 3 (Strong/Extended Fib)', group="Fibonacci Supertrend")
This multi-faceted architecture adeptly captures a spectrum of market volatility sensitivities, ensuring a comprehensive assessment of prevailing conditions. Subsequently, the indicator algorithmically synthesizes these disparate Supertrend lines through arithmetic averaging. To achieve optimal signal fidelity and mitigate inherent market noise, this composite average is further refined utilizing an Exponential Moving Average (EMA).
// Calculate average of the three supertends and a smoothed version
superlength = input.int(21, 'Smoothing Length', tooltip='Smoothing Length for Average Supertrend', group="Fibonacci Supertrend")
average_trend = (supertrend1 + supertrend2 + supertrend3) / 3
smoothed_trend = ta.ema(average_trend, superlength)
The resultant ‘Smoothed Trend’ line emerges as a remarkably responsive yet stable trend demarcation, offering demonstrably superior clarity and precision compared to singular Supertrend implementations, particularly within the turbulent dynamics of high-volatility markets.
Elevated Signal Confluence: Integrated Multi-Timeframe (MTF) Validation Suite
MFTA transcends the limitations of conventional trend indicators by incorporating an advanced suite of three independent MTF filters: RSI, MACD, and Volume. These filters function as sophisticated validation protocols, rigorously ensuring that only signals exhibiting a confluence of high-probability factors are brought to the forefront.
1. Granular Lower Timeframe RSI Momentum Filter
The Relative Strength Index (RSI) filter, computed from a user-defined lower timeframe, furnishes critical momentum-based signal validation. By meticulously monitoring RSI dynamics on an accelerated timeframe, traders gain the capacity to evaluate underlying momentum strength with precision, prior to committing to signal execution on the primary chart timeframe.
// --- Lower Timeframe RSI Filter ---
ltf_rsi_filter_enable = input.bool(false, title="Enable RSI Filter", group="MTF Filters", tooltip="Use RSI from lower timeframe as a filter")
ltf_rsi_timeframe = input.timeframe("1", title="RSI Timeframe", group="MTF Filters", tooltip="Timeframe for RSI calculation")
ltf_rsi_length = input.int(14, title="RSI Length", minval=1, group="MTF Filters", tooltip="Length for RSI calculation")
ltf_rsi_threshold = input.int(30, title="RSI Threshold", minval=0, maxval=100, group="MTF Filters", tooltip="RSI value threshold for filtering signals")
2. Convergent Lower Timeframe MACD Trend-Momentum Filter
The Moving Average Convergence Divergence (MACD) filter, also calculated on a lower timeframe basis, introduces a critical layer of trend-momentum convergence confirmation. The bullish signal configuration rigorously mandates that the MACD line be definitively positioned above the Signal line on the designated lower timeframe. This stringent condition ensures a robust indication of converging momentum that aligns synergistically with the prevailing trend identified on the primary timeframe.
// --- Lower Timeframe MACD Filter ---
ltf_macd_filter_enable = input.bool(false, title="Enable MACD Filter", group="MTF Filters", tooltip="Use MACD from lower timeframe as a filter")
ltf_macd_timeframe = input.timeframe("1", title="MACD Timeframe", group="MTF Filters", tooltip="Timeframe for MACD calculation")
ltf_macd_fast_length = input.int(12, title="MACD Fast Length", minval=1, group="MTF Filters", tooltip="Fast EMA length for MACD")
ltf_macd_slow_length = input.int(26, title="MACD Slow Length", minval=1, group="MTF Filters", tooltip="Slow EMA length for MACD")
ltf_macd_signal_length = input.int(9, title="MACD Signal Length", minval=1, group="MTF Filters", tooltip="Signal SMA length for MACD")
3. Definitive Volume Confirmation Filter
The Volume Filter functions as an indispensable arbiter of trade conviction. By establishing a dynamic volume threshold, defined as a percentage relative to the average volume over a user-specified lookback period, traders can effectively ensure that all generated signals are rigorously validated by demonstrably increased trading activity. This pivotal validation step signifies robust market participation, substantially diminishing the potential for spurious or false breakout signals.
// --- Volume Filter ---
volume_filter_enable = input.bool(false, title="Enable Volume Filter", group="MTF Filters", tooltip="Use volume level as a filter")
volume_threshold_percent = input.int(title="Volume Threshold (%)", defval=150, minval=100, group="MTF Filters", tooltip="Minimum volume percentage compared to average volume to allow signal (100% = average)")
These meticulously engineered filters operate in synergistic confluence, requiring all enabled filters to definitively satisfy their pre-defined conditions before a Buy or Sell signal is generated. This stringent multi-layered validation process drastically minimizes the incidence of false positive signals, thereby significantly enhancing entry precision and overall signal reliability.
Intuitive Visual Architecture & Actionable Intelligence
MFTA provides a demonstrably intuitive and visually rich charting environment, meticulously delineating trend direction and momentum through precisely color-coded plots:
Average Supertrend: Thin line, green/red for uptrend/downtrend, immediate directional bias.
Smoothed Supertrend: Bold line, teal/purple for uptrend/downtrend, cleaner, institutionally robust trend.
Dynamic Trend Fill: Green/red fill between Supertrends quantifies trend strength and momentum.
Adaptive Background Coloring: Light green/red background mirrors Smoothed Supertrend direction, holistic trend perspective.
Precision Buy/Sell Signals: ‘BUY’/‘SELL’ labels appear on chart when trend touch and MTF filter confluence are satisfied, facilitating high-conviction trade action.
MFTA indicator applied to BTCUSDT 4-hour chart, showcasing its effectiveness on higher timeframes. The Smoothed Length parameter is increased to 200 for enhanced smoothness on this timeframe, coupled with 1min RSI and Volume filters for signal refinement. This illustrates the indicator's adaptability across different timeframes and market conditions.
Strategic Applications for Institutional Mandates
MFTA’s sophisticated design provides distinct advantages for advanced trading operations and institutional investment mandates. Key strategic applications include:
High-Probability Trend Identification: Fibonacci-averaged Supertrend with MTF filters robustly identifies high-probability trend continuations and reversals, enhancing alpha generation.
Precision Entry/Exit Signals: Volume and momentum-filtered signals enable institutional-grade precision for optimized risk-adjusted returns.
Algorithmic Trading Integration: Clear signal logic facilitates seamless integration into automated trading systems for scalable strategy deployment.
Multi-Asset/Timeframe Versatility: Adaptable parameters ensure applicability across diverse asset classes and timeframes, catering to varied trading mandates.
Enhanced Risk Management: Superior signal fidelity from MTF filters inherently reduces false signals, supporting robust risk management protocols.
Granular Customization and Parameterized Control
MFTA offers unparalleled customization, empowering users to fine-tune parameters for precise alignment with specific trading styles and market conditions. Key adjustable parameters include:
Fibonacci Factors: Adjust Supertrend sensitivity to volatility regimes.
ATR Length: Control volatility responsiveness in Supertrend calculations.
Smoothing Length: Refine Smoothed Trend line responsiveness and noise reduction.
MTF Filter Parameters: Independently configure timeframes, lookback periods, and thresholds for RSI, MACD, and Volume filters for optimal signal filtering.
Disclaimer
MFTA is meticulously engineered for high-quality trend signals; however, no indicator guarantees profit. Market conditions are unpredictable, and trading involves substantial risk. Rigorous backtesting and forward testing across diverse datasets, alongside a comprehensive understanding of the indicator's logic, are essential before live deployment. Past performance is not indicative of future results. MFTA is for informational and analytical purposes only and is not financial or investment advice.

Highest High Line with Multi-Timeframe Supertrend and RSIOverview:
This powerful indicator combines three essential elements for traders:
Highest High Line – Tracks the highest price over a customizable lookback period across different timeframes.
Multi-Timeframe Supertrend – Displays Supertrend values and trend directions for multiple timeframes simultaneously.
Relative Strength Index (RSI) – Shows RSI values across different timeframes for momentum analysis.
Features:
✅ Customizable Highest High Line:
Selectable timeframes: Daily, Weekly, Monthly, Quarterly, Yearly
Adjustable lookback period
✅ Multi-Timeframe Supertrend:
Supports 1min, 5min, 10min, 15min, 30min, 1H, Daily, Weekly, Monthly, Quarterly, Yearly
ATR-based calculation with configurable ATR period and multiplier
Identifies bullish (green) & bearish (red) trends
✅ Multi-Timeframe RSI:
Calculates RSI for the same timeframes as Supertrend
Overbought (≥70) and Oversold (≤30) signals with color coding
✅ Comprehensive Table Display:
A clean, structured table in the bottom-right corner
Displays Supertrend direction, value, and RSI for all timeframes
Helps traders quickly assess trend and momentum alignment
How to Use:
Use the Highest High Line to identify key resistance zones.
Confirm trend direction with Multi-Timeframe Supertrend.
Check RSI values to avoid overbought/oversold conditions before entering trades.
Align multiple timeframes for stronger confirmation of trend shifts.
Ideal For:
✅ Scalpers (lower timeframes: 1m–30m)
✅ Swing Traders (higher timeframes: 1H–D)
✅ Position Traders (Weekly, Monthly, Quarterly)
💡 Tip: Look for Supertrend & RSI confluence across multiple timeframes for higher probability setups.

SuperTrend Bar Counter - DolphinTradeBot
OVERVIEW
This indicator calculates the lengths of upward and downward trends based on the specified SuperTrend settings and timeframe. It then takes the average length of the entered number of swings and compares the current trend durations with these averages. The main goal is to anticipate potential reversals in advance.
HOW IS IT WORK ?
The indicator actually contains two different but conceptually similar metrics.
The first part; shows how long the Supertrend stays in an upward or downward trend in real time. Additionally, it analyzes how close the current value is to the average of the Supertrend bar count for the given input.
The second part; aims to provide a different perspective on general trend analysis. It calculates the average duration of upward and downward trends in bars based on the SuperTrend indicator settings within a specified period and timeframe. If, contrary to expectations, downward trends last longer than upward trends, the background is colored green, indicating a prediction that the trend will continue upward.
Explanation of the second part logic: As you know, moving averages or similar approaches that follow the price are often correct when looking back retrospectively, but they cannot serve as leading indicators in real-time trading.That's why, when performing trend analysis, I wanted to introduce a completely different perspective based on price movement, yet still grounded in price action itself.
This phenomenon is partly due to the nature of the SuperTrend itself. After strong price movements, SuperTrend tends to reverse direction much more quickly during pullbacks. Following a strong upward move, a downward trend is detected much earlier and tends to last longer. The indicator provides an alternative perspective by analyzing which directional movement occurs more rapidly and uses this insight for trend prediction.
HOW TO USE ?
It can be used to identify potential price reversals or to assess whether the price is generally cheap or expensive.
In the settings section, you can adjust the SuperTrend parameters and timeframes for the values displayed in the table.
In the second part, you can configure the values used for general trend analysis.
NOTE
Things to be aware of: As the chart's timeframe decreases, pulling data from higher timeframes becomes more difficult. For example, when the chart is set to a 5-minute timeframe, it may fail to retrieve swing periods from the daily timeframe. Similarly, on a 4-hour chart, when calculating the average swing, there might be enough data for only 5 periods instead of 20.
Please keep in mind that this indicator was created solely to provide an idea. It should only be considered as a perspective or a supporting tool that influences your decision by no more than 5% at most.
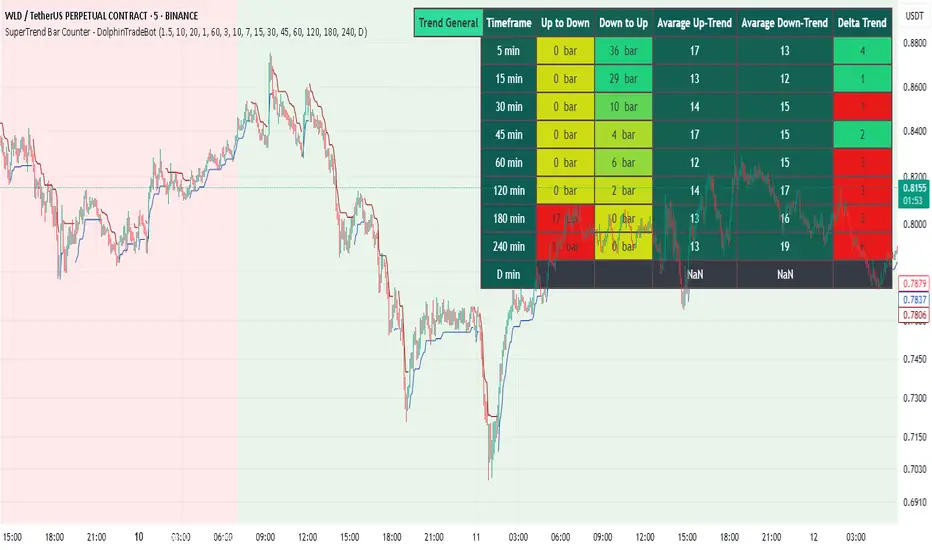
Supertrend with RSI FilterThis indicator is an enhanced version of the classic Supertrend, incorporating an RSI (Relative Strength Index) filter to refine trend signals. Here is a detailed explanation of its functionality and key advantages over the traditional Supertrend.
1. Indicator Functionality
The indicator uses ATR (Average True Range) to calculate the Supertrend line, just like the classic version. However, it introduces an additional condition based on RSI to strengthen or weaken the Supertrend color based on market momentum.
2. Interpretation of Colors
The indicator displays the Supertrend line with dynamic colors based on trend direction and RSI strength:
- Uptrend (Supertrend in buy mode):
- Dark green (Teal): RSI above the defined threshold (default 50) → Strong bullish confirmation.
- Light gray: RSI below the threshold → Indicates a weaker uptrend or lack of confirmation.
- Downtrend (Supertrend in sell mode):
- Dark red: RSI below the threshold → Strong bearish confirmation.
- Light gray: RSI above the threshold → Indicates a weaker downtrend or lack of confirmation.
The opacity of the color dynamically adjusts based on how far RSI is from its threshold. The greater the difference, the more vivid the color, signaling a stronger trend.
3. Key Advantages Over the Classic Supertrend
- Filters out false signals: The RSI integration helps reduce false signals by only validating trends when RSI aligns with the Supertrend direction.
- Weakens uncertain signals: When RSI is close to its threshold, the color becomes more transparent, alerting traders to a less reliable trend.
- Classic mode available: The 'Use Classic Supertrend' option allows switching to a standard Supertrend display (fixed red/green) without the RSI effect.
4. Customizable Parameters
- ATR Length & ATR Factor: Define the sensitivity of the Supertrend.
- RSI Period & RSI Threshold: Allow refining the RSI filter based on market volatility.
- Classic mode: Enables/disables the RSI filtering to revert to the original Supertrend.
This indicator is especially valuable for traders looking to refine their trend signals based on market momentum measured by RSI.
This indicator is for informational purposes only and should not be considered financial advice. Trading involves risks, and past performance does not guarantee future results. Always conduct your own analysis before making any trading decisions.

SuperTrend'ed Fibos - DolphinTradeBot
Overwiev
This indicator aims to assist in taking trades at relatively low price levels in the direction of the main trend and capturing profits at potential reversal points.
What is it for !
The indicator simply performs its calculations by using two multitimeframe SuperTrend indicators, Fibonacci levels, and pivot points. The reason for using MTF in both SuperTrend indicators is that the lengths of the levels are relatively limited, so it allows for a more detailed analysis on lower timeframes.
How is it work
When both the HTF SuperTrend and the main SuperTrend indicators are in the same direction,
For Uptrend:
Once the main SuperTrend line is violated it barcolor and draws the basic Fibonacci levels between the pivot high point and the SuperTrend line within the trend region . The TakeProfit level is drawn at a distance multiplied by the TakeProfit Multiplier, between the lowest and highest points of the level. When the main trend reverses or the TakeProfit level is violated, it stops drawing.
For Downtrend:
Once the main SuperTrend line is violated it barcolor and draws the basic Fibonacci levels between the pivot low point and the SuperTrend line within the trend region . The TakeProfit level is drawn at a distance multiplied by the TakeProfit Multiplier, between the lowest and highest points of the level. When the main trend reverses or the TakeProfit level is violated, it stops drawing.
How to Use:
To prevent the line thickness from being displayed on the screen, the indicator shows the direction of the HTF SuperTrend indicator by coloring the background. In the settings section, you can adjust:
TakeProfit Multiplier
Fibonacci line colors
HTF SuperTrend activation
HTF SuperTrend settings
Main SuperTrend settings
Fibonacci levels
Custom alert activation
Custom alert level
Alarm Section
By default, the indicator gives an alert when a level is formed or violated. Additionally, if you want to set an alert for a specific level, you can activate the Custom Alert option and choose your desired level.