Market Profile based Support/ResistanceBrought to you by Stock Kaka - Your trading sidekick 🦜📈 - pay your visit at stockkaka.my.canva.site or find us on X #StockKaka
📊 What This Indicator Does
Ever wish the market would just tell you where the important levels are? Well, buckle up, because this indicator is like having a market whisperer on your chart!
Based on cutting-edge hierarchical market structure analysis (fancy words for "smart support and resistance"), this bad boy uses ATR-based Directional Change to identify turning points that actually matter. No more guessing where price might bounce or break—let the algorithm do the heavy lifting while you sip your coffee ☕
🎯 The Five Levels Explained (From Noisy to Mighty)
Think of these levels like a pyramid of importance. Level 0 is your chatty friend who notices everything, while Level 4 is the wise oracle who only speaks when it really matters.
Level 0: The Hyperactive Scout 🐿️
What it does: Catches every little zigzag in price using ATR confirmation
Significance: Very short-term, intraday noise
Best for: Scalpers who love action every few minutes
Trader Type: "I refresh my chart 100 times an hour"
Reliability: ⭐⭐ (It's enthusiastic but easily excitable)
Level 1: The Day Trader's Buddy 🎯
What it does: Filters Level 0 to show minor swing highs/lows
Significance: Intraday support/resistance, hourly structure
Best for: Day traders, scalpers looking for better entries
Trader Type: "I close all positions before dinner"
Reliability: ⭐⭐⭐ (Solid for quick moves)
Level 2: The Swing Trader's Sweet Spot 🎪
What it does: Identifies multi-day to weekly structure points
Significance: Intermediate support/resistance where battles happen
Best for: Swing traders, position traders
Trader Type: "I hold for days, not minutes"
Reliability: ⭐⭐⭐⭐ (Now we're talking real structure!)
Level 3: The Big Money Magnet 💰
What it does: Shows major market structure—where the whales play
Significance: Weekly to monthly levels, institutional zones
Best for: Position traders, trend followers
Trader Type: "I think in weeks and months, not hours"
Reliability: ⭐⭐⭐⭐⭐ (These levels have gravitational pull!)
Level 4: The Market Prophet 🔮
What it does: Reveals ultra-major turning points (think: quarterly/yearly pivots)
Significance: Long-term macro structure, investment-grade levels
Best for: Investors, long-term position traders
Trader Type: "Warren Buffett is my spirit animal"
Reliability: ⭐⭐⭐⭐⭐⭐ (When these break, market's rewrite the story)
⚙️ Parameter Setup Guide (The Secret Sauce)
The magic ingredient is the ATR Lookback Period—think of it as teaching the indicator your timeframe's "dialect." Here's your cheat sheet:
2-Minute Chart ⚡
ATR Lookback: 720 (24 hours of 2-min bars)
Who uses this: Crypto degens, futures scalpers, adrenaline junkies
Show Levels: L0, L1, L2 (L3+ won't budge much)
Pro Tip: Enable only L1 and L2 or your chart will look like spaghetti
5-Minute Chart 🏃
ATR Lookback: 288 (24 hours of 5-min bars)
Who uses this: Active day traders, news traders
Show Levels: L1, L2, L3
Pro Tip: L2 is your best friend here—perfect for intraday swings
15-Minute Chart 📈
ATR Lookback: 96 (24 hours of 15-min bars)
Who uses this: Swing traders, patient day traders
Show Levels: L1, L2, L3
Pro Tip: This is the "Goldilocks zone"—not too fast, not too slow
1-Hour Chart ⏰
ATR Lookback: 168 (1 week of hourly bars)
Who uses this: Swing traders, position traders
Show Levels: L2, L3, L4
Pro Tip: L3 levels here are like magnets for price action
Daily Chart 📅
ATR Lookback: 30 to 50 (1-2 months)
Who uses this: Investors, long-term traders, people with patience
Show Levels: L2, L3, L4
Pro Tip: L4 on dailies = "Don't fight this level, respect it"
🎨 How to Use This Thing
Add to Chart - Duh! 😄
Set Your ATR Lookback - Use the guide above (don't wing it!)
Enable Relevant Levels - Less is more! Turn off levels that just clutter
Watch the Magic - See horizontal lines appear at key S/R zones
Check the Table - Top-right corner shows current levels (fancy!)
Set Alerts - Get notified when price approaches or breaks levels
Trading Strategies 🎲
The Bounce Play:
Price approaches Level 2 or 3 support → Look for bullish reversal signals
Take profit at the next level resistance
Stop loss just below the support level
The Breakout Play:
Price breaks through Level 2/3 resistance with volume → Go long
Next level becomes your target
Failed breakout? Level becomes resistance again (classic fake-out)
The Confluence Play:
When Level 3 aligns with your favorite indicator (RSI oversold, moving average, Fibonacci) → Chef's kiss! 👨🍳💋
These multi-confirmation setups are where the money lives
🚨 Important Notes (Read This or Blame Yourself Later)
⚠️ This indicator REPAINTS on the current bar until an extreme is confirmed. That's not a bug, it's how directional change works. The past levels are solid as a rock, but the pending one is still... pending.
⚠️ More levels ≠ Better results. Showing all 5 levels is like having 5 GPS apps shouting directions at once. Pick 2-3 levels max.
⚠️ ATR Lookback matters! Wrong setting = garbage results. Use the guide above or experiment carefully.
⚠️ Volatile markets (crypto, meme stocks) work GREAT with this. Choppy, range-bound markets? Meh.
⚠️ Combine with other tools! This shows you WHERE, not WHEN. Use momentum indicators, volume, or your favorite chicken entrails for timing 🐔
🦜 Final Word from Stock Kaka
Remember: Indicators don't make money, traders do. This tool shows you where the market has historically respected structure. What you do with that info? That's on you, champ!
Use proper risk management, don't YOLO your rent money, and may your stops never get hunted 🎯
Trade smart, trade safe, and let Stock Kaka be your guide!
📝 Credits
Algorithm: neurotrader888 (Python implementation)
Pine Script Conversion: Your friendly neighborhood Stock Kaka team!!
Inspiration: Ginger chai, market inefficiencies, and a dash of chaos
📌 Tags
support-and-resistance market-structure atr directional-change multi-timeframe swing-trading day-trading levels hierarchical-analysis algo-trading
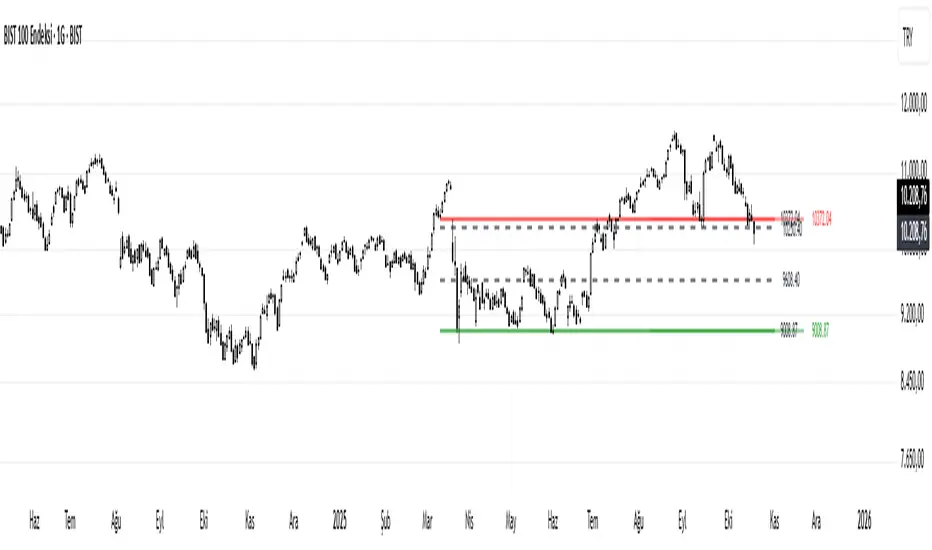
Sokongan dan Rintangan

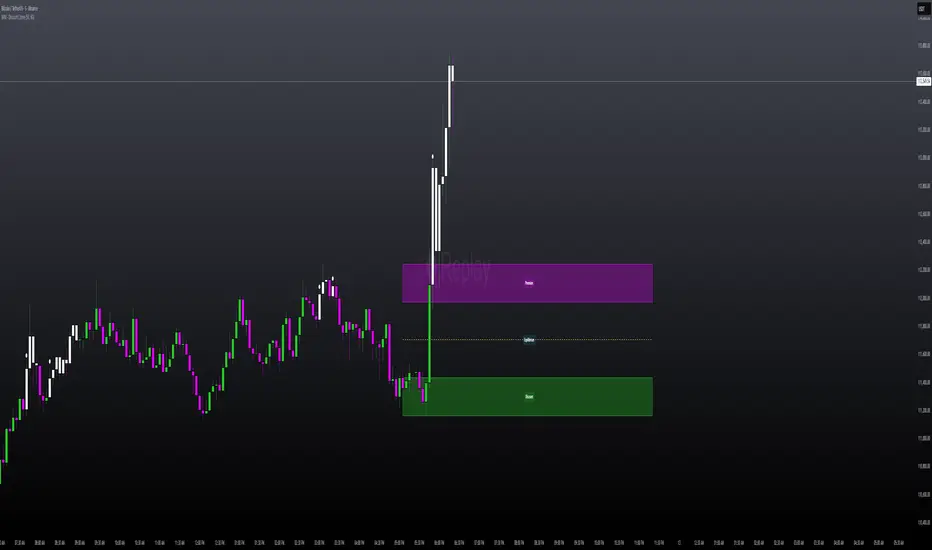
W1 Keyzones Overlay (D1) by Delta 1 / Norman AXLRODW1 Keyzones Overlay (D1) — Description and User Guide
What it does:
This indicator projects weekly key zones (W1) onto your D1 chart. It detects confirmed weekly pivot highs and lows and derives resistance and support zones. Zones are intentionally invisible (no fill, no border). Instead, centered labels are shown at the current bar: “W1 Res” for weekly resistance and “W1 Sup” for weekly support. Two alerts are included: “Approach” (price approaches a zone within a set distance) and “Hit” (price is inside a zone).
Features:
Automatic W1 pivot high/low detection. Configurable zone width (percentage of pivot price). Centered labels placed at the zone midpoint and aligned to the current bar on the right. Invisible zones to keep the chart clean. Alerts for approach and hit. FX pip handling including the JPY 0.01 pip convention.
Inputs:
W1 Pivot Period (default 5): sensitivity of weekly pivot detection; higher values produce fewer, stronger zones.
Max Zones: maximum number of stored and visible zones.
Zone Width (% of price): for example 0.0025 equals 0.25% of price.
Show Labels: toggle to show or hide W1 Res/W1 Sup labels.
Colors: base colors for resistance and support labels (zones remain invisible).
Approach Distance (pips): distance to the top of a zone that triggers the Approach alert; pip size is handled automatically, JPY pairs use 0.01.
How to read it:
Focus on the labels. W1 Res marks an active weekly resistance zone. W1 Sup marks an active weekly support zone. Labels sit at the midpoint of each zone and at the current bar, so key levels are always visible on the right side of the chart. Zones are invisible by design; the internal zone width still governs the alert logic and whether price is considered “inside” the zone. Use the alerts as prompts: “Approach” is an early heads-up, “Hit” signals active interaction with the zone where you can look for confirmation via price action.
Typical use:
Set your directional bias on D1 by noting which weekly levels are nearby. Check confluence with your own levels, moving averages, structure, volume and the calendar. Consider playbook ideas such as rebounds at W1 Sup after confirmation, fades at W1 Res with protective stops, or break-and-retest setups after a clean break.
Best practices:
Use D1 for context and time entries on H1 or M15. Increase the pivot period if you see too many labels. Adjust zone width so it is neither too narrow (false touches) nor too wide (diluted signals). Set a larger approach distance for JPY pairs. Never use the tool in isolation; combine it with price action, regime (trend or range), volatility and event risk.
Alert setup (TradingView):
Create a new alert. In Condition, select this indicator. Choose either “Approach to W1 Keyzone” or “W1 Keyzone Hit.” Pick the frequency (once per bar or once per bar close). Optionally customize the message with symbol and plan. Save.
Notes and limits:
FX pip logic auto-detects JPY pairs (pip equals 0.01). Non-FX defaults to 1.0 for the pip unit. The indicator uses confirmed weekly pivots and does not look ahead; labels update each bar while zones remain stable. Very large Max Zones values over long histories may affect performance. Zones are intentionally invisible; reduce transparency or add border width in the code if you want visible boxes.
Example workflow:
On D1, locate nearby W1 Res or W1 Sup relative to current price. Check the calendar for risk events such as CPI, NFP or central bank decisions. Drop to H1 or M15 and wait for a trigger (rejection or break and retest). Place the stop beyond or behind the zone and plan risk-reward. Manage the trade with partials at the first structure level, move to break even after a retest, and let the remainder run.
FAQ:
Why do I only see labels? This is by design to keep charts clean. The logic still uses the zones internally.
Can I make zones visible? Yes. Reduce transparency and/or increase border width in the code or expose those as inputs.
How large should the approach distance be for JPY pairs? Typically larger than for non-JPY, for example 40 to 80 pips where one pip equals 0.01.
Disclaimer:
This is not financial advice. For educational purposes only. Always do your own research and use strict risk management.
Support / contact:
Questions or suggestions: (mailto:Delta1trading@protonmail.com).

Daily Pivot Points LEVELS S-RThis indicator plots daily pivot points based on the previous day’s high, low, and close. It displays the main pivot line, as well as the first levels of support (S1) and resistance (R1), with optional second levels (R2, S2) for additional reference. Ideal for
Darvas Lines/Box1. Overview
The Darvas Lines/Box (v1.0) is a dynamic trend following indicator based on the renowned method developed by Nicolas Darvas. It's designed to identify clear price consolidation ranges and detect decisive breakouts, crucial for positional and swing trading strategies.
This indicator automatically draws and adjusts the consolidation ranges, and includes modern enhancements such as Advanced Retest Confirmation and exposed alert conditions, providing reliable signals for monitoring and acting on trend continuations.
2. Core Features
Custom Display Mode (Lines/Box): Allows the user to toggle the visualization between showing just the Breakout Lines (Lines) or displaying the consolidation area with a filled background box (Box).
Source Selection (Wicks/Body): Users can choose whether the box boundaries are defined by the candlestick wicks (price extremes) or the candlestick body (open/close price). This feature is critical for adjusting sensitivity to market noise.
Dynamic Box Drawing: Draws Darvas boxes automatically by tracking price highs and lows based on user-defined parameters (Bars to Define Range, Max Box Height).
Retest Confirmation: Detects if the old resistance/support line functions effectively after a breakout. When a retest is confirmed, the line is extended and its color changes.
Price Labels (Stable Lock): Displays the highest and lowest box prices, fixed to the left outer edge of the box. This ensures stable visibility.
Progress Labels: Visualizes the current line price and the percentage distance to the closing price on the right side of the box, showing progress toward the next breakout.
3. Trading Strategy: How to Use the Indicator
This indicator is primarily used to identify trend initiation and trend continuation signals.
A. Entry Strategy (Breakout)
Long Entry Action: Consider taking a long entry when the price closes above the Upper Line (Green Line), signaled by a BULLISH BREAKOUT alert.
Signal: Use the BULLISH BREAKOUT alert.
Short Entry Action: Consider taking a short entry when the price closes below the Lower Line (Red Line), signaled by a BEARISH BREAKOUT alert.
Signal: Use the BEARISH BREAKOUT alert.
B. Retest Strategy (Add-on/Confirmation)
Action: When the price pulls back to touch the broken line (signaled by RETEST CONFIRMED), this confirms the break's validity.
Alert: The RETEST CONFIRMED alert is triggered at this moment.
C. Risk Management (General)
Stop Loss: The initial stop-loss is typically set just beyond the opposite side of the broken box. As the trend progresses and new boxes form, the lower boundary of the most recently formed box can be used as a trailing stop for managing risk.
4. Setting Parameters
Line Source (Wicks/Body): Crucial for sensitivity. 'Wicks' tracks price extremes; 'Body' tracks stronger close-to-close movements, ignoring noise.
Bars to Define Range: Defines the calculation period (in bars) for the box.
Cooldown Bars After Breakout: Sets the waiting period after a breakout before a new box can start forming.
Retest Lookback Bars (Phase 3): Sets the maximum number of bars to check for a retest during the cooldown phase.
Max Gap for Retest (%): Defines the maximum percentage distance from the line allowed to confirm a retest (Set to Zero (0.0%) for near-touch detection).
Alert Frequency (Breakout): Allows selection between Continuous and Once per Box for breakout signals.
5. Alerts: How to Set Up the Triggers
This indicator exposes several specific conditions to the TradingView alert panel, allowing you to select the exact event you want to monitor.
Step-by-Step Alert Setup:
Open the Alert Panel on the chart.
In the Condition field, select the indicator's name.
In the Alert Condition field, choose the specific event you want to monitor:
1. ANY DARVAS EVENT (Consolidated)
2. BULLISH BREAKOUT (Individual)
3. BEARISH BREAKOUT (Individual)
4. RETEST CONFIRMED (Individual)
In the Trigger field (Frequency), select your preferred native option (e.g., "Once Per Bar Close" or "Once per bar").

The Wave Levels (ORB Indicator)This Indicator is made for the ORB trader. It's purpose is to help make your charting faster by providing some basic key levels to reference at a glance. This was optimized to be used on the 5m timeframe.
Key features:
1. Green and Red ORB rays to indicate the 15 minute Opening Range. These ranges will only extend as long as its respective session's length.
2. Previous sessions zones for historical easily identification of historical data (best used in UTC-4 timezone)
3. White Liquidity Rays. These rays are used to mark a previous session's high or low which hasn't been swept yet. This makes for a good TP area or identifying a potential reversal area.
Once a previous session high or low has been taken, the ray will automatically remove.
I am not a professional coder. This indicator was created by continuously prompting AI commands over the course of 3 days.

SMC FVG/IFVG (Multi-TF x 4) [ZAUTEC]SMC FVG/IFVG (Multi-TF x 4): Multi-Timeframe Fair Value Gap with Inversed FVG Detection
This powerful Pine Script indicator is designed to help traders identify, track, and manage Fair Value Gaps (FVGs) and their respective Inversed Fair Value Gaps (IFVGs) across up to four different timeframes simultaneously.
Key Features
Multi-Timeframe Analysis (4x): Analyze and display FVGs from four distinct timeframes alongside your current chart, offering a comprehensive view of market imbalances across various scales.
Fair Value Gap (FVG) Detection: Automatically identifies classic three-candle FVGs (market inefficiencies).
Customizable FVG Length: Set how many bars the FVG boxes should initially extend for.
Minimum Gap Size: Filter out minor, insignificant gaps using a tick-based minimum size threshold.
Optional Box Extension: Dynamically extend FVG boxes to the current bar index or use a fixed extension for a cleaner chart.
Inversed FVG (IFVG) Logic: Detects a high-probability reversal pattern where a previously filled FVG zone is immediately followed by the formation of a new, opposite FVG within or adjacent to the same area. This confirms the old FVG has "flipped roles" (e.g., from support to resistance).
Lookback Period: Defines how long the indicator searches for a corresponding FVG breach to confirm the IFVG.
IFVG Minimum Size: Customizable minimum size threshold for the IFVG.
Dynamic Box Management:
Automatic Fill Deletion: FVGs are automatically removed from the chart when price action fully trades through the gap, signifying the imbalance has been "filled."
IFVG Tracking: IFVGs are tracked and removed from the chart after the configurable lookback period.
Full Customization: Control the visibility, colors, border styles (solid, dashed, dotted), and width for FVG, Bearish FVG, Bullish FVG, and IFVG boxes independently for each of the four timeframes.
How to Use
Select Timeframes: Choose up to four desired timeframes in the settings (e.g., "15" for 15-minute, "4H" for 4-hour, "D" for Daily). Leave the field empty to use the chart's current timeframe.
Toggle Visibility: Use the Show FVG and Show IFVG toggles to focus on the imbalances you wish to see.
Adjust Extension: Set Extend Boxes to bar index to true to keep all open FVG boxes drawn all the way to the current live price bar.
Interpret the Gaps:
FVG (Bullish/Bearish): Potential areas for price to return to and find support/resistance.
IFVG (Inverse FVG): Stronger signals that a previous zone of imbalance has been violated and is likely to act as a significant flip zone for future price movements.
This indicator is an essential tool for traders utilizing concepts like ICT (Inner Circle Trader) and SMC (Smart Money Concepts), providing a clear visual representation of market structure and liquidity voids.

Chronos Reversal Labs🧬 Chronos Reversal Lab - Machine Learning Market Structure Analysis
OVERVIEW
Chronos Reversal Lab (CRL) is an advanced market structure analyzer that combines computational intelligence kernels with classical technical analysis to identify high-probability reversal opportunities. The system integrates Shannon Entropy analysis, Detrended Fluctuation Analysis (DFA), Kalman adaptive filtering, and harmonic pattern recognition into a unified confluence-based signal engine.
WHAT MAKES IT ORIGINAL
Unlike traditional reversal indicators that rely solely on oscillators or pattern recognition, CRL employs a multi-kernel machine learning approach that analyzes market behavior through information theory, statistical physics, and adaptive state-space estimation. The system combines these computational methods with geometric pattern analysis and market microstructure to create a comprehensive reversal detection framework.
HOW IT WORKS (Technical Methodology)
1. COMPUTATIONAL KERNELS
Shannon Entropy Analysis
Measures market uncertainty using information theory:
• Discretizes price returns into bins (user-configurable 5-20 bins)
• Calculates probability distribution entropy over lookback window
• Normalizes entropy to 0-1 scale (0 = perfectly predictable, 1 = random)
• Low entropy states (< 0.3 default) indicate algorithmic clarity phases
• When entropy drops, directional moves become statistically more probable
Detrended Fluctuation Analysis (DFA)
Statistical technique measuring long-range correlations:
• Analyzes price series across multiple box sizes (4 to user-set maximum)
• Calculates fluctuation scaling exponent (Alpha)
• Alpha > 0.5: Trend persistence (momentum regime)
• Alpha < 0.5: Mean reversion tendency (reversal regime)
• Alpha range 0.3-1.5 mapped to trading strategies
Kalman Adaptive Filter
State-space estimation for lag-free trend tracking:
• Maintains separate fast and slow Kalman filters
• Process noise and measurement noise are user-configurable
• Tracks price state with adaptive gain adjustments
• Calculates acceleration (second derivative) for momentum detection
• Provides cleaner trend signals than traditional moving averages
2. HARMONIC PATTERN DETECTION
Identifies geometric reversal patterns:
• Gartley: 0.618 AB/XA, 0.786 AD/XA retracement
• Bat: 0.382-0.5 AB/XA, 0.886 AD/XA retracement
• Butterfly: 0.786 AB/XA, 1.272-1.618 AD/XA extension
• Cypher: 0.382-0.618 AB/XA, 0.786 AD/XA retracement
Pattern Validation Process:
• Requires alternating swing structure (XABCD points)
• Fibonacci ratio tolerance: 0.02-0.20 (user-adjustable precision)
• Minimum 50% ratio accuracy score required
• PRZ (Potential Reversal Zone) calculated around D point
• Zone size: ATR-based with pattern-specific multipliers
• Active pattern tracking with 100-bar invalidation window
3. MARKET STRUCTURE ANALYSIS
Swing Point Detection:
• Pivot-based swing identification (3-21 bars configurable)
• Minimum swing size: ATR multiples (0.5-5.0x)
• Adaptive filtering: volatility regime adjustment (0.7-1.3x)
• Swing confirmation tracking with RSI and volume context
• Maintains structural history (up to 500 swings)
Break of Structure (BOS):
• Detects price crossing previous swing highs/lows
• Used for trend continuation vs reversal classification
• Optional requirement for signal validation
Support/Resistance Detection:
• Identifies horizontal levels from swing clusters
• Touch counting algorithm (price within ATR×0.3 tolerance)
• Weighted by recency and number of tests
• Dynamic updating as structure evolves
4. CONFLUENCE SCORING SYSTEM
Multi-factor analysis with regime-aware weighting:
Hierarchical Kernel Logic:
• Entropy gates advanced kernel activation
• Only when entropy < threshold do DFA and Kalman accelerate scoring
• Prevents false signals during chaotic (high entropy) conditions
Scoring Components:
ML Kernels (when entropy low):
• Low entropy + trend alignment: +3.0 points × trend weight
• DFA super-trend (α>1.5): +4.0 points × trend weight
• DFA persistence (α>0.65): +2.5 points × trend weight
• DFA mean-reversion (α<0.35): +2.0 points × mean-reversion weight
• Kalman acceleration: up to +3.0 points (scaled by magnitude)
Classical Technical Analysis:
• RSI oversold (<30) / overbought (>70): +1.5 points
• RSI divergence (bullish/bearish): +2.5 points
• High relative volume (>1.5x): +0-2.0 points (scaled)
• Volume impulse (>2.0x): +1.5 points
• VWAP extremes: +1.0 point
• Trend alignment (Kalman fast vs slow): +1.5 points
• MACD crossover/momentum: +1.0 point
Structural Factors:
• Near support (within 0.5 ATR): +0-2.0 points (inverse distance)
• Near resistance (within 0.5 ATR): +0-2.0 points (inverse distance)
• Harmonic PRZ zone: +3.0 to +6.0 points (pattern score dependent)
• Break of structure: +1.5 points
Regime Adjustments:
• Trend weight: 1.5× in trend regime, 0.5× in mean-reversion
• Mean-reversion weight: 1.5× in MR regime, 0.5× in trend
• Volatility multiplier: 0.7-1.3× based on ATR regime
• Theory mode multiplier: 0.8× (Conservative) to 1.2× (APEX)
Final Threshold:
Base threshold (default 3.5) adjusted by:
• Theory mode: -0.3 (APEX) to +0.8 (Conservative)
• Regime: +0.5 (high vol) to -0.3 (low vol or strong trend)
• Filter: +0.2 if regime filter enabled
5. SIGNAL GENERATION ARCHITECTURE
Five-stage validation process:
Stage 1 - ML Kernel Analysis:
• Entropy threshold check
• DFA regime classification
• Kalman acceleration confirmation
Stage 2 - Structural Confirmation:
• Market structure supports directional bias
• BOS alignment (if required)
• Swing point validation
Stage 3 - Trigger Validation:
• Engulfing candle (if required)
• HTF bias confirmation (if strict HTF enabled)
• Harmonic PRZ alignment (if confirmation enabled)
Stage 4 - Consistency Check:
• Anticipation depth: checks N bars back (1-13 configurable)
• Ensures Kalman acceleration direction persists
• Filters whipsaw conditions
Stage 5 - Structural Soundness (Critical Filter):
• Verifies adequate room before next major swing level
• Long signals: must have >0.25 ATR clearance to last swing high
• Short signals: must have >0.25 ATR clearance to last swing low
• Prevents trades directly into obvious structural barriers
Dynamic Risk Management:
• Stop-loss: Placed beyond last structural swing ± 2 ticks
• Take-profit 1: Risk × configurable R1 multiplier (default 1.5R)
• Take-profit 2: Risk × configurable R2 multiplier (default 3.0R)
• Confidence score: Calibrated 0-99% based on confluence + kernel boost
6. ADAPTIVE REGIME SYSTEM
Continuous market state monitoring:
Trend Regime:
• Kalman fast vs slow positioning
• Multi-timeframe alignment (optional HTF)
• Strength: ATR-normalized fast/slow spread
Volatility Regime:
• Current ATR vs 100-bar average
• Regime ratio: 0.7-1.3 typical range
• Affects swing size filtering and cooldown periods
Signal Cooldown:
• Base: User-set bars (1-300)
• High volatility (>1.5): cooldown × 1.5
• Low volatility (<0.5): cooldown × 0.7
• Post-BOS: minimum 20-bar cooldown enforced
FOUR OPERATIONAL MODES
CONSERVATIVE MODE:
• Threshold adjustment: +0.8
• Mode multiplier: 0.8×
• Strictest filtering for highest quality
• Recommended for: Beginners, large accounts, swing trading
• Expected signals: 3-5 per week (typical volatile instrument)
BALANCED MODE:
• Threshold adjustment: +0.3
• Mode multiplier: 1.0×
• Standard operational parameters
• Recommended for: General trading, learning phase
• Expected signals: 5-10 per week
APEX MODE:
• Threshold adjustment: -0.3
• Mode multiplier: 1.2×
• Maximum sensitivity, reduced cooldowns
• Recommended for: Scalping, high volatility, experienced traders
• Expected signals: 10-20 per week
INSTITUTIONAL MODE:
• Threshold adjustment: +0.5
• Mode multiplier: 1.1×
• Enhanced structural weighting, HTF emphasis
• Recommended for: Professional traders, swing positions
• Expected signals: 4-8 per week
VISUAL COMPONENTS
1. Fibonacci Retracement Levels
• Auto-calculated from most recent swing structure
• Standard levels: 0%, 23.6%, 38.2%, 50%, 61.8%, 78.6%, 100%, 127.2%, 161.8%, 200%, 261.8%
• Key levels emphasized (50%, 61.8%, 100%, 161.8%)
• Color gradient from bullish to bearish based on level
• Automatic cleanup when levels are crossed
• Label intensity control (None/Fib only/All)
2. Support and Resistance Lines
• Dynamic horizontal levels from swing clusters
• Width: 2px solid lines
• Colors: Green (support), Red (resistance)
• Labels show price and level type
• Touch-based validation (minimum 2 touches)
• Real-time updates and invalidation
3. Harmonic PRZ Boxes
• Displayed around pattern completion (D point)
• Pattern-specific colors (Gartley: purple, Bat: orange, etc.)
• Box height: ATR-based zone sizing
• Score-dependent transparency
• 100-bar active window before removal
4. Confluence Boxes
• Appear when confluence ≥ threshold
• Yellow/orange gradient based on score strength
• Height: High to low of bar
• Width: 1 bar on each side
• Real-time score-based transparency
5. Kalman Filter Lines
• Fast filter: Bullish color (green default)
• Slow filter: Bearish color (red default)
• Width: 2px
• Transparency adjustable (0-90%)
• Optional display toggle
6. Signal Markers
• Long: Green triangle below bar (tiny size)
• Short: Red triangle above bar (tiny size)
• Appear only on confirmed signals
• Includes alert generation
7. Premium Dashboard
Features real-time metrics with visual gauges:
Layout Options:
• Position: 4 corners selectable
• Size: Small (9 rows) / Normal (12 rows) / Large (14 rows)
• Themes: Supreme, Cosmic, Vortex, Heritage
Metrics Displayed:
• Gamma (DFA - 0.5): Shows trend persistence vs mean-reversion
• TCI (Trend Strength): ATR-normalized Kalman spread with gauge
• v/c (Relative Volume): Current vs average with color coding
• Entropy: Market predictability state with gauge
• HFL (High-Frequency Line): Kalman fast/slow difference / ATR
• HFL_acc (Acceleration): Second derivative momentum
• Mem Bias: Net bullish-bearish confluence (-1 to +1)
• Assurance: Confidence × (1-entropy) metric
• Squeeze: Bollinger Band / Keltner Channel squeeze detection
• Breakout P: Probability estimate from DFA + trend + acceleration
• Score: Final confluence vs threshold (normalized)
• Neighbors: Active harmonic patterns count
• Signal Strength: Strong/Moderate/Weak classification
• Signal Banner: Current directional bias with emoji indicators
Gauge Visualization:
• 10-bar horizontal gauges (█ filled, ░ empty)
• Color-coded: Green (strong) / Gold (moderate) / Red (weak)
• Real-time updates every bar
HOW TO USE
Step 1: Configure Mode and Resolution
• Select Theory Mode based on trading style (Conservative/Balanced/APEX/Institutional)
• Set Structural Resolution (Standard for fast markets, High for balanced, Ultra/Institutional for swing)
• Enable Adaptive Filtering (recommended for all volatile assets)
Step 2: Enable Desired Kernels
• Shannon Entropy: Essential for predictability detection (recommended ON)
• DFA Analysis: Critical for regime classification (recommended ON)
• Kalman Filter: Provides lag-free trend tracking (recommended ON)
• All three work synergistically; disabling reduces effectiveness
Step 3: Configure Confluence Factors
• Enable desired technical factors (RSI, MACD, Volume, Divergence)
• Enable Liquidity Mapping for support/resistance proximity scoring
• Enable Harmonic Detection if trading pattern-based setups
• Adjust base confluence threshold (3.5 default; higher = fewer, cleaner signals)
Step 4: Set Trigger Requirements
• Require Engulfing: Adds precision, reduces frequency (recommended for Conservative)
• Require BOS: Ensures structural alignment (recommended for trend-following)
• Require Structural Soundness: Critical filter preventing traps (highly recommended)
• Strict HTF Bias: For multi-timeframe traders only
Step 5: Adjust Visual Preferences
• Enable/disable Fibonacci levels, S/R lines, PRZ boxes, confluence boxes
• Set label intensity (None/Fib/All)
• Adjust transparency (0-90%) for overlay clarity
• Configure dashboard position, size, and theme
Step 6: Configure Alerts
• Enable master alerts toggle
• Select alert types: Anticipation, Confirmation, High Confluence, Low Entropy
• Enable JSON details for automated trading integration
Step 7: Interpret Signals
• Wait for triangle markers (green up = long, red down = short)
• Check dashboard for confluence score, entropy, DFA regime
• Verify signal aligns with higher timeframe bias (if using HTF setting)
• Confirm adequate space to take-profit levels (no nearby structural barriers)
Step 8: Execute and Manage
• Enter at close of signal candle (or next bar open)
• Set stop-loss at calculated level (visible in alert if JSON enabled)
• Scale out at TP1 (1.5R default), trail remaining to TP2 (3.0R default)
• Exit early if entropy spikes >0.7 or DFA regime flips against position
CUSTOMIZATION GUIDE
Timeframe Optimization:
Scalping (1-5 minutes):
• Theory Mode: APEX
• Anticipation Depth: 3-5
• Structural Resolution: STANDARD
• Signal Cooldown: 8-12 bars
• Enable fast kernels, disable HTF bias
Day Trading (15m-1H):
• Theory Mode: BALANCED
• Anticipation Depth: 5-8
• Structural Resolution: HIGH
• Signal Cooldown: 12-20 bars
• Standard configuration
Swing Trading (4H-Daily):
• Theory Mode: INSTITUTIONAL
• Anticipation Depth: 8-13
• Structural Resolution: ULTRA or INSTITUTIONAL
• Signal Cooldown: 20-50 bars
• Enable HTF bias, strict confirmations
Market Type Optimization:
Forex Majors:
• All kernels enabled
• Harmonic patterns effective
• Balanced or Institutional mode
• Standard settings work well
Stock Indices:
• Emphasis on volume analysis
• DFA critical for regime detection
• Conservative or Balanced mode
• Enable liquidity mapping
Cryptocurrencies:
• Adaptive filtering essential
• Higher volatility regime expected
• APEX mode for active trading
• Wider ATR multiples for swing sizing
IMPORTANT DISCLAIMERS
• This indicator does not predict future price movements
• Computational kernels calculate probabilities, not certainties
• Past confluence scores do not guarantee future signal performance
• Always backtest on YOUR specific instruments and timeframes before live trading
• Machine learning kernels require calibration period (minimum 100 bars of data)
• Performance varies significantly across market conditions and regimes
• Signals are suggestions for analysis, not automated trading instructions
• Proper risk management (stops, position sizing) is mandatory
• Complex calculations may impact performance on lower-end devices
• Designed for liquid markets; avoid illiquid or gap-prone instruments
PERFORMANCE CONSIDERATIONS
Computational Intensity:
• DFA analysis: Moderate (scales with length and box size parameters)
• Entropy calculation: Moderate (scales with lookback and bins)
• Kalman filtering: Low (efficient state-space updates)
• Harmonic detection: Moderate to High (pattern matching across swing history)
• Overall: Medium computational load
Optimization Tips:
• Reduce Structural Analysis Depth (144 default → 50-100 for faster performance)
• Increase Calc Step (2 default → 3-4 for lighter load)
• Reduce Pattern Analysis Depth (8 default → 3-5 if harmonics not primary focus)
• Limit Draw Window (150 bars default prevents visual clutter on long charts)
• Disable unused confluence factors to reduce calculations
Best Suited For:
• Liquid instruments: Major forex, stock indices, large-cap crypto
• Active timeframes: 5-minute through daily (avoid tick/second charts)
• Trending or ranging markets: Adapts to both via regime detection
• Pattern traders: Harmonic integration adds geometric confluence
• Multi-timeframe analysts: HTF bias and regime detection support this approach
Not Recommended For:
• Illiquid penny stocks or micro-cap altcoins
• Markets with frequent gaps (stocks outside regular hours without gap adjustment)
• Extremely fast timeframes (tick, second charts) due to calculation overhead
• Pure mean-reversion systems (unless using CONSERVATIVE mode with DFA filters)
METHODOLOGY NOTE
The computational kernels (Shannon Entropy, DFA, Kalman Filter) are established statistical and signal processing techniques adapted for financial time series analysis. These are deterministic mathematical algorithms, not predictive AI models. The term "machine learning" refers to the adaptive, data-driven nature of the calculations, not neural networks or training processes.
Confluence scoring is rule-based with regime-dependent weighting. The system does not "learn" from historical trades but adapts its sensitivity to current volatility and trend conditions through mathematical regime classification.
SUPPORT & UPDATES
• Questions about configuration or usage? Send me a message on TradingView
• Feature requests are welcome for consideration in future updates
• Bug reports appreciated and addressed promptly
• I respond to messages within 24 hours
• Regular updates included (improvements, optimizations, new features)
FINAL REMINDERS
• This is an analytical tool for confluence analysis, not a standalone trading system
• Combine with your existing strategy, risk management, and market analysis
• Start with paper trading to learn the system's behavior on your markets
• Allow 50-100 signals minimum for performance evaluation
• Adjust parameters based on YOUR timeframe, instrument, and trading style
• No indicator guarantees profitable trades - proper risk management is essential
— Dskyz, Trade with insight. Trade with anticipation.
Advanced Swing Points Liquidity by BTTAdvanced Swing Points Liquidity Indicator by BTT
Identify key price reversals and liquidity zones with precision using the Advanced Swing Points Liquidity indicator. This tool automatically detects swing highs (Buy Side Liquidity) and swing lows (Sell Side Liquidity) based on customizable pivot logic, and visualizes these levels on your chart for enhanced trading decisions.
Core Features:
Swing Logic Choice: Instantly switch between classic 3-point (tight pivots) and broader 5-point (stronger swings) swing detection.
Visual Clarity: Each swing point is highlighted with your choice of colored labels and extended horizontal lines.
Custom Line Length: Define how far each liquidity line extends, making it easy to spot critical reversal and breakout zones across the chart.
Liquidity Zones: (Optional) Shaded boxes overlay the chart at swing highs/lows, helping you visualize supply and demand areas and optimize entries/exits.
Distinctive Labels: BSL (Buy Side Liquidity) at swing highs, SSL (Sell Side Liquidity) at swing lows, making institutional liquidity levels immediately visible.
How to Use:
Use swing labels and lines to spot potential price reaction zones, stop hunt areas, and trend reversals.
Combine with your price action, order blocks, or other SMC tools for confirmation and trade planning.
Adjust parameters for any market (indices, stocks, crypto, commodities), any timeframe.
Perfect For:
Smart money traders locating liquidity grabs and stop hunts
Supply & demand, market structure, and swing traders
Anyone wanting automated mapping and visual clarity for swing pivots and institutional levels
Customization:
Choose swing detection style (pivot window)
Toggle lines, labels, and liquidity boxes on/off
Set color, box height, and line length for maximum visual control

TBR Pro+marks session ranges and standard deviation levels to help you calculate where price could go next. You could also use it to top and bottom tick entries for indicies and CFDs!
5/15-Min-ORB-Trend-Finder-WiPIndicator Features:
> "Open" flag for each market day.
> Toggleable 5-min and 15-min High/Low markings.
> Horizontal support (red) and resistance (blue) lines.
> EMA-based trend line: green for long/buy, purple for short/sell.
> Recommended to use with my other indicator: Buy-or-Sell-WiP.
Strategy:
> Use with 1-min chart with 5-min High/Low or 5-min chart with 15-min High/Low
> After a breakout, wait for confirmation before placing a trade, which is:
- Two confirming candles (green for long/buy, red for short/sell)
and
- Buy-or-Sell-WiP histogram: green for long/buy, red for short/sell

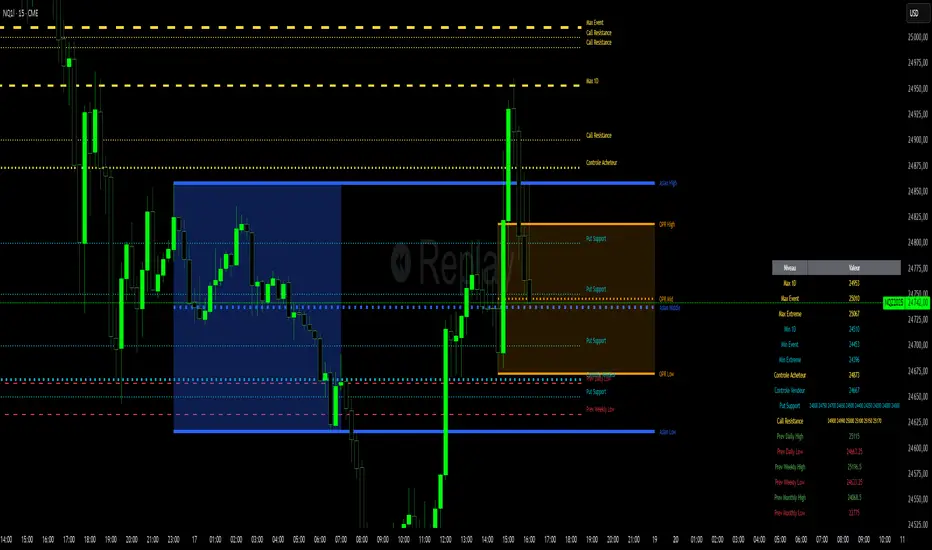
Niv Deal + Previ D W M + OPR + Asian🧭 Indicator Description (English)
Name: Niveaux Dealers + Previous D/W/M Auto + OPR + Asian Session
Platform: TradingView (Pine Script v6)
Type: Multi-module visual indicator for market structure and session ranges
🧩 Overview
This indicator combines three complementary modules to help traders visualize key market levels, opening ranges, and session dynamics — all in one comprehensive tool.
It is designed primarily for index and futures trading (e.g. NQ, ES, DAX), but can be applied to any market or timeframe.
MODULE 1 — Dealers Levels + Previous High/Low (Auto)
This first module automatically extracts and plots custom Dealer Levels and Previous Period Levels.
It can parse manually entered price levels (from a single text input) such as daily max/min, control levels, put supports, and call resistances — then draw horizontal lines and labels on the chart.
Features:
One text input for all dealer levels (easy copy-paste format).
Automatic parsing of prices from text (ignores irrelevant characters).
Groups of levels:
Maxima (Max 1D / Event / Extreme)
Minima (Min 1D / Event / Extreme)
Buyer/Seller Controls
Put Supports and Call Resistances
Independent color, style, and width for each line.
Transparent rectangular labels positioned perfectly on the levels.
Previous Daily, Weekly, and Monthly High/Low levels added automatically.
Optional summary table showing all levels and values in real time.
MODULE 2 — OPR (Opening Price Range)
The second module highlights the Opening Price Range, defined by the first 15 minutes (or any chosen period) of the trading session.
Features:
Fully configurable start and end time (local chart timezone).
Displays:
High, Low, and Midline (median)
Optional rectangle between high/low
Optional labels on each line
Independent color, line style, and thickness.
Works perfectly with non-standard sessions (e.g. 13:30–22:00 UTC for U.S. futures).
Uses local chart time instead of exchange time for intuitive control.
MODULE 3 — Asian Session Range
The third module draws the Asian trading session range, automatically detecting price action between configurable hours (default 17:00 → 01:00).
Features:
Adjustable start and end time (supports overnight sessions).
Plots Asian High, Asian Low, and Asian Middle (mid-range line).
Highlights the Asian box area with semi-transparent color.
Optional labels at the end of each level.
Fully synchronized with the chart’s local timezone (same logic as OPR).
Simple toggle to enable or disable the entire Asian module.
⚙️ Customization & Display
Each module can be toggled independently.
Colors, line styles (solid, dashed, dotted), and thickness are customizable.
Label visibility and extensions (left/right) can be adjusted.
The indicator is lightweight and optimized for real-time performance.
💡 Use Case
Traders can use this multi-module setup to:
Identify dealer reaction zones and institutional levels.
Track previous highs/lows for potential liquidity sweeps.
Monitor session ranges (Opening and Asian) for volatility shifts.
Combine all three perspectives (Dealer, Session, Historical) into one unified view.
Would you like me to rewrite this description in TradingView publication form
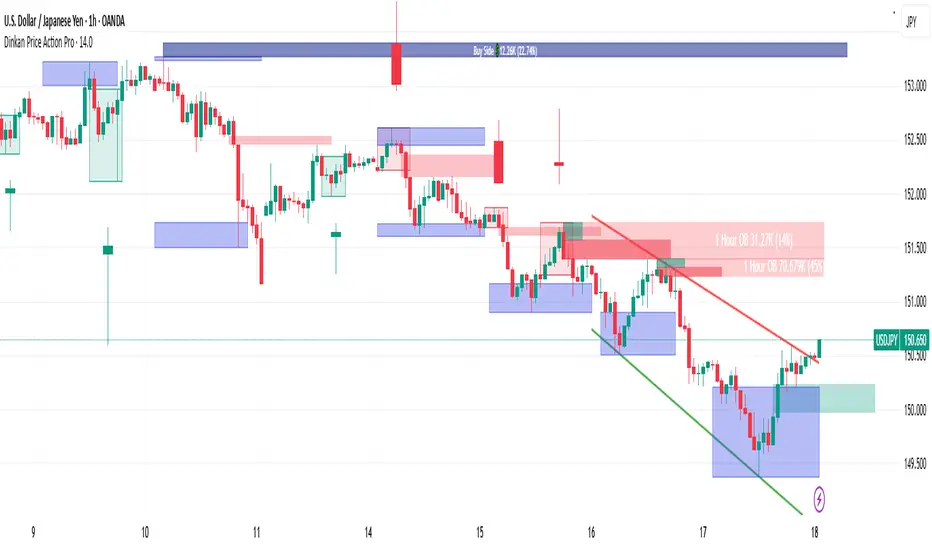
Dinkan Price Action Pro | Pure Price Action Toolkit🔸 Overview
Dinkan Price Action Pro is a pure price-action research toolkit that automatically detects and visualizes Order Blocks (OB), Fair Value Gaps (FVG), merged-candle hidden structures, liquidity zones (including HTF bias liquidity), and trendline & chart-pattern liquidity.
This indicator helps traders align with the Higher Time Frame (HTF) bias — the direction of the dominant institutional wave — and uncover hidden candlestick structures that normal timeframe charts never show.
⚙️ Core Features
✅ Automatic Order Block detection (bullish & bearish)
✅ Fair Value Gaps with real-time fill tracking
✅ Merged-Candle Engine — reveals hidden structures between standard timeframes
✅ Liquidity Zones — equal highs/lows, trendline liquidity & HTF liquidity pools
✅ HTF Bias Engine — detect directional bias across multiple timeframes
✅ Auto Trendlines & Chart Pattern Liquidity
🔍 How It Works (Step by Step)
🕯️ A. Merged Candle Engine (Hidden Structure)
1️⃣ Choose how many candles to merge (e.g., 3–5).
2️⃣ The script groups candles backward from the current bar in continuous sets.
3️⃣ Each merged candle forms using:
• Open = first candle’s open • Close = last candle’s close
• High = highest high • Low = lowest low
4️⃣ These new candles expose “hidden” structures between fixed timeframes — revealing true base-impulse patterns missed by normal charts.
🟩 B. Order Block Detection
Detects consolidation (base) followed by strong impulse.
Marks demand (green) and supply (red) zones automatically.
Strength calculated using impulse range (and volume, if available).
Older, mitigated OBs can be hidden for clarity.
🟦 C. Fair Value Gaps (FVG)
Automatically detects imbalances between consecutive candles.
Unfilled FVGs are highlighted; once filled, zones fade or gray out.
Works dynamically across merged and standard candles.
🟧 D. Liquidity Zones
Finds equal highs/lows, wick clusters, and structural liquidity.
Trendline liquidity and chart-pattern liquidity detected in real time.
Projects HTF liquidity zones from higher charts down to current timeframe.
🔺 E. HTF Bias Engine
Analyzes higher and medium timeframes (HTF/MTF) using CISD-style confirmation.
Bias auto-adjusts or can be manually selected.
🧭 Purpose: Identify the dominant institutional flow and trade in its direction.
⏰ Timeframe Alignment
Recommended structure:
HTF: 4H or 1D
MTF: 1H or 30M
LTF: 15M or 5M
Users may let the script auto-adjust or manually configure each timeframe combination.
📘 Inputs & Settings
🔹 OB sensitivity (Low / Medium / High)
🔹 Volume weighting toggle
🔹 HTF & MTF selection (Auto / Manual)
🔹 Multi-symbol mode
🔹 Visual toggles (OB, FVG, trendlines, merged candles, bias labels)
🔹 Alert toggles (zone touch, bias flip, hidden structure detection)
📊 How to Use — Workflow Example
1️⃣ Load the indicator on your chart.
2️⃣ Check the HTF Bias direction — trade only in that direction.
3️⃣ Identify nearby Order Blocks or FVGs inside HTF liquidity areas.
4️⃣ Watch the Merged Candle View to confirm hidden structures (base + impulse).
5️⃣ Wait for LTF confirmation (e.g., small structure break, wick rejection).
6️⃣ Place stop beyond the opposite OB edge; target next liquidity cluster.
🎯 This workflow aligns your lower-timeframe trades with the dominant higher-timeframe flow.
🧱 Repainting & Stability
Completed OBs and FVGs remain static — they do not repaint.
Real-time zones during candle formation can update until candle closes (standard behavior).
Merged candles are recalculated each bar; once a group closes, it remains fixed historically.
⚠️ Limitations
This is not a buy/sell signal generator.
Volume-weighted features require volume data.
Use responsible risk management and independent confirmation methods.
🔒 Invite-Only / Locked Code
The script is published as invite-only to protect proprietary implementations of:
The merged-candle engine
Liquidity and bias-detection heuristics
Invite-only publishing complies with TradingView rules.
All logic, purpose, and usage are fully described here for transparency.
🧩 Originality & Usefulness
This script is an original integrated system, not a simple mashup.
Each module is interconnected to provide a unified analytical process:
The Merged Candle Engine creates hybrid bars that expose hidden base–impulse patterns.
These merged bars feed into the Order Block and Fair Value Gap logic, refining zone accuracy.
The Liquidity Detector references those zones and merged bars to locate valid structural pools.
Finally, the HTF Bias Engine confirms directional context across multiple pairs and timeframes.
Together, these elements form a dynamic framework that interprets institutional footprints and structure flow — something no single indicator can achieve individually.
The combination produces new analytical value: a precise, adaptive HTF bias alignment and structure-based liquidity map in one visual system.
📜 Disclaimer
This tool is for educational and analytical use only.
It does not constitute financial advice.
Trading involves risk — always perform independent analysis and practice sound risk management.
Past performance does not guarantee future results.
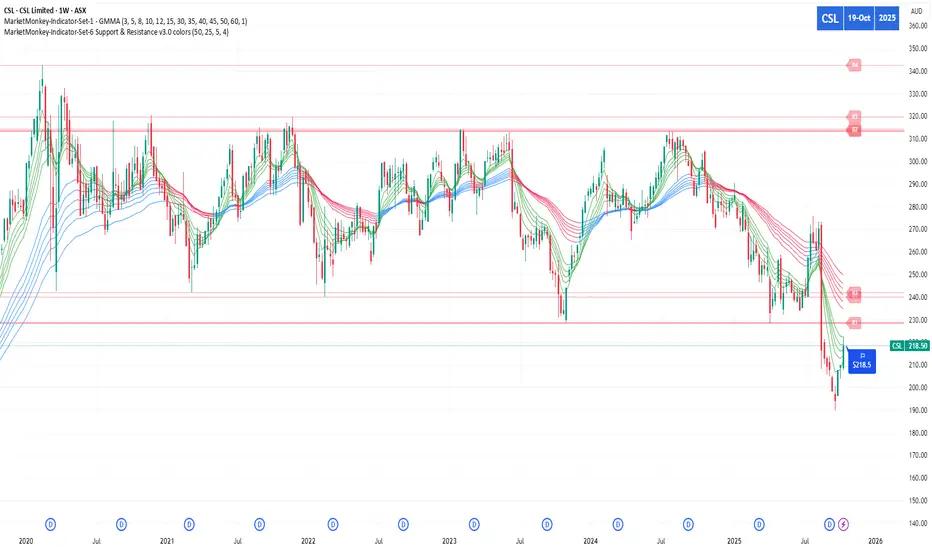
MarketMonkey-Indicator-Set-6 Support & Resistance v3.0 colorsMarketMonkey-Indicator-Set-6 Support & Resistance v3.0 colors
Automatically detects and plots up to four recent support and resistance levels using pivot highs and lows. Lines update dynamically with adaptive colours, highlighting key price zones in real time. Optional R1–R4 and S1–S4 labels keep charts clean yet informative. Ideal for identifying trend reversals, breakout points, and areas where buyers or sellers are likely to act.
________________________________________
🔍 What It Does
The script uses pivot highs and pivot lows to detect recent swing points — the moments where price has clearly turned.
• Resistance levels are drawn at recent pivot highs (red lines).
• Support levels are drawn at recent pivot lows (blue lines).
• Each level automatically updates as new price data forms, keeping your analysis current.
The indicator displays up to four recent resistance and support levels on each side (R1–R4, S1–S4), with labels and colours that adapt to whether the line is above or below current price.
________________________________________
🎨 Features
• Dynamic Detection: Automatically identifies and updates support and resistance using pivot logic.
• Multi-Level Display: Shows up to four most recent highs and lows for a broader market view.
• Customisable Inputs: Adjust the number of bars used to confirm pivots and control how many levels are displayed.
• Colour-Coded Clarity:
o Resistance lines = soft red tone (indicating potential ceiling levels).
o Support lines = soft blue tone (indicating price floors).
• Optional Labels: Toggle on/off “R1–R4” and “S1–S4” tags for quick reference.
• Strong Level Highlighting: The nearest (most recent) levels are drawn thicker for emphasis.
GpPa - Φ Frames (V5.0.1)# GpPa — Φ Frames (V5.0.1)
**What it does**
This tool overlays nine “Phi Frames” on your chart. Each frame builds a dynamic price **box** from the **highest high** and **lowest low** over a user-defined lookback on a fixed timeframe. The boxes help you read structure, extremes, and balance zones across multiple scales in one view. No signals are generated.
**How it works (simple)**
* For every frame, the script requests data at a fixed resolution (e.g., 1D, 610m, 233m, 89m, etc.).
* It scans the last *N* bars at that resolution (your input).
* It draws a box from the start of that window to the current time, bounded by the window’s high and low.
* Optional “Re-Analysis Zone” guides project a vertical line into the future at a user-set offset, giving you a planning marker.
**Frames included**
* **M1** – 1D resolution (default length 258 bars)
* **M2** – 1D resolution (default length 160 bars)
* **M3** – 610-minute resolution (default length 233 bars)
* **M4** – 233-minute resolution (default length 377 bars)
* **M5** – 89-minute resolution (default length 610 bars)
* **M6** – 34-minute resolution (default length 987 bars)
* **M7** – 13-minute resolution (default length 1597 bars)
* **M8** – 5-minute resolution (default length 2584 bars)
* **M9** – 2-minute resolution (default length 4181 bars)
These durations follow a Fibonacci/Φ scheme. Using multiple frames together reveals confluence and nested ranges.
**Inputs & customization**
* **Per-frame controls:**
* *Length (bars)* — lookback window at the frame’s resolution.
* *Show/Hide* — toggle a frame on or off.
* *Color* — box border color.
* **Re-Analysis Zone (M4, M5, M6):**
* *Offset (bars)* — projects a future reference time from the right edge of the box.
* *Show/Hide* and *Color.*
* The line spans slightly above and below the box (+/-10% of its height) for visibility.
**Tips**
* Start with 2–3 frames to reduce clutter. Add more as needed.
* On lower chart resolutions, higher-timeframe boxes will “step” at their own closes.
* Use frames as context for your own entries, risk, and targets.
* Colors are semi-transparent by design so overlaps remain readable.
**Behavior & notes**
* Boxes update intrabar; values settle when the source timeframe closes.
* No alerts, signals, or strategy logic are included.
* Works on any symbol and timeframe.
* Overlay: **true**.
**Disclaimer**
This tool is for educational and informational purposes only. It is not financial advice. Always do your own research and manage risk.
**Credits**
Pine Script™ v6. © thewayofrichie.

Europe Session LinesThis simple script marks the start of the European trading sessions:
08:00 a.m. London trading session
09:00 a.m. Frankfurt trading session
The settings of the lines can be changed. (thickness, colour, type).
It can be used on Futures and CFDs for example for FDAX, FTSE100 but also for GOLD, Silver and EURO- and GBP based FX pairs as supply or demand zone with the change of character trading setup.

MILLION MEN - Discount Zone BreakoutsWhat it is
MILLION MEN — Discount Zone Breakouts (Lite & Stable) highlights a structure-based trading range from the latest confirmed swing high/low, renders Premium/Equilibrium/Discount zones, and raises one-shot breakout signals when price closes outside the range. It focuses on stable visuals and simple breakout logic suitable for intraday and swing trading.
How it works (high-level)
Confirmed swings: Uses ta.pivothigh/ta.pivotlow with auto or manual pivot length.
Range & zones: From the swing range, the tool derives Premium (top 25%), Equilibrium (50%), and Discount (bottom 25%).
Anchoring: Left edge is locked at the bar where the pivot confirms; the right edge can extend N bars.
One-shot breakouts:
Up breakout: first close > swingHigh (resets on new range).
Down breakout: first close < swingLow (resets on new range).
Optional on-close only mode to avoid intrabar noise.
Clean UI: Optional zone boxes, dashed equilibrium line, mid-labels (“Premium / Equilibrium / Discount”), and minimal candle coloring by regime.
How to use
Treat Discount as value area in bullish contexts and Premium as distribution area in bearish contexts.
Breakout dots (up/down) mark regime shifts beyond the current range; confirm with your higher-TF bias, volume, or momentum.
Tune pivot length and forward extension to your timeframe (e.g., smaller for scalping, larger for swings).
Originality & value
Unlike generic S/R overlays, this lite tool prioritizes confirmed swing structure with a fixed anchor, clear 25/50/75 zone mapping, and one-shot breakout logic to prevent repetitive signals until a new range forms. The emphasis is on stability + readability, making it a dependable building block in multi-indicator workflows.
Limitations & transparency
Breakouts on strong trends can retest or fail; always add confirmation (structure/volume).
Pivots confirm with delay equal to pivot length—this reduces repaint and is intentional.
Non-standard bar types are not supported for signal logic.
This indicator provides analysis, not financial advice.
Arabic
يعرض السكربت آخر مدى مؤكد من قمّة/قاع ويرسم مناطق Premium / Equilibrium / Discount، ويعطي إشارة اختراق لمرة واحدة عند إغلاق السعر فوق القمّة أو تحت القاع. الفكرة بسيطة وثابتة بصريًا، وتصلح للإنترادي والسوينغ. يُفضّل تأكيد الاختراق بهيكل أعلى إطار أو فوليوم/مومنتُم. تذكير: تأكيد القمم/القيعان متأخر بحسب طول البيفوت لتفادي إعادة الرسم.
HaP Hibrid S/DThis code is a technical analysis indicator named "HaP Hybrid S/D," developed using Pine Script v5. It is a comprehensive and customizable tool designed to identify support and resistance (S/R) levels, detect order blocks, and analyze market dynamics in financial markets. The code combines adaptive and machine learning (ML)-based systems to offer a hybrid approach, supporting various chart types and multi-timeframe analysis. Below, I detail the core, standout, and superior features of the code:Core FeaturesMulti-Chart Type Support:The indicator allows users to analyze price charts in TRY, USD, or Composite (stock/index ratio) formats.
Users can select line or candlestick chart types, enabling customized visualization based on their needs.
The composite chart analyzes relative performance by dividing stock prices by the BIST XU100 index, while the USD-based chart accounts for exchange rate effects.
Support and Resistance Detection:Adaptive System: Dynamically calculates pivot points (based on high/low or close prices) and automatically adjusts to market conditions (trend, consolidation, volatility).
ML-Based System: Uses machine learning to cluster pivot points (average linkage clustering) and identify the most significant support/resistance levels.
Users can choose to display only the nearest S/R levels or all levels.
Order Block Detection:Identifies buy and sell order blocks using volume and price movement (ATR-based) analysis.
Blocks are filtered based on user-defined minimum volume thresholds and ATR multipliers.
Buy (green) and sell (red) blocks are drawn and labeled for visualization.
Multi-Timeframe Support:Analyzes and draws pivot levels across 4-hour (H4), daily (D1), and weekly (W1) timeframes.
Users can customize these levels with different line styles (solid, dashed, dotted) and thicknesses.
User-Friendly Interface:The indicator is configurable with multiple setting groups (chart selection, order blocks, S/R, color settings, etc.).
Users can customize line thicknesses, label sizes, transparency levels, and colors.
Standout FeaturesHybrid Approach (Adaptive + ML):The indicator combines adaptive and machine learning-based systems to offer a unique hybrid model. Users can choose to use only adaptive, only ML-based, or both systems.
Adaptive System: Dynamically adjusts pivot calculation parameters based on technical indicators like market volatility, trend strength, and ADX.
ML-Based System: Clusters pivot points (similar to k-means with average linkage) to identify the strongest support/resistance levels and optimizes them using silhouette scores.
Dynamic Pivot Memory:In the ML system, pivot memory is automatically adjusted based on volume, trend, and time factors. For example, shorter memory is used in high-volatility periods, while longer memory is preferred in low-volatility periods.
Users can manually set pivot memory or opt for automatic adjustment.
Fibonacci Integration:Fibonacci retracement levels (0, 0.236, 0.382, 0.5, 0.618, 0.786, 1) can be calculated and integrated with support/resistance levels.
Fibonacci tolerance is dynamically adjusted based on volatility and ATR for more precise levels.
Market Condition Analysis:The indicator automatically detects market conditions (consolidation, trend, volatile market) and optimizes S/R calculation parameters accordingly.
Technical indicators such as ATR, RSI, ADX, MACD, and Bollinger Bands are used to analyze market dynamics.
Management of Broken Levels:Broken support/resistance levels can be automatically hidden (optional).
Order blocks and S/R zones are cleared when the price breaks these levels, ensuring only relevant levels are displayed.
Superior FeaturesAdvanced Visualization:Support and resistance levels are drawn with user-defined colors, transparency, and line styles. Price labels make it easier to track levels.
Order blocks are clearly marked, with the number of historical blocks limitable by the user.
Automatic Optimization:In the ML system, the optimal number of clusters and pivot memory is automatically determined using silhouette scores and level effectiveness scores.
In the adaptive system, pivot calculation parameters (left/right bar count, level length, etc.) are dynamically optimized based on volatility ratio, trend strength, and ADX.
Volume and Trend-Based Analysis:Volume thresholds and ATR multipliers enhance the accuracy of order block detection.
Trend strength (calculated using EMAs and ROC) and volatility ratio improve the precision of S/R levels.
Flexible Timeframe Integration:Multi-timeframe analysis provides a broader market perspective, displaying S/R levels from different timeframes together.
The lookahead feature ensures more accurate pivot detection in multi-timeframe calculations (can be optionally disabled).
Performance and Memory Management:The code is designed for performance with limits such as max_bars_back=3000, max_lines_count=500, and max_labels_count=500.
Unnecessary drawings are cleared, and array sizes are limited to ensure a smooth experience on the TradingView platform.
Use CasesShort-Term Traders: Can use the nearest support/resistance levels and order blocks in the current timeframe to make quick decisions.
Long-Term Investors: Can identify broader market trends and strong S/R levels through multi-timeframe analysis.
Technical Analysts: Can perform in-depth analysis with Fibonacci integration, market condition analysis, and ML-based clustering.
Visual Analysis Enthusiasts: Can achieve a clear and aesthetic chart appearance with customizable colors, labels, and line styles.
Conclusion
HaP Hybrid S/D is a powerful tool for both novice and professional traders in technical analysis. The combination of adaptive and ML-based systems ensures adaptability to dynamic market conditions, offering users a flexible analysis experience. Multi-timeframe support, Fibonacci integration, and comprehensive visualization options make this indicator a standout solution in the market. On the TradingView platform, particularly for stock and index analysis, it is an ideal tool to enhance decision-making processes.
HTF Order Blocks [TradeWithRon]HTF Order Blocks is a clean, multi-timeframe order-flow tool that maps bullish/bearish order blocks and optional breaker blocks from higher timeframes onto your current chart. It’s built for clarity and speed: minimal clutter, configurable labels, and optional Fibonacci extensions for quick projection work.
What it does
Identifies Order Blocks (OBs) using swing structure (configurable lookback).
Marks Breaker Blocks when an OB is breached and market structure flips.
Projects HTF zones from up to two higher timeframes (HTF1 & HTF2), with separate color themes.
Clean visuals: open lines, and smart label placement.
Optional Fibonacci extensions from each OB for quick confluence checks.
Alert-ready: receive alerts on creation of Bullish/Bearish OBs and Breakers.
Key Features
Multi-Timeframe Mapping
Enable HTF1 and/or HTF2 and project their OBs on your active chart.
Uses request.security() with lookahead_off to avoid future-bar leakage.
Fibonacci Add-On (optional)
How it works (logic overview)
Swing detection: Finds recent pivots using a lookback window.
OB creation:
Bullish OB: Created after price closes above a prior swing high, then scans the upswing for the most meaningful base candle range (high/low/open/close).
Bearish OB: Created after price closes below a prior swing low, with symmetric logic.
Breaker state:
A bullish OB turns breaker if price later closes below its base;
A bearish OB turns breaker if price closes above its base.
Cleanup: Breakers are removed if price subsequently recovers past the opposing OB boundary.
HTF OBs are detected on their native timeframe and projected to the active chart; confirmation occurs on the HTF bar’s close.
Gann Square Numbers S/R Levels This script can draw support and demand levels using Gann numbers of natural level.
Functions:
1: Default levels draw from natural numbrers 1 to 100.
2. can change minimum and maximum numbers of natural number. e.g min 50 and max 60. it will draw levels from 50 to 60.
3. You can filter levels of natural number by even and odd.
4. you can draw decimal levels of natural numbers also. e.g if natural number is 50
1.you can draw gann number for 50.01, 50.02, 50.03 , 50.04....
2. you can filter decimal points by odd, even, multiple of 3,5,10,20,25,50 also.

Dynamic Volume Based Key Price LevelsDescription
This indicator introduces a volume-based approach to detecting support and resistance zones.
Instead of relying on price swings or pivots, it analyzes where the most trading activity occurred within a selected lookback period, then marks those levels directly on the chart.
The result is a clear visual map of price areas with strong historical participation, which often act as reaction zones in future moves.
How It Works
The script divides the analyzed range into price bins, sums traded volume for each bin, and highlights the strongest levels based on their share of total volume.
It also includes an optional multi-timeframe mode, allowing traders to analyze higher timeframe volume structures on a lower timeframe chart.
Key Features
🔹 Volume-Based Key Levels Detection: Finds statistically meaningful price zones derived from raw volume data.
🔹 Multi-Timeframe Mode: Optionally use higher timeframe volume to identify key market structure levels.
🔹 Visual Customization: Configure colors, line styles, transparency, and label formatting.
🔹 Automatic Ranking: Highlights the strongest to weakest levels using a color gradient.
🔹 Dynamic Updates: Levels adapt automatically as new bars form.
Inputs Overview
Lookback Bars: Number of historical bars used for analysis.
Price Bins: Defines the precision of volume distribution.
Number of Lines: How many key levels to display.
Min Volume %: Filters out less relevant low-volume bins.
Extend Lines: Choose how lines are projected into the future.
Use Higher Timeframe: Pull data from a higher timeframe for broader perspective.
How to Use
Apply the indicator to your chart and adjust the lookback period.
Optionally enable higher timeframe mode for more stable long-term zones.
Observe the horizontal lines — these represent volume-weighted support and resistance areas.
Combine with your existing tools for trend or momentum confirmation.
This tool helps visualize where market participation was strongest, giving traders a clearer view of potential reaction zones for both intraday and swing analysis.
It’s intended as a visual analytical aid, not a signal generator.
⚠️Disclaimer:
This script is provided for educational and informational purposes only. It is not financial advice and should not be considered a recommendation to buy, sell, or hold any financial instrument. Trading involves significant risk of loss and is not suitable for every investor. Users should perform their own due diligence and consult with a licensed financial advisor before making any trading decisions. The author does not guarantee any profits or results from using this script, and assumes no liability for any losses incurred. Use this script at your own risk.
Trader Jumblo Auto Signal V6Trader Jumblo Auto Signal V6 is an advanced crossover-based signal system designed to generate persistent BUY and SELL entries with dynamic ATR-based Take Profit (TP) and Stop Loss (SL) levels.It provides clean, non-repainting trade signals that remain visible on the chart even after price movement — ensuring clarity during both backtesting and live trading sessions.
⚙️ How It Works
🟦 Two Blue Lines — These are your moving averages (Fast and Slow).
The crossover between them determines the signal direction.
When the Fast MA (light blue) crosses above the Slow MA → a BUY signal appears.
When the Fast MA crosses below the Slow MA → a SELL signal appears.
You can choose between SMA or EMA and adjust the lengths in the settings.
🟢 Green Line — The Take Profit (TP) level, calculated using ATR × TP multiplier.
It shows the projected target area for profit when a trade is active.
🔴 Red Line — The Stop Loss (SL) level, also based on ATR × SL multiplier.
It marks the risk boundary for each signal.
✅ When price reaches the green line, “TP HIT” appears.
❌ When price hits the red line, “SL HIT” appears.
These markers persist so you can analyze trade outcomes clearly.
📈 Main Features
Dynamic ATR-based TP and SL levels (auto-adjust with volatility)
Persistent entry, TP, and SL labels (no vanishing signals)
Optional RSI filter for signal confirmation
Instant alert system for BUY/SELL/TP/SL or combined events
Lightweight and optimized for any timeframe
⚡ Best Use
Ideal for swing and intraday traders who want visual clarity and structured risk/reward zones. Works effectively on Gold, Forex, crypto, indices, and stocks