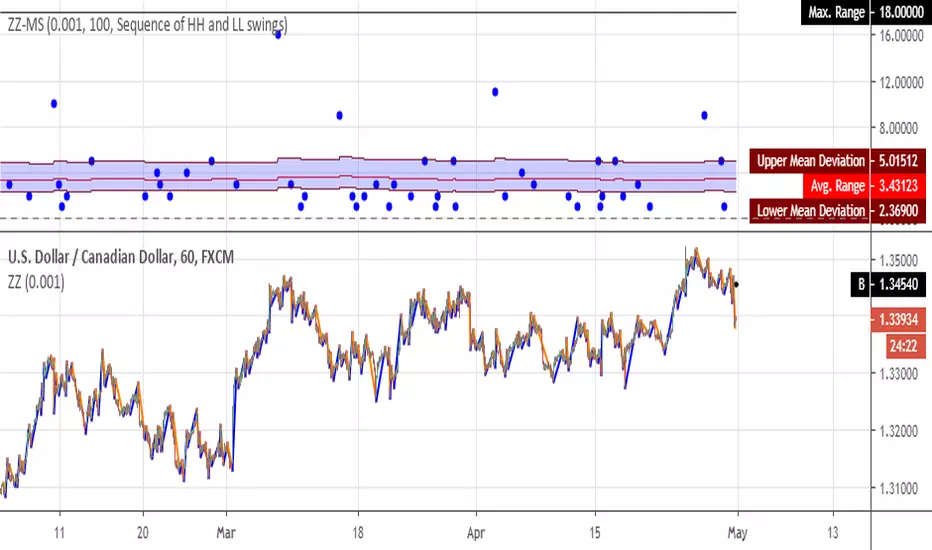
[RS]ZigZag Percent Reversal - Multiple StatisticsMultiple Statistics from zigzag:
• Price range between swings.
• Bar range between swings.
returns maximum value, avg value and mean deviation.
if you find something missing, please leave a message bellow.
Swing
Auto TrendlinesAuto Trendlines
-This indicador show automatically trendlines
- Allows you to select the amount and importance of the trendlines.
-Works in any timeframe or market like Forex, Crypto, Commodities even Stocks.
-Recommended manual trading.
Do you need an Script or an expert adviser for Forex, contact our coding service!
Get this indicator today! contact us.

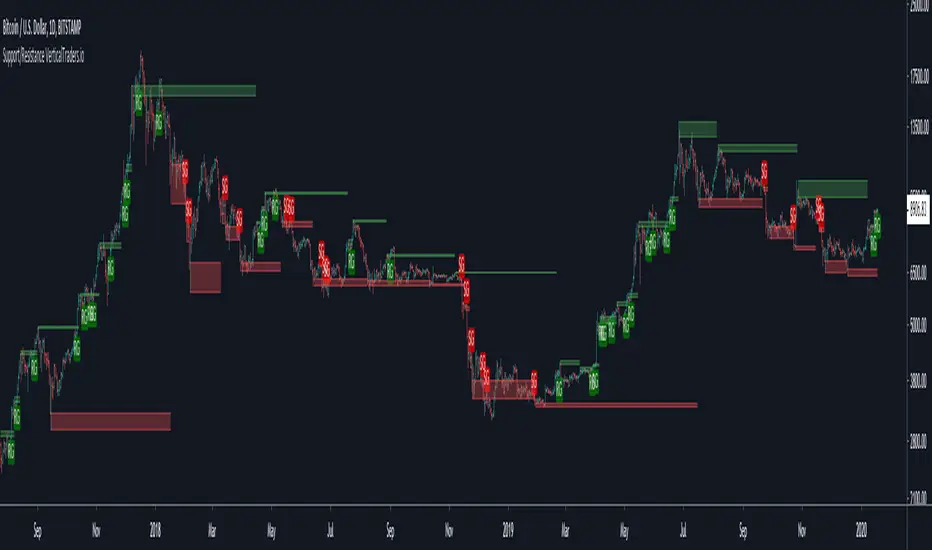
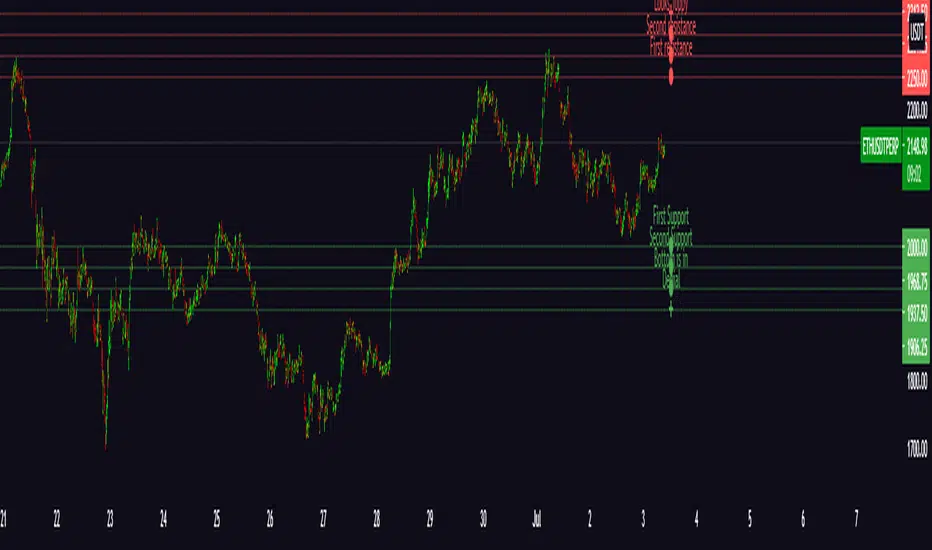
Support and Resistance LevelsSupport and Resistance Levels
-This indicador show automatically the support and resistance levels.
- Allows you to select the amount and importance of the S/R levels.
-This indicator allows to overlay a custom timefame S/R levels.
-You can activate notification alerts for any of the conditions.
-Works in any timeframe or market like Forex, Crypto, Commodities even Stocks.
-Recommended manual trading.
Do you need an Script or an expert adviser for Forex, contact our coding service!
Get this indicator today! contact us.
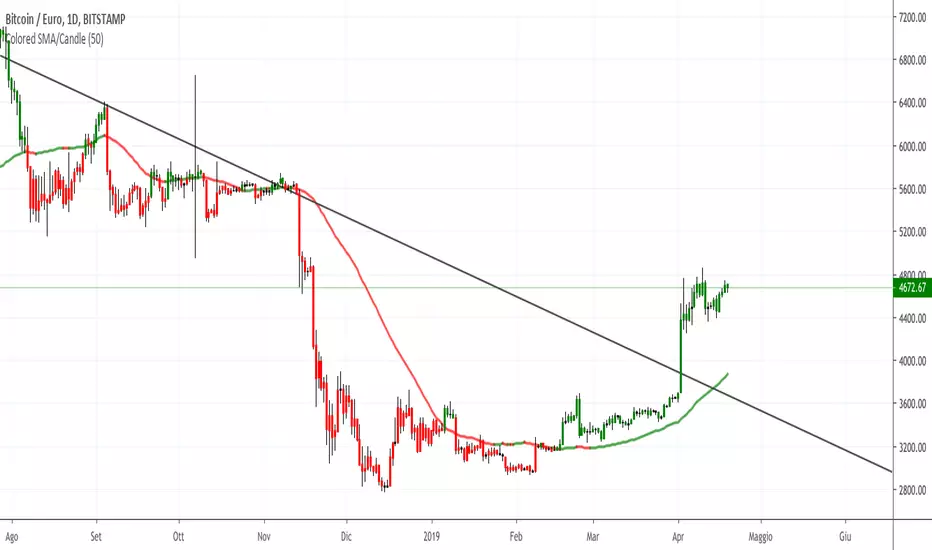
Moving Average & Candle ColoredThis Script plots a Simple Moving Average green coloured when the slope is positive and red coloured when it's negative, it also prints all the candle with the close value greater than the average in green and those with the close value smaller than the value of the average in red. Useful for spot the entries and exits at a glance.
PA Extremely Early version
Experimenting with traditional "market structure" and candlestick patterns for trend analysis

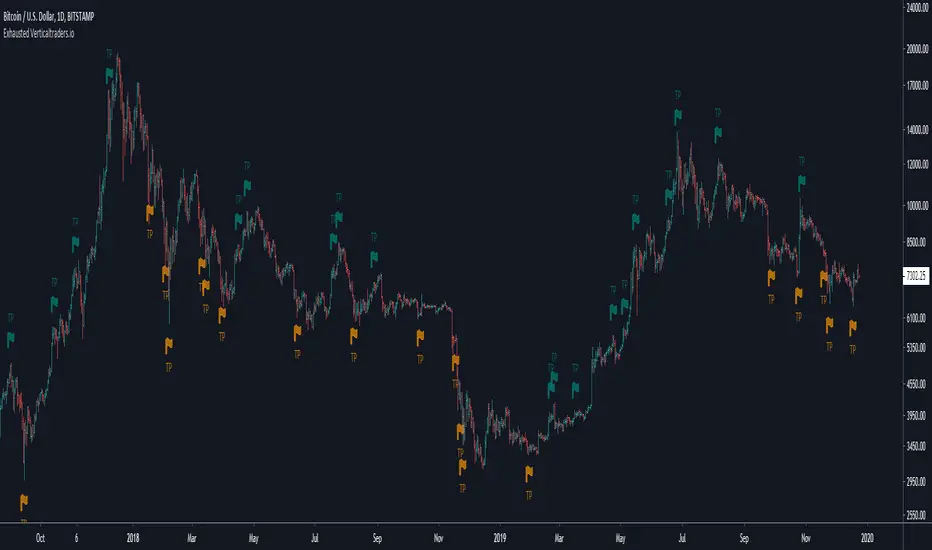
Exhausted-This algorithm takes in consideration Media averages, Volatility Movements, trend direction and other Mathematical Properties.
-After adding this signal on TradingView, you will get notified when it is suggested to protect profit or exits long and short positions.
-Meaning of colors:
Dark Red: suggestion protect profits Long
Red: suggestion exit Long
Dark green: suggestion protect profits Short
Green: suggestion exit Short
-You can activate notification alerts for any of the conditions.
-Works in any timeframe or market like Forex, Crypto, Commodities even Stocks.
-Recommended manual trading.
Do you need an Script or an expert adviser for Forex, contact our coding service!
Get this indicator today! contact us.
Adv Scalper-This algorithm takes in consideration Media averages, Volatility Movements, trend direction and other Mathematical Properties.
-After adding this signal on TradingView, you will get notified every of potential long and short points triggered by the indicator.
-This signal alerts you anytime bars form a bullish or bearish pattern and price start to move in the suggested direction.
- It is recommended to use in 15-30 min timeframes in forex , but It works in any timeframe or market like Forex, Crypto, Commodities even Stocks.
-Recommended manual trading.
Do you need an Script or an expert adviser for Forex, contact our coding service!
Get this indicator today! contact us.

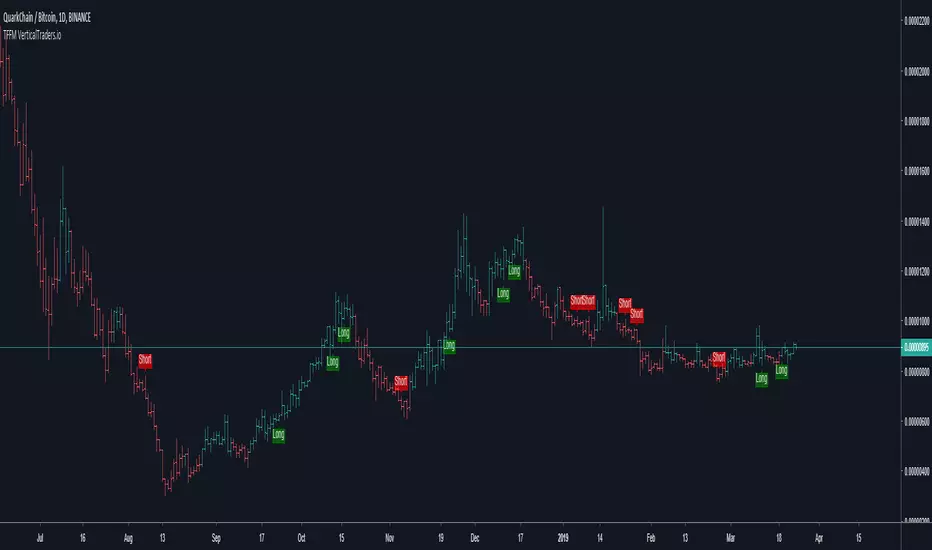
TFFM-This algorithm takes in consideration Media averages, Volatility Movements, trend direction and other Mathematical Properties.
-After adding this signal on TradingView, you will get notified every of potential long and short points triggered by the indicator.
-This signal alerts you anytime bars form a bullish or bearish pattern and price start to move in the suggested direction.
-It works in any time frame or market like Forex, Crypto, Commodities even Stocks.
-Recommended for bots or manual trading.
Do you need an Script or an expert adviser for Forex, contact our coding service:
Get this indicator today! contact us
Premium 3-This algorithm takes in consideration Media averages, Volatility Movements and other Mathematical Properties.
-Allows you to find divergences and price trends in a simple way
-After adding this signal on TradingView, you will see potential long and short according to the colors of the candlesticks.
-It works in any time frame or market like Forex, Crypto, Commodities even Stocks.
Bullish Strength
Olive: weak
Dark green: medium
Light green: strong
Lime: very strong
Bearish strength
Fuchsia: weak
Maron: medium
Red: strong
Intense red: very strong
Do you need an Script or an expert adviser for Forex, contact our coding service
Get this indicator today! contact us

Entry Bars -This algorithm takes in consideration Media averages, Volatility Movements and other Mathematical Properties.
-After adding this signal on TradingView, you will get notified every of potential long and short points triggered by the indicator.
-This signal alerts you anytime bars form a bullish or bearish pattern and price start to move in the suggested direction.
-It works in any time frame or market like Forex, Crypto, Commodities even Stocks.
-Recommended for bots or manual trading.
Do you need an Script or an expert adviser for Forex, contact our coding service
Get this indicator today! contact us

Premium 2-This algorithm takes in consideration Media averages, Volatility Movements, trend direction and other Mathematical Properties.
-After adding this signal on TradingView, you will get notified every of potential long and short points triggered by the indicator.
-This signal alerts you anytime bars form a bullish or bearish pattern and price start to move in the suggested direction.
-It works in any time frame or market like Forex, Crypto, Commodities even Stocks.
-Recommended for bots or manual trading.
Do you need an Script or an expert adviser for Forex, contact our coding service: coding@verticaltraders.io
Get this indicator today! contact us

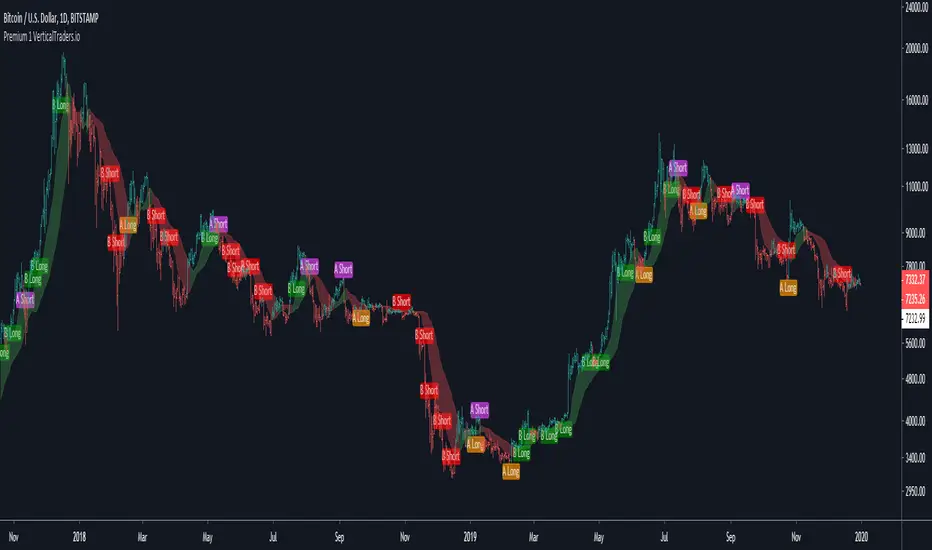
Premium 1-This algorithm takes in consideration Media averages, Volatility Movements and other Mathematical Properties.
-After adding this signal on TradingView, you will get notified every of potential long and short points triggered by the indicator.
-This signal alerts you anytime bars form a bullish or bearish pattern and price start to move in the suggested direction.
-It works in any time frame or market like Forex, Crypto, Commodities even Stocks.
-Recommended for bots or manual trading.
Do you need an Script or an expert adviser for Forex, contact our coding service:
Get this indicator today! contact us
UMMLMurray math with options to calculate wicks for readjusting of "Frame" ,mtf support to select desired period lines without switching time frames, Fractal and mtf fractal support ,option to keep just extreme deviations, UMML expands and contracts differently than similar scripts in volatile periods and are easily configurable by users for size,style and reactivity of lines
previous version hosted in link below
The Grid
indicator isnt finished yet as smoothening for line expansion and contractions is still being worked on alongside function to average the lines for short-median-long tf in MTF grid mode
SpiralSwinger V1.0After 2 months of work i finally managed to complete a usable version of godmode-based signal indicator for BTC trading only - SpiralSwinger is dedicated for longer term trades as it works better on Hourly Timeframes. No repainting observed after candle close. All numerical settings are customized after fine tuning by me and are locked by purpose since i believe there are so many of variables that giving access to them will most probably spoil the algo.
It includes:
1. 3 categories of signals based on their possibility to work out and RR outcome - Safe, regular and risky entries.
2. Shows regular divergences between the last 60 candles.
3. Shows overbought/oversold levels by the means of 4color-coding scheme wich is handy for quick evaluating of buyer's/seller's strength.
4. Shows longterm godmode trend sentiment as color "snowflake" chars above candles.
5. Shows ADX-ATR based stop loss line which acts as a first take profit point when price crosses it.
6. Shows ATR based second take profit line which.
7. Shows signals for additional profit taking when price is observed to behave anomalous.
8. Alerts included: Long, Short, Set SL in Profit, Possible Signal Prediction warning, Take Profit
There are quite many aspects of using this indicator and will explain them later. For a time being it's access is restricted to a limited number of people i will invite to test it on a practice. When bugs will be found and removed, additional features added and all documentation written how to properly use it will start adding people. Thanks for patience and support.

Poseidon - [Swing High Low][Support and Resistance][Reversal]...A great indicator with tons of usages for technical analysis
Act as:
* Support and Resistance (It can be used as breakouts only if you drag the line manualy, it will never break it by itself)
* Swing points
* Reversal point (The candle will reverse in 90% in cases)
* Tops and Bottoms (It finds highest and lowest points)
... and many more TA for strategies
Combined with RSI will give even better overview of the chart
Play with values till you find what your needs are
The bigger value is, the more accurate points will be
(There is no such as magic indicators, you need to do your job, you need to know what are you doing before enter in real life!)
Cheers!
@Zekis


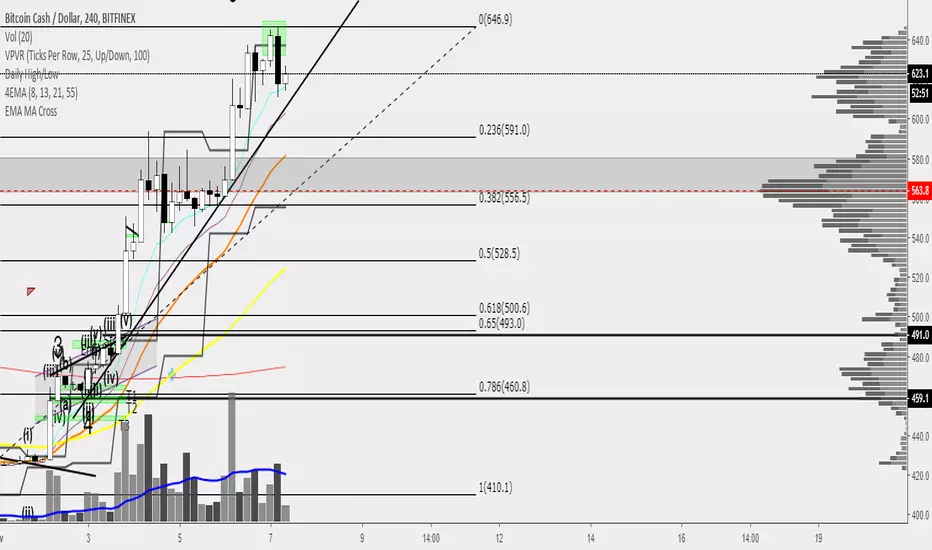
55EMA 200MA Cross Philakone Swing StrategyBased on the lessons of Philakone when we see the golden cross its a buy signal when we see the second cross this means death cross sell signal.
Nemesis Swing High Low Support/Resistance Pivot Points by ZekisNemesis Swing High Low Support and Resistance Pivot Points Channel
An indicator that project support and resistance, highs and lows and pivot points
There are a lot of strategies where it can be used, a little google or youtube search for more infos
I colored with black the channel and green when the price breaks the resistance and red when breaks the support for a better view
Values for support and resistance can be adjusted
*Soon i will add alerts for breakeouts
Enjoy!
@ Zekis

Hades Indicator by ZekisHades Indicator is a good swing indicator based on trends
The base of Hades Indicator is calculated from crossing of two moving averages to establish the trend and another two moving averages for entries and exits or longs and shorts.
The rules are simple: go long when background turns green and exit when turns yellow and go short when backgroun turns red and exit when turns yellow
When background is yellow is not a good idea to jump in
There are 5 moving averages to choose from: DEMA, EMA, SMA, VWMA and WMA
Also you can choose to trade only for Longs, only for Shorts or both
Alerts are added
Enjoy!
@ Zekis

Dionysus Indicator by ZekisDionysus is a good swing indicator with nice results in any timeframe
Easy to use, you need to adjust the lenght for your needs
Percentlines added for Take Profits and Stop Loss for best results (you can change them as you wish)
Yellow line is the transition from long to shot or entries and exits points
Alerts are enabled
Enjoy!
@ Zekis

Swing IndicatorV 1.0
This indicator shows the previous high and low price for trader who using Swing as trading strategy
Options:
Change counts of left bar and right bar for finding High|Low
Change source of Price for finding High|Low
Select plot or not plot some data on the chart
Guide for colors and shapes:
Green diamond show the previous high swing
Red diamond show the previous low swing
Label up and down with number show the previous High or Low (Green is High and Red is Low)
Note: For use this script, you can favorite it and then apply to any chart.

Top 10 Forex Swing Screener V 1.0
Top 10 Forex Swing Screener
Options:
Left-bars and Right-bars look back to find Top | Bottom point.
Set Alarm: After add script on your chart, click on add alarm and select the scrip name below your chart symbol, then select alarm you need and add.
Guide for colors and shapes:
Green: Price Cross Over high swing.
Red: Price Cross Under low swing.
Orange: Price Cross Over low swing or Price Cross Under high swing.
Green Triangle Up: pivot High in symbol.
Red Triangle Down: pivot Low in symbol.
Note: The script operates independently of the chart you in. for use this script, you can favorite it and then apply to any chart.
