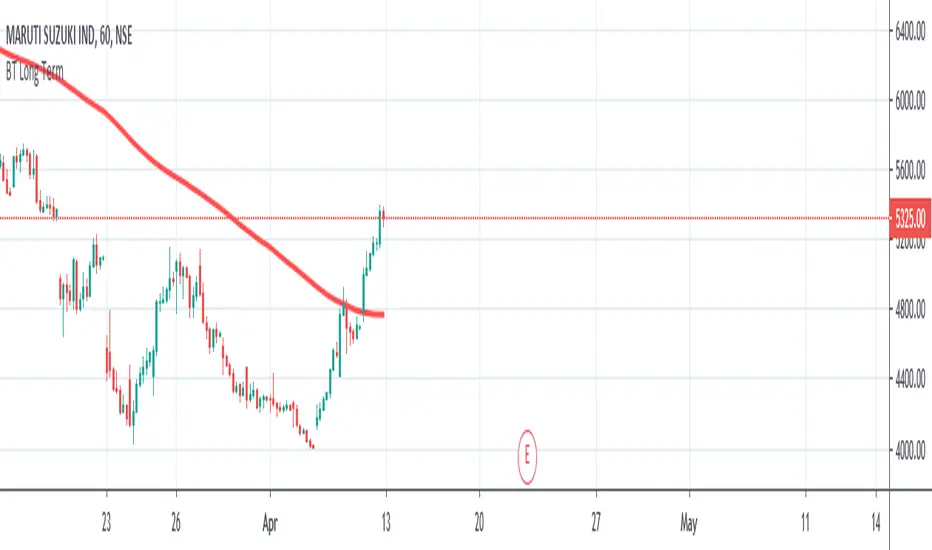
Long Term Smart Money ExpertLong Term Smart Money Expert is quick guide indicator for long term trade or swing trade
It has used 35 moving average, 90 moving average and 200 moving average
Plotted lines are average value of 35 MA and 90 MA and 35 MA and 200 MA
Buy Signal generates on 35 MA crossover
Sell Signal Generates on 35 MA crossunder
This indicator needs Trend Lines +++ for better performance
Swing
swing high low extension multi time frame MTFThis is the Multi time frame MTF version of our swing high low extension indicator.
Now you can use this indicator to plot the swing high low extension lines from higher time frames on current chart.
For example, if you input 60 as the Timeframe and your current chart timeframe is 5 minute, it will plot 60 minutes swing high low extension lines on the 5 minute chart.
Features and inputs:
Using different input value for swing high strength and swing low strength.
Input higher time frame by number as minute, such as 120 means 2 hours. You can also use 35, 100 or 48.
Set different type of alerts:
Close crosses below the swing low.
Close crosses above the swing high.
Close is above the swing high.
Close is below the swing low.
Please purchase the indicator access from our website.

Mionne LongShort Swing ViewThis is a Beta Version from a LongShort Swing View
Inspired by CryptoAman better know as ACEACEACE
At the moment it based on a 5 min. Chart
Shows possible Entrys and Exits from Longs on 5 Minutes Swings

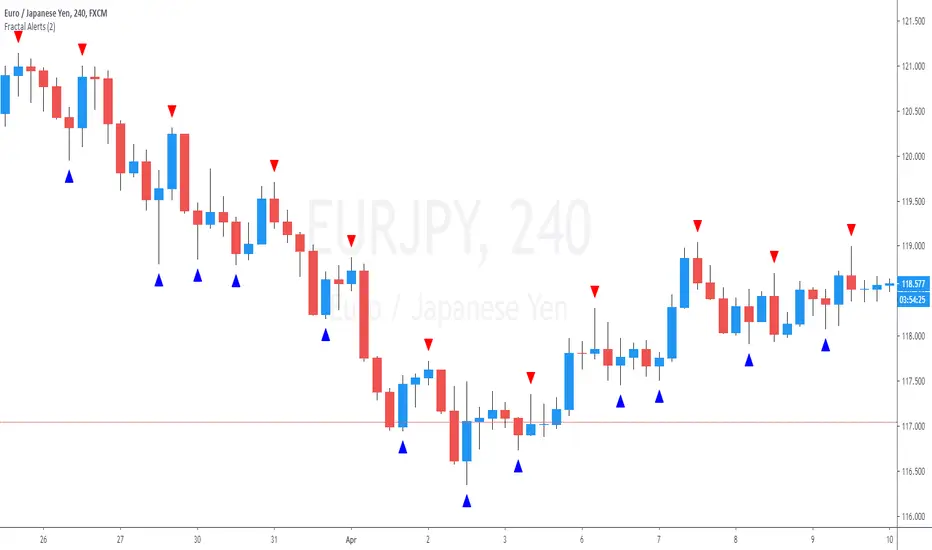
Fractals With Alerts For SwingsThis is a Fractals script with the capacity to provide alerts when two candles have completed after the swing point.
The alert can be placed after the swing point has been identified on a 3 candle formation and alerts when the a 5 candle formation is complete, ie; two closed candles after the swing point
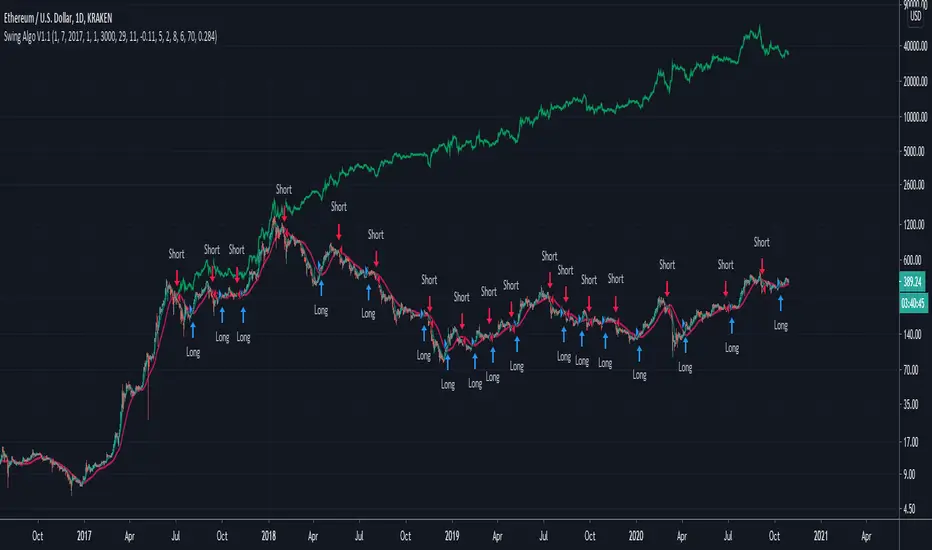
Swing Algo V1.1Here I present an upgrade to 'Swing Algo V1'. For differences to V1, see below.
This indicator can be used for e.g. swing algorithmic trading. It will give Buy/Long and Sell/Short signals on the chart. This algorithm uses a combination of several (custom) functions and rules to find good entry points for trend trading. After many iterations and tests I came up with this particular setup, which is highly optimized for the $ETH/$USD trading pair on the daily (D) timeframe. It is however possible to change algorithmic parameters within the indicator settings to tune this swing algorithm for other assets and timeframes. You don't need any programming skills or similar abilities to navigate this indicator.
Also you can choose the backtest time interval to test the perfomance of this algorithm for different time windows and different trading pairs. Here various backtesting parameters (e.g. trading fees) can be customized. Additionally to the TradingView Strategy Tester you can also plot your equity directly on the chart to get a sense for the performance. For this you can also scale the equity graph to e.g. match the starting point of your equity with some price point on the chart to get a direct comparison to 'Buy & Hold' strategies over time.
Note: In general it seems that cryptocurrencies are rather swing-algorithm-friendly, while I cannot recommend trading classical assets like stock or indices (e.g. S&P 500) with this indicator (although you can of course try to find good setups).
This indicator (and all other content I provide) is no financial advice. If you use this indicator you agree to my Terms and Conditions which can be found on my Twitter profile linked on my TradingView profile or in my signature.
Differences to Swing Algo V1:
- Changed the oscillator part of the algorithm with a better suited one (at least) for the ETH/USD trading pair.
- Improved net profits by roughly 20% in comparison to V1 for ETH/USD on daily timeframe
- Reduced Max. Drawdown by roughly 1/4 in comparison to V1 for ETH/USD on daily timeframe
- However for other assets and timeframes V1 might perform better than V1.1. I leave you with both options to play so that you can find the best solution for a given trading pair.
For access please contact me via DM on TradingView or on Twitter (linked on my TradingView profile and my signature). People who purchased access to any 'Swing Algo 1.x' get access to all other 'Swing Algo V1.x' indicators automatically ('Swing Algo V1' counts as 'Swing Algo V1.0').
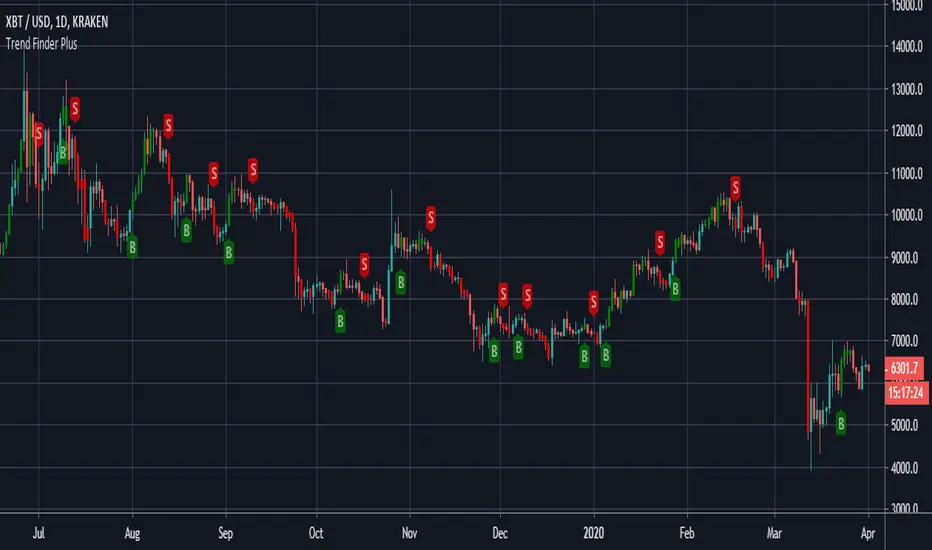
Trend Finder Plus - theCrypster===========
Trend Finder Plus
===========
A combination of various trend analysis techniques - MA's, pivotal breakouts, and Stochastics - Combined to make one super handy indicator!
-----------
Editable settings include a custom "Trend Finder" length and the usual settings for utilizing a "Stochastic RSI" .
This is a really useful tool for catching the very start of potentially bigger swings and movements - but it can get easily and display false signals during choppy periods - use with other indicators for a true sense of what can be achieved with this.
Good Luck and Happy Trading!
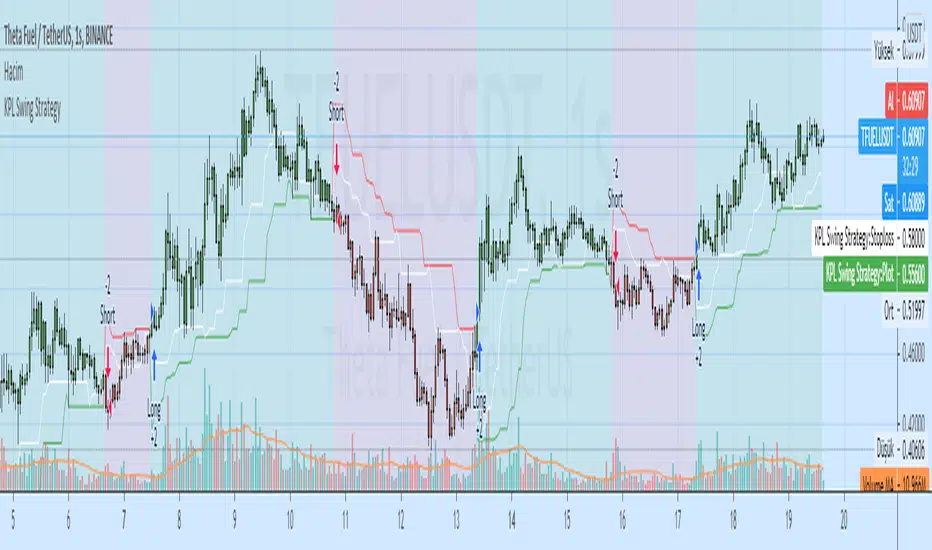
KPL Swing StrategyThe KPLSwing indicator is a simple trend following mechanical trading system which automates the entry and exit.
The trading system is extremely simple and easy to use and removes emotions from trading.
The trading or investing logic is simple.... buy on close above 20 days high and sell on close below 20 days low.
No targets are given as profits are unknown and is whatever the market gives. Losses are limited via position sizing.
CuandoCrypto's Swing Trade IndicatorThis indicator combines RSI, MACD, Williams %R and Z-Score to determine if there's a high probability of an imminent trend reversal. This indicator is best used on higher timeframes.
Bullyena SignalsWhat is Bullyena Signals?
-It is an indicator that aids the trader in making entry/exit decisions.
-Note that this is optimized for swing traders but you can also use this for scalping.
-The algorithm contains multiple modern indicators and some of them are proprietary.
Bullyena Signals usage:
-Gives entry/exit signals
-Shows the trend of the price using a bar color overlay.
-Shows trailing stops
-Shows buy/long and take profit signals
-Ichimoku cloud for trend confirmation
Installation
- For candlestacks, make sure to Right click > Settings > Symbol > disable wicks and borders.
Access and Documentation
- Message or PM me to know how to get access

BreakBreak
The idea of this indicator is to show the price trend, the pivot-based control points and possible Long and short trades.
The pivot points create levels of support and resistance, if the price breaks the resistance means that the price is bullish, if the price breaks the supports means that the price is bearish.
It shows the highs and lows based on pivot points, showing HH LH HL LL depending on the previous pivots.
A better confirmation for an uptrend is to expect higher high (HH) and then a Higher Low (HL), and for a downtrend expect Lower Low (LL) and then a Lower High (LH).
When the price breaks a previous high or low level, a signal will be triggered in that direction, it is also possible to filter these signals with a ribbon of moving averages, you can choose up to 14 different types of MA's.

Market StructureMarket Structure
The Market Structure is important to be able to establish areas of rejection or possible break,
to determine channels, points of possible reversals or trend breaks.
So we can use them as support and resistance zones for stoploss and take profit.
- This indicator will automatically show the market structure.
- Allows you to calculate the levels with the closing of the candles as well as with the highs and lows
- You can change the number of levels on the screen with the intensity adjustment
- Extended levels are shown as well as at the end of the graph to avoid noise when making technical analysis
- Visually you can modify the style, color, thickness of the level lines
- This indicator is multi-time, so you can check the structure of other temporalities, for example see the levels corresponding to 1D while the graph is H4
- Green lines are the resitance levels and red lines are support levels, these will automatically change color according to the current price
BTC 1W
EURUSD 1W
ETHUSDT 1D

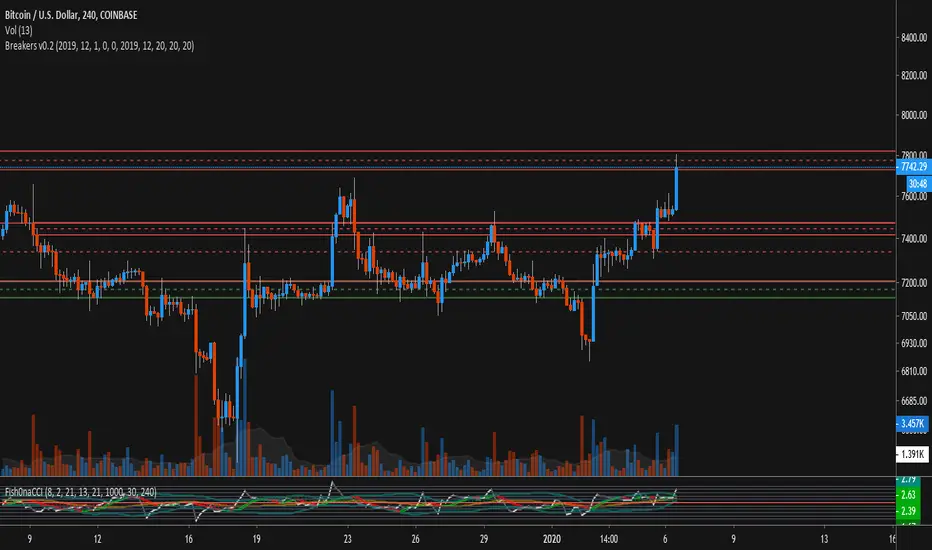
bg_Breakers_orderBlocks_detection (Breakers)Version 0.1
Using Pivots / Swing Point detection, this script plots the final swing candle's body span from top to bottom with an extended horizontal line, with a mid-channel point at 50% between open and close.
Once the trend changes, these zones serve as support and resistance zones, and can help identify breakouts from ranges and probable reversal points moving forward.
To avoid clutter, the script allows you to select a specific date-range (start / end date) which the rule will only apply and plot for.
Other customizable options are the length in bars of the pivot/swing point detection, which is defaulted at 20 bars for both highs and lows.
Works best on time-frames 4H, 1D, etc. with some luck to be had in occasionally shorter time-frames as shown above.
4H:
[STRATEGY] Jurik RSXA private strategy from the Profitable Jurik RSX preview for backtesting purposes.

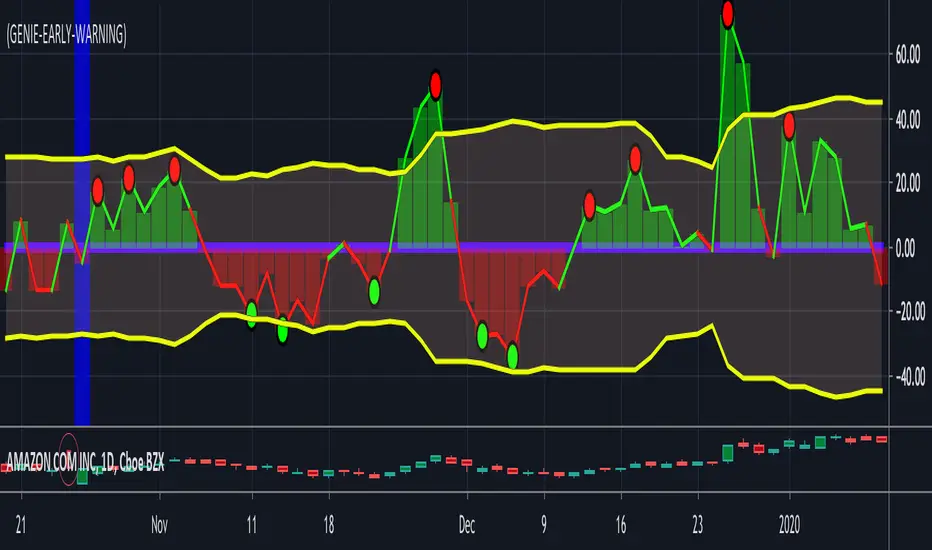
(4) Early Warning System VS-606The early warning system is constructed by converting a short alpha-length Laguerre filter into a normalized, horizontal line. This line is then placed into a chart on the zero axis. The calculation underpinning this line is identical to that produced by a moving filter or traditional moving average. Each current bar’s succeeding data is incorporated into the indicator’s updated calculation, but the visual output is plotted on a horizontal centerline that remains static. The current close is then subtracted from the normalized Laguerre filter, allowing the trader to visualize exactly what the difference is between the most current Laguerre filter’s value and the close of the most recent candle or bar. To put this in another way, the columns indicate how far away the close of the day is from the most current value the Laguerre moving filter calculation is producing. This enables the trader to immediately visualize and gauge the beginning, middle, and end of each parabolic swing, clearly exposing diversion/reversion overreactions in both directions, creating insightful entry/exit opportunities.
The Early Warning Indicator produces a foundation, enabling the production of an extremely effective swing trading system, effectively generating meaningful signals when a stock is loosely tracking, or swinging above and below a short-term Laguerre filter or moving average. The greater the volatility of these swings, the more precise the indicator becomes, increasing both accuracy and profit opportunities. The added implementation of the standard deviation of root mean square to the EWS flags, signals, that have a very high likelihood or reversing. The Early Warning System was first published in the journal of Technical Analysis of Stocks and Commodities: Aug 2017 by Michael slattery.
Access this Genie indicator for your Tradingview account, through our web site. (Links Below) This will provide you with additional educational information and reference articles, videos, input and setting options and trading strategies this indicator excels in.
SWING DELTAThis will show the price change between the high/low of each candlestick as an oscillator with configurable options to show Long/Short or both.

[astropark] Crypto Swing Trading [strategy]Dear Followers,
today a Swing Trading Strategy , runnable on a bot , which works great from 30m timeframe and above. Best suggested timeframes are 1h and 4h.
If you are a scalper, you will love suggested entries for fast profit. You can run it from 1 minute timeframe if you are used to scalp trading and close each trade whenever you fell happy (a proper trailing stop strategy is suggested anyway).
This strategy can trigger till 5 or 20 buy or sell signals in a row before reverting (it changes greatly depending on timeframe you use), so use a proper money management .
Strategy results are calculated on the timeframe from January 2018 to now, so on about 2 years, using 10000$ as initial capital and working at 3x leverage (very safe leverage!).
This is not the "Holy Grail", so use a proper risk management strategy.
This script will let you backtest this script.
The alarms version of this indicator, which will let you set all notifications you may need in order to be alerted on each triggered signals, can be found by searching for "Crypto Swing Trading" and then choosing the "alarms" version.
This is a premium indicator , so send me a private message in order to get access to this script.

SWING TRADER PRO V4 swing trading script currently scalper available
Long = buy signal
Short = sell signal
Use ema's for the stoploss once price goes above or below these ema's
best use on 1 hour
orange bar color indicates overbought
lime bar color indicates oversold
you can also add alerts for signals

Multi MA MTFMulti MA MTF
The moving averages are generally used as dynamic supports and resistances as well as to determine the trend,
so if the price is above its average it is called an uptrend and otherwise a downtrend.
The crossing of MA if used to confirm a trend and not as a signal
because the moving averages react slowly depending on the type of MA and the periods we are analyzing.
Indicator Functions:
- It allows to display 4 MA at the same time.
- You can use several types of moving averages: SMA, EMA, DEMA, WMA, VWMA, HullMA, TMA, SSMA, SMMA.
- Shows the crossing points of the MA's.
- Multimeframe: so you can visualize the behavior of MA's in different timeframes without changing timeframe.
- Alerts for when crosses occur.
Same chart with 1 week timeframe MA enable

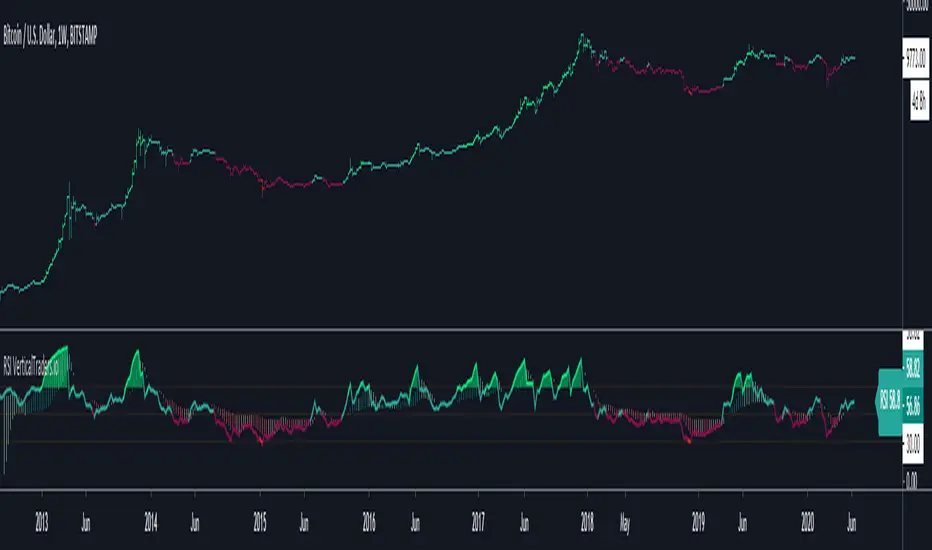
Stochastic RSIStochastic RSI
It is generally used to generate signals when crossings are made in overbought or oversold areas,
but it is important to take advantage of these signals according to the general trend, in this way we avoid false signals.
Overbought doesn't necessarily mean the price will reverse lower, just like oversold doesn't mean the price will reverse higher.
Rather the overbought and oversold conditions simply alert traders that the RSI is near the extremes of its recent readings.
So the main idea will be to use the signals as long as we are trending in the same direction,
the other crosses will be used as signals to take profits or as warning signs to check our trades.
Extra functions in this indicator:
- Trend background.
- Long and Short Labels base on trend and take profit warnings.
- Alerts for long and short entries and take profit warnings.
Take Profit / Warning Labels enable (Orange)

Heiken AshiHeikin Ashi charts are similar to candle charts, but the main difference is that a Heikin Ashi chart uses daily price averages to show the movement of the average price of an asset.
The idea is to use the heikin Ashi technique as an indicator and not as the main chart, to avoid enter or exist the market too late.
Key concepts:
- The averaged open and close help filter some of the market noise, creating a chart that tends to highlight the trend direction better than typical candlestick charts.
- The downside is that some price data is lost with averaging. The most recent price (close) may not reflect the actual price of the asset, which could affect risk.
- Long down candles with little upper shadow represent strong selling pressure. Long up candles with small or no lower shadows signal strong buying pressure.
Extra functions in this indicator:
- Trend Bar indicator, uptrend(green), downtred(red), warning or indecision (yellow).
- Long and Short Labels base on trend and Heikin Ashi entries.
- Change the color of the main chart Candlesticks as the Heikin Ashi indicators.
- Alerts for long and short entries.
- Size of Labels.
Bollinger BandsBollinger bands are calculated from a moving average, creating two curves that involve the price chart, these bands are defined by a standard deviation generally of value 2 with respect to the moving average.
Applications:
- They show the volatility of the market, when the bands are compressed, the volatility decreases, when the bands extend, the volatility increases.
- Trend, with respect to the moving average according to the location of the price corresponding to the positive or negative standard deviation.
Extra functions in this indicator:
- You can use several types of moving averages for the calculation: SMA, EMA, DEMA, TEMA, WMA, VWMA, HullMA, TMA, SMMA, SSMA, etc.
- Background: Shows the zone equivalent to a standard deviation of 1 and 2 with different color.
- Log chart: It can be used on logarithmic price scales, to avoid distortions in those charts.
- Multimeframe: so you can visualize the behavior in different timeframes without changing timeframe.
- Interpolation: Round the curves when viewing larger timeframes.
Multitimeframe example: 1D, select timeframe to Bollinger bands 1W and log chart
Same chart with interpolation

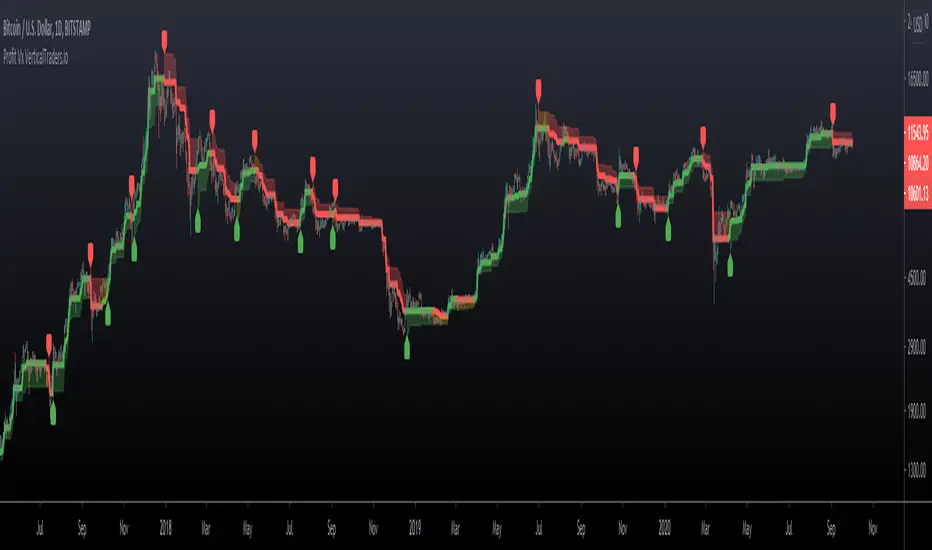
Profit VxProfit Vx
- Labels for Long and Short entries
- Take Profit point base on %
- Candlestick color, orange is warning or not trending zone