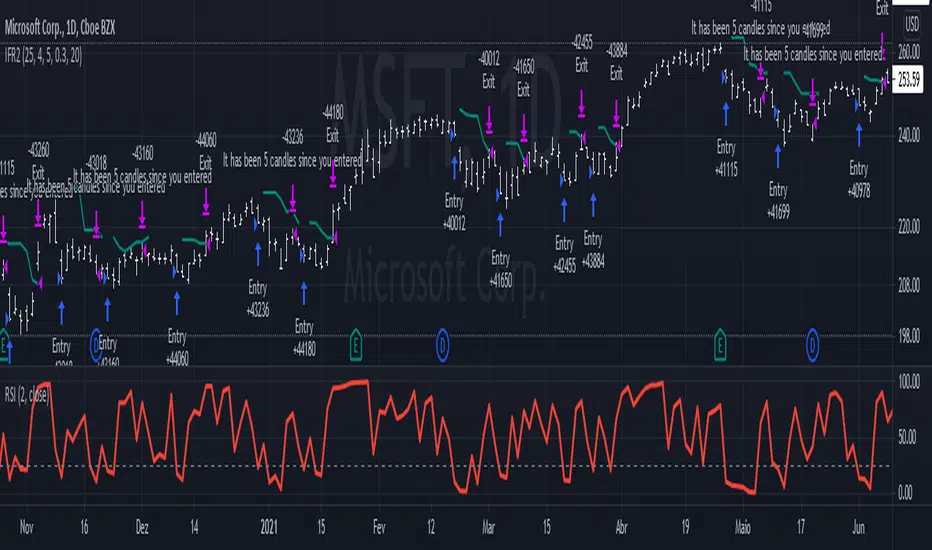
IFR2The IFR2 strategy is based on the RSI indicator.
If the two period RSI is less than the overbought level (25 is the default, but you can configure it to be lower), a long position is placed at the close of the candle. If you are doing it live, you'd have to enter the market ~ 10 minutes before it closes, check the RSI, and buy if it is lower than your overbought level. This generates a discrepancy in the backtesting, but since it is a very small difference, it can be disregarded. Higher overbought levels generate more signals, but they mostly are unreliable. Lower values generates better yields, but they won't occur very often. This strategy is designed to be used in a daily graph, and I don't recommend using it in intraday periods, since you'll make too little money to compensate for the operational cost.
The strategy exits when the high price of two previous candles is reached. If the exit price is higher than the closing price of when you entered, you'll be at a profit, otherwise you'll be at a loss. The exit price is plotted in the graph and it's colors depends on the current open profit: positive values will be green, negative will be red.
This strategy completely disregards the current trend. Long orders will be placed even if you are at a strong down trend. This may seem odd, but you have to keep in mind that this is a volatility based strategy , not a trend following one.
This setup was designed by Alexandre Wolwacz, a.k.a. Stormer.
Swingtrading
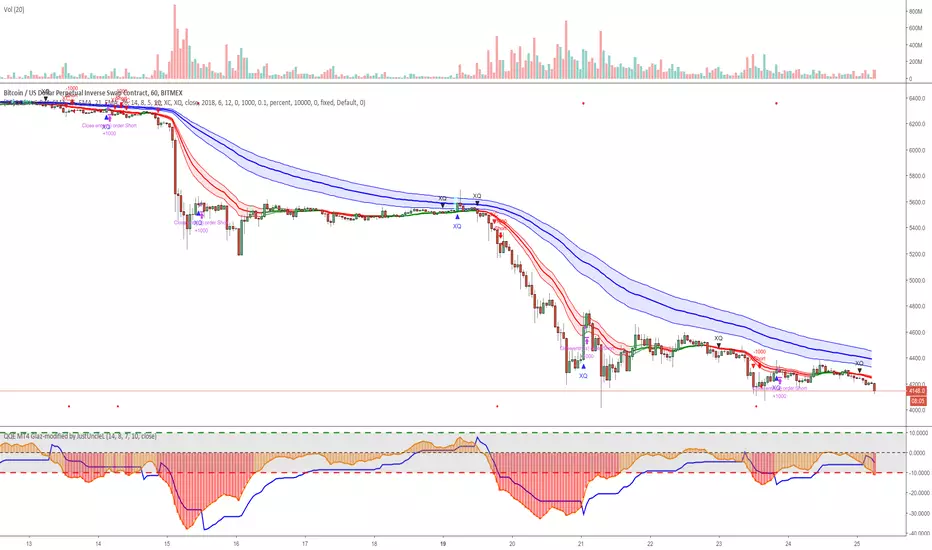
Simple and efficient PSAR swing strategyThis is a strategy build inside tradingview, which I found it works great with swing/position trading.
It works based on parabolic sar indicator, when indicator is below the candle, is an uptrend and when its its above is a downtrend.
At the same time it's very nice, because it has a sort of stop loss which is dynamic, because it triggers when candle crosses with indicator, so you dont have to worry about stop loss or take profit .
The key here of course, is going to be the risk management, if you want to success with it, never trade more than 2% of you capital, and if you want you can always apply a rule inside the code to close all position if x % amount of equity was going down, although I recommend have patience and let the system do its job.
I recommend this strategy to be used with charts like 1 day or 1 week. If you need and want I can convert it to an indicator that uses alerts (although with strategy as well can be made to send alerts).
PS. When you add this strategy on chart, inside is has different versions, if you use first version(1), it uses the system I explain above. If you use the last one, its based on risk management when the stop loss is the difference between psar and the candle, but it still needs some adjustments to make.
Overall first one is atm much more profitable, but I believe that the version with risk management can be much better, but it need much more adjustments to make which I dont have the time at the moment for it.
Enjoy it .

Full strategy AllinOne with risk management MACD RSI PSAR ATR MAHey, I am glad to present you one of the strategies where I put a lot of time in it.
This strategy can be adapted to all type of timecharts like scalping, daytrading or swing.
The context is the next one :
First we have the ATR to calculate our TP/SL points. At the same time we have another rule once we enter(we enter based on % risk from total equity, in this example 1%, at the same time, lowest ammount for this example is 0.1 lots, but can be modified to 0.01), so we can exit both by tp/sl points, or by losing 1% of our equity or winning 1% of our total equity. It's dinamic.
The strategy is made from
Trend direction :
PSAR
First confirmation point :
Crossover between 10EMA and Bollinger bands middle point
Second confirmation
MACD histogram
Third confirmation
RSI overbought/oversold levels
For entries : we check trend with psar, then once ema cross bb middle point, we confirm together with rsi level for overbought/oversold and macd histogram ( > 0 or <0).
We exit, when we have opposite sign, like from buy to sell or sell to buy, or when we reach tp/sl points, or when we reach % basaed equity points.
It can be changed to be fixed lots, or fixed tp/sl , you just have to uncomment the size from entries, and tp/sl lines.
At the same time, it has the possibility if one desires, to trade only concrete forex session like european, asian and so on for intraday trading.
Hope you enjoy it.
Let me know how it goes.

Trend trader StrategyFirst I would like to thank to @JustUncleL since this strategy started from one of his scalper strategies
This strategy can be adapted to all time charts .
First it has the session where we want to trade, for this example I choosed the EURUSD so I only take in consideration london/neywork session.
Its made from 3 EMA :
normal
slow
ultra slow
It has has the capacity to use HA candles into consideration if its needed.
At the same time we have a price channel made from faster MAs, that act like a bollinger band .
Together with all of them, we establish which trend we have if its uptrend or downtrend
Then we check the candles if they are below or above the MA , and based on the condition if they crossed recently we can suggest if its a buy or a long condition
At the same time we have 2 options of stop conditions:
Through a trailing stop made from ATR or % based
And second, a SL/TP made from pip points or % based.
For this example I used % based.
Let me know what you think about it, and if you found some nice settings for it. So far I only adapted to EURUSD 1 min time.

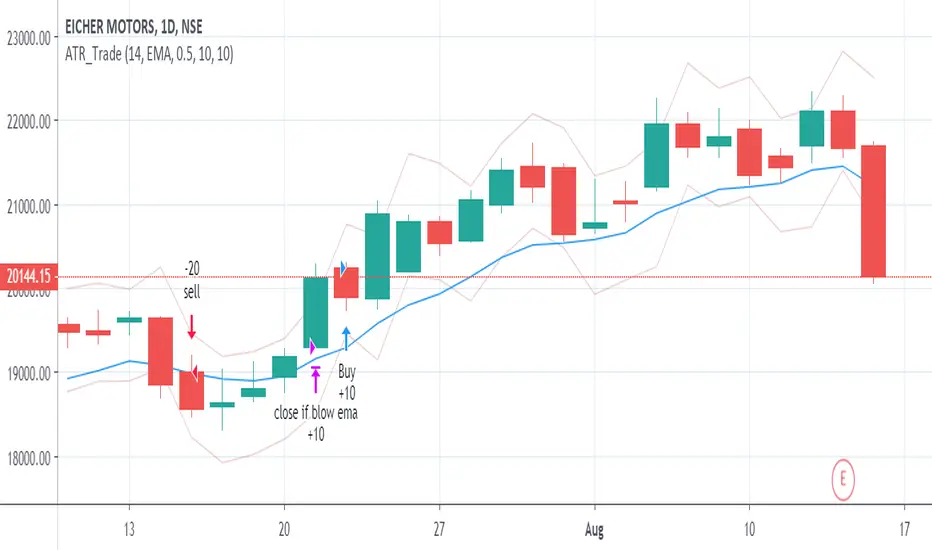
ATR_Trade_strategyATR Based Strategy
Identify the ATR range on Daily Chart.
ATR HIGH= Previous Close +ATR
ATR Low =Previous Close - ATR
Long when Close is above ATR High
Short when Close is below ATR Low
Exit when close moves below EMA(10) OR
a user-selected max loss
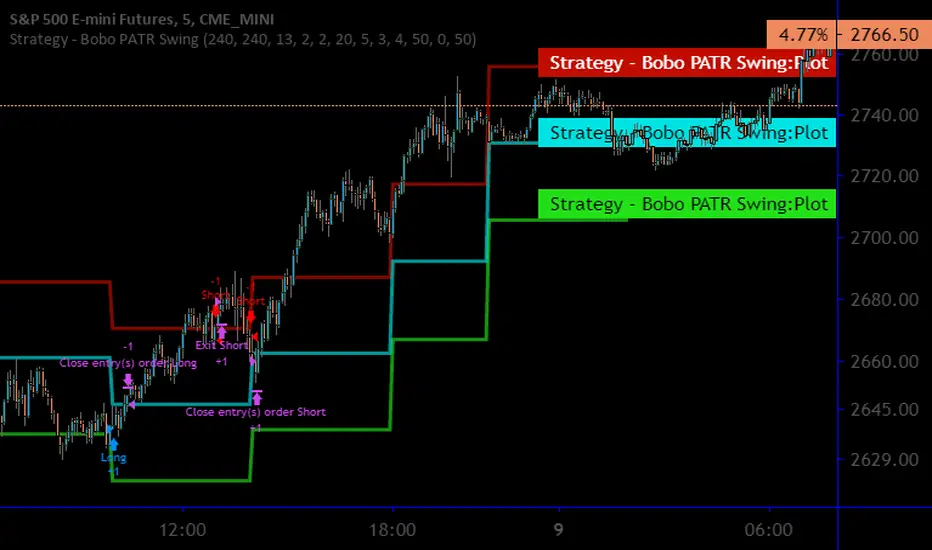
Strategy - Bobo Intraday Swing Bot with filtersThis is an adapted version of my swing bot with additional filters that mean it works quite well on lower timeframes like 1min, 5 mins as long as you adjust the setting accordingly (reduce pivot timescale, band width)
Entry conditions are filtered by an invisible trend calculation running in the background so the bot doesn't repeatedly try and fail to fade a strong trend. It has just about everything you should need for basic use, stop losses and targets, automatically close trade at pivot.
I get good results on rangey instruments like major indices such as SPX / ES that kind of thing. Make sure you understand the minmum tick value of an index so the stop setting on the bot work properly
Hope it's useful!
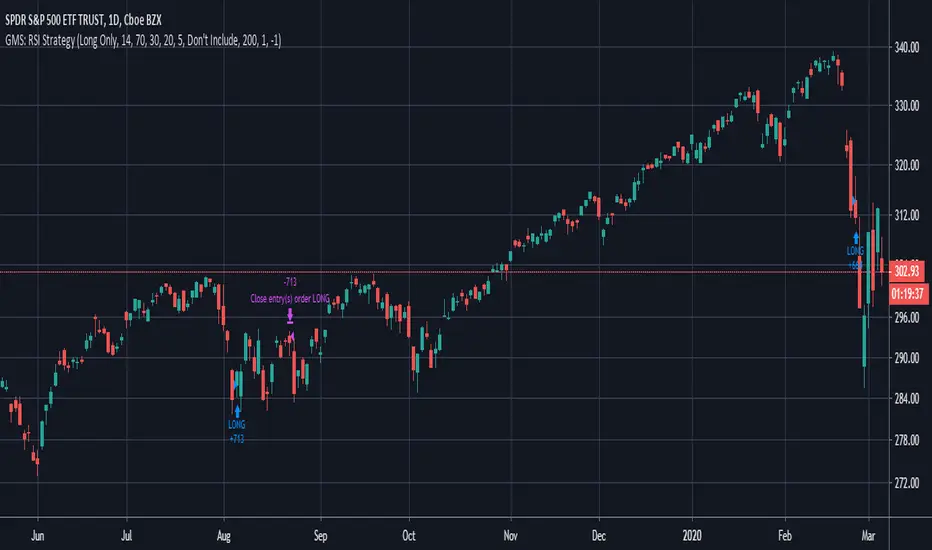
GMS: RSI StrategyThis is just a basic RSI strategy that it easy to use and quite comprehensive so you can quickly test out an idea based on RSI.
- I made it comprehensive in that you can select long, short, or both.
- There is a simple moving average trend filter. You can filter for trades above, below, or don't include it at all.
- The exit is based on a simple moving average.
The source code should be open if you want to see it or modify it for your own project. I hope it helps!
Andre
Global Market Signals
Donchain BreakoutIt is a long only strategy.
1. Buy when price breaks out of the upper band.
2. Exit has two options. Option 1 allows you to exit using lower band. Option 2 allows you to exit using basis line.
3. Slippage and commissions are not considered in the return calculation.


Investing - Weekly EMA's mapped to Daily ChartWhen there isn't enough time in your day to day-trade, yet you want to utilise all the technical analysis skills you have... why not make a long term investing or swing trading indicator set to help you along the way!
So I did....
When it comes to long term investing and swing trading, I often find the weekly 12/26/52 EMA's do a great job in capturing the main market swings from bull to bear.
However, I like to use the Daily chart to see the candle patterns and shapes with more detail and divergences often show up better on the daily chart.
So I have decided to combine the two!
I have basically taken the EMA 12/26/52 from the weekly and transferred them over to the daily (mathematically they are not exact, but for me they are close enough).
I have also developed a simple scale in / scale out strategy for using these exponential moving averages. It isn't as simple as buying in on each signal, however I use my own special strategy to take advantage of the alerts.
Enjoy!

[Backtest]QQE Cross v6.0 by JustUncleLDescription:
This is the Backtest version of the " QQE Cross v6.0 by JustUncleL" Tool, can be used to optimize settings.
Mean-Reversion Swing Trading Strategy v1A port of the TradeStation EasyLanguage code for a mean-revision strategy described at
traders.com
"In “Mean-Reversion Swing Trading,” which appeared in the December 2016 issue of STOCKS & COMMODITIES, author Ken Calhoun
describes a trading methodology where the trader attempts to enter an existing trend after there has been a pullback.
He suggests looking for 50% pullbacks in strong trends and waiting for price to move back in the direction of the trend
before entering the trade."
See Also:
- 9 Mistakes Quants Make that Cause Backtests to Lie (blog.quantopian.com)
- When Backtests Meet Reality (financial-hacker.com)
- Why MT4 backtesting does not work (www.stevehopwoodforex.com)

SPY Master v1.0This is a simple swing trading algorithm that uses a fast RSI-EMA to trigger buy/cover signals and a slow RSI-EMA to trigger sell/short signals for SPY, an xchange-traded fund for the S&P 500.
The idea behind this strategy follows the premise that most profitable momentum trades usually occur during periods when price is trending up or down. Periods of flat price actions are usually where most unprofitable trades occur. Because we cannot predict exactly when trending periods will occur, the algorithm basically bets money on all trade opportunities during all market conditions. Despite an accuracy rate of only 40%, the algorithm's asymmetric risk/reward profile allows the average winner to be 2x the average loser. The end result is a positive (profitable) net payout.
TRADING RULES:
Buy/Cover = EMA3(RSI2) cross> 50
Sell/Short = EMA5(RSI2) cross< 50
BACKTEST SETTINGS:
- Period = March 2011 - Present
- Initial capital = $10,000
- Dividends excluded
- Trading costs excluded
PERFORMANCE COMPARISON:
There are 657 trades, which means 1,314 orders. Assuming each order costs $2 (what I pay for at Interactive Brokers), total trading costs should be $2,628.
-SPY (buy & hold) = 132.73 ---> 193.22 = +45.57% (dividends excluded)
-SPY Master v1.0 = $12,649 - $2,628 = $10,021 = +100.21%
DISCLAIMER: None of my ideas and posts are investment advice. Past performance is not an indication of future results. This strategy was constructed with the benefit of hindsight and its future performance cannot be guaranteed.

Forex Master (EUR/USD)ATTENTION:
This is a symmetrical algorithm designed only for trading EUR/USD on the 1h time frame. For other currency pairs and time frames, you need to re-calibrate the RSI-EMAs as well as the profit targets and stop losses.
BACKTEST CONDITIONS:
Initial equity = $100,000 (no leverage)
Order size = 100% of equity
Pyramiding = disabled
TRADING RULES:
Long entry = EMA20(RSI10) cross> 50
Profit limit = 50 pips
Stop loss = 50 pips
Short entry = EMA30(RSI30) cross< 50
Profit limit = 50 pips
Stop loss = 50 pips
Long entry = Short exit
Short entry = long exit
DISCLAIMER: None of my ideas and posts are investment advice. Past performance is not an indication of future results. This strategy was constructed with the benefit of hindsight and its future performance cannot be guaranteed.
