VWAP/EMA50/EMA200We script this one for combining VWAP , EMA50 and EMA200. The tool is fantastic if traders know how VWAP , EMA work? Just adding this script in your favorite and work like charm:
VWAP: How to trade with that
- One of the simplest uses of the VWAP is gauging support and/or resistance.
- A trader who is long a stock can use the VWAP as a target exit if its trading below.
- A stock trading over intraday VWAP may be bullish , while a stock trading under may be bearish .
EMA 50/EMA200: How to trade with that timeframe 50-day or 200-day period
- Identify the trend of market in longterm
- Golden-cross (short term EMA cross above longterm EMA ) is call golden-cross signals. It is opportunity for buying.
- Deal-cross ( short term EMA cross below longterm EMA ) is call dead-cross signals. It is opportunity for selling.
- Identify support levels
- Identify resistance levels
Let me know if you see anything else that should be added/changed.
System

Moving Averages System - DurbtradeMoving Averages System - Durbtrade
1 indicator... customizable.
Displays up to 4 independent Moving Averages (MA's) at once.
Each MA can be 1 of 6 "MA Types" : SMA, EMA, WMA, VWMA, HMA, or DEMA.
There are 7 individual fills...
4 "MA/Source Fills" and 3 "MA/MA Fills".
The "Source" is selectable,
and there is a "Source Plot" option
to display a plot of the source.
No max value for MA "Length".
Each MA has what I call a "Length Multiplier",
and each MA has its own "Offset".
The colors of each MA,
as well as the Source Plot,
can be up/down "Color-Changing", or solid.
"Line Thickness" is unlimited.
Each of the 3 "MA/MA Fills" allow you to select which 2 of the 4 MA's to fill between!
All 7 fills are customizable by above/below colors, and opacity.
All 7 fills include a "Color Swap" option,
in the case that you need to switch the display of the above-color to the below-color,
and the below-color to the above-color!
All plots are scripted to be drawn visually in front of all fills!
Lastly, you can turn off the display of the MA plots and the Source Plot...
allowing the display of only fills!
--------------------------------------------
--------------------------------------------
Let's take a more detailed look!
First, let's go through the settings, and how to use the Moving Averages System.
You can divide the Inputs tab of the indicator settings into 3 main sections...
1 - Moving Averages
2 - Source Plot, and MA/Source Fills
3 - MA/MA fills
Let's discuss the first section, which is where we set up our MA's.
Here, we see the parameters for our 4 Moving Averages :
All 4 MA's can be customized here in the following ways...
- Toggle ON/OFF by checking the checkbox
- Length
- Length Multiplier
- Type (SMA, EMA, WMA, VWMA, HMA, or DEMA)
- Up/Down Color Change ON/OFF
- Line Thickness
- Offset
(The Plot Styles, Up/Down/Solid Colors, and Opacities of all 4 MA's
are customizable under the Style tab of the indicator settings)
There are no maximum value limitations for Length, Line Thickness, and Offset.
Of note, the "Length Multiplier" multiplies the "Length" value by a chosen integer.
This can be used to incrementally scan a wide spectrum of lengths very quickly.
Or it can be used to maintain ratios while increasing the MA display lengths...
just multiply all lengths by the same number.
It can also be used to easily create a moving average ribbon
by using multiple Moving Average Systems all at once.
Or, it can be another method to set up higher-timeframe MA's on a lower-timeframe chart...
for example, if both the chart and indicator are on the 1Hour timeframe,
you can multiply all of your set lengths by 24
to see the 1Day MA's of those same lengths on the 1Hour chart.
Next, lets look at the second section of the Inputs tab of the indicator settings,
where we edit the "Source Plot" and "MA/Source Fills".
We can turn ON/OFF the "Source Plot" -
which plots a line of the "Source" that you have selected -
and edit the parameters :
Checking the "Source Plot" box turns the "Source Plot" ON/OFF.
You can turn Up/Down Color Change ON/OFF,
and adjust Line Thickness and Offset.
(The Plot Style, Up/Down/Solid Colors, and all Opacities of the Source Plot
are customizable under the Style tab of the indicator settings.)
Next is where you can turn ON/OFF and edit each "MA/Source Fill".
Checking the "MA#1/Source Fill" box turns on the fill between MA#1 and the source.
You can choose the color and opacity for the above-color and the below-color.
Need to switch the display of the two colors?... turn on "Color Swap" to easily do just that.
The remaining 3 MA/Source Fills work in the same exact way...
turning on a fill between the associated MA#, and the source.
In total, there are 4 MA/Source Fills... 1 for each MA.
Note that neither the Source Plot, nor any of the MA's, need to be turned on
in order to use the MA/Source Fills.
Finally, lets look at the third section of the Inputs tab of the indicator settings.
This is where we can edit the 3 "MA/MA Fills".
An MA/MA Fill allows you to select any 2 of the 4 MA's that you have set,
and fill the space between them with color :
Checking the MA/MA Fill box turns ON/OFF the associated MA/MA Fill.
Below each ON/OFF switch are 2 boxes where you can select the 2 MA's that you want to fill between.
Select the 2 MA's that you want to use according to their MA#'s.
Next, you have the Above/Below Color/Opacity for the associated MA/MA Fill,
and lastly, the Color Swap option.
The numerical order of the MA#'s that you select here is of no concern,
because each MA/MA Fill has that "Color Swap" option...
and, as before, this swaps the display of the above-color and the below-color.
Note that the MA's do not need to be turned on
in order to use the MA/MA Fills.
--------------------------------------------
Additional Notes :
All colors and opacities of this indicator can be customized.
All fills can have above/below colors, and all plots can have up/down colors.
All fills and plots can be one static color, too.
All plots can be 1 of 10 plot styles:
Line, Line with Breaks, Step Line, Step Line with Diamonds, Histogram,
Cross, Area, Area with Breaks, Columns, or Circles.
All plots use the same single "Source", which is selectable.
And don't forget... you can try applying this indicator to other indicators!
--------------------------------------------
Now, let's take a look at some examples of the Durbtrade Moving Averages System in action!
All 4 MA's plots on, MA Type is SMA, color-changing on, lengths 50, 100, 150, and 200 :
Add the Source Plot, and all 4 MA/Source Fills :
Add the 3 MA/MA fills :
Turn off candles visibility, and turn off MA color-change :
Turn off the MA plots :
Turn off the Source Plot :
...
Here are some other images using the Multi Moving Average Tool :
Here it is on the 1Second :
Here it is on the 3Day :
Here is your 1Day SMA DeathCross :
Use 3 Moving Average Systems at once to build your own EMA Ribbon :
Compare 4 different MA types, all with the same length :
--------------------------------------------
Script Stats :
Pinescript Version : 5
Code Length : 149 Lines
Total Plots : 16
- Visible Plots : 5 (4 MA Plots, 1 Source Plot)
- Invisible Plots : 11 (4 MA Plots, 1 Source Plot, 6 MA/MA Fill Plots)
Total Fills : 7 (4 MA/Source Fills, 3 MA/MA Fills)
Total Colors/Opacities : 29
Total Unique Variables : 92
- Input Variables : 69
- Unique Output Variables : 23
--------------------------------------------
Final Thoughts :
I'm excited to share the Durbtrade Moving Averages System!
I think that this indicator has a wide range of MA-related applications,
an easy-to-use interface with maximum customization, and unique fill features...
all in one indicator.
I feel that it is a quick and useful tool
whether you are just plotting a few moving averages...
or you are creating intense kaleidoscopic tidal waves of colored data!
Either way, I think it is pretty awesome,
and so, I wanted to share it with you...
I hope that you enjoy it and find it useful!
- Please feel free to comment your thoughts, critiques, or suggestions. They are all very helpful!
- Also, please feel free to comment any positive feedback, or awesome screencaps/ideas of the indicator in action!
- Check out my other Pinescript indicators if you like this one... they work well together.
- I hope that you find this script useful.
- Enjoy!
--------------------------------------------
// Durbtrade
ConsensioThis indicator is based on Consensio strategy.
Green = 100% Bullish,
Yellow = 75%-90% Bullish,
Orange = 30%-75% Bullish,
Red = 100% Cash Position
1-4 Green candles = Bullish trend momentum (4 is stronger)
1-4 Red candles = Bearish trend momentum (4 is stronger)
INDIGO - Cloud System ©INDIGO Cloud System ©
This script shows the monthly dip and peak zones and the daily highs & lows.
The green zone is the dip zone. It's the place to enter a long position if you think there is or will be a reversal.
The red zone is the peak zone. It's the place to enter a short position if you think there is or will be a reversal.
The script uses the INDIGO Cloud System ©, the Ultimate RSI and the Market Direction Indicator to find an entry at the most optimal point in space and time.
The exit for the long trade is on the purple line and the exit for the short trade is on the blue line.
It also has an RSI exit to minimize the risk of a sudden reversal in the wrong direction while in trade.
You can set TP and SL to see the effects of it on the chart. Be aware that these change a lot of trades so use it wisely.
The labels are connected to alerts to notify you of a possible entry or exit.
This script uses the Ultimate RSI by ChrisMoody, thanks for creating this Chris !
This script also uses the Market Direction Indicator by LazyBear, great script !
You can use the MD Filter to filter out some bad trades. It decreases losses but also some profits.
Experiment with the settings, each pairing needs different settings.
--> Use this script at your own risk. Do your own research, never invest money you're not willing to lose and never put your trust in one indicator !
To my best knowledge this script doesn't repaint. I never use the close and only use high/low when value can't be untrue again. If you find repainting in this script PLEASE let me know !
Feel free to contact me for questions or feedback.
Enjoy the script :)

HPH's SuperKeltnerThis indicator combines the Supertrend (to determine the main trend direction) with two Keltner channels (used for add and take profit signals) to construct a trend trading system.
These are the available settings:
General
UseTrendChange ➞ toggle trend change alerts and labels
UseAdds ➞ toggle add to position alerts and labels
UseTakeProfits ➞ toggle take profit alerts and labels
PrematureAdds ➞ toggle adding to position as soon as the add channels are left (default is false, so the add signal will only fire once the channels are re-entered)
PrematureTakeProfits ➞ toggle taking profit as soon as the tp channels are left (default is false, so the tp signal will only fire once the channels are re-entered)
Visualization
Show Add Keltner ➞ toggle display of the channels used for adding to the position
Show TP Keltner ➞ toggle display of the channels used for taking profit
Show SuperTrend ➞ toggle display of the Supertrend
Keltner
Standard Keltner channels settings except for the fact that there are two different multipliers. The Keltner TP Multiplier should generally be bigger than the Keltner Add Multiplier , as the channels are hit differently in trending markets. I recommend you to use the visualization settings to show the channels and adjust the settings to your liking.
Supertrend
Standard Supertrend settings, nothing to add here.
Alerts
Use the alert messages to customize what alert text the indicator will send. This makes it possible to use the script to automate trading bots.
By default, the alerts are sent after the candle has closed. This ensures that no repainting is happening. If you like the risk, you can toggle the corresponding WaitFor Confirmation if you wish to receive the signals earlier (max. once per bar).
Enjoy!

NVME TP & SL systemNVME TP and SL system is an ATR based risk management tool that is designed to identify possible stop loss and take profit points for you to follow depending on the volume generated by the average true range. Sometimes, they zones may be really close together and this often occurs during a ranging period of the market where there is little movement and this can be fixed if you increase the values on the settings. Moreover, you can input your entry price and what position you are looking for such as a short or a long and then the indicator will generate some zones for you to follow too. The zones will not update after every bar close but instead follow the main setting of bar reset period where the indicator will generate new zones if x bars has passed, default is 20.
Features:
3 Take profit zones ( all customisable: colour, atr multiplier, display toggle on and off )
1 Stop Loss Zone ( all customisable: colour, atr multiplier, display toggle on and off )
Custom Position (Long or Short)
Custom Entry Point (Up to 9 decimal places)

Impact Zones - Skylyne InvestingWhat is the Impact Zone system:
The creation of Impact Zones started with our love for trading the Bond Market. Impact Zones were originally specifically tailored for the Bond market and now have been mastered to capture most of the Asset Classes out in the market today (Please look at Impact Zone Settings section for asset classes covered by this script). The Impact Zone system is a zone break (or market level break) following system with specific take profit points already established for you on the open of the market day (depending on your asset timing will vary).
*This script was designed for Intraday Trading, Long term or Swing Trading is not recommended with this system
The script will create buy and sell signals on the break of the Impact Zones when specific criteria is met along with the break of the zone. You do not have to use only our signals provided, you can also create your own trading rules based on our script.
Items to highlight:
Skylyne Upper Zone: Green Zone
Skylyne Middle: Yellow Line
Skylyne Lower Zone: Red Zone
Skylyne Take Profit Lines: Purple Lines
Skylyne Average: Orange Line (dynamic support/resistance)
Skylyne Overnight Session: Dark Blue (No Trade Zones)
Skylyne Signals: Buy / Sell
You can think of the Upper Zone as a bull zone and Lower zone as a bear zone, when price enters these zones we want to start watching price action to determine direction the market will take on the break or specified zone, whether it be a break and reversal or a break and run. This can be confirmed with either our signals (buy & sell) or the use of the dynamic support and resistance line (Skylyne Average).
Our script is written to capture market zones and place then on your screen with ease, we also have programmed in specific take profits and stop loss levels we have found the market respects on the intraday trading based on the Impact Zone captured.
The Impact Zones and Take Profit Levels change at Market open everyday. The levels provided will stay on your chart until the next Market open where the Impact Zones and Levels will change to accommodate that trading Day.
We recommend only using that trading days levels, however; using past levels can help trades depending on the case
The three Trades we want to highlight are:
1. Break of Impact Zones
a. This trade is taken when a break of the impact zone happens either in the positive or negative direction and traded to the next zone or take profit line (stop losses can be set with zones or the dynamic skylyne average crossovers)
2. Break of Skylyne Average
a. This trade is taken when price action confirms a bullish or bearish bias on the break of the average line (we would close this trade on the reverse break of the Skylyne Average using the zones as targets)
3. Break of the Skylyne Mid:
a. This trade is taken when a break of the Skylyne Mid level occurs and we use the upper and lower bounds of the Impact Zones as take profit and stop losses
Impact Zone Settings:
*Trading Category and Overnight Category must match the Asset Class being viewed on chart for accurate signals
1. Trading Category
a. Bonds
b. Corn/Wheat
c. Stocks
d. Index Futures
e. Euro/Dollar
f. Gold/Silver
2. Overnight Category
a. Bonds
b. Corn/Wheat
c. Stocks
d. Index Futures
e. Euro/Dollar
f. Gold/Silver
3. Chart Aggregation Limit (Default Value is 25 minutes)
Impact Zone Overnight Trading:
Impact Zone Overnight sessions are highlighted in a dark blue color and we use these highlighted time sessions as a NO TRADE session. Our system was built to be traded during normal market trading hours and overnight sessions tend to be less predictive in terms of direction and or zone reliance. If you choose to trade overnight sessions with Impact Zones, make sure you make a very in depth trading plan and stick to the rules set for yourself.
Impact Zone Signals:
1. Signals for buy or sell of the asset class happen on breaks of the Impact Zones, and when specific criteria are met that we determined necessary to evaluate the overall trend of the market
2. Not every break of the Impact Zones will trigger a signal
3. No signal will be generated during overnight sessions, we recommend studying overnight sessions before beginning to create your own overnight trading session plans based on Impact Zones
4. When a signal is generated you will use the next take profit line (purple line) in the direction of your trade you are in. Other trading signals were discussed above
5. If while you are in a trade and the skylyne average (orange line) is broke in the opposite direction of your trade you will take this as a dynamic stop, and in some cases a dynamic take profit
Impact Zone Charting Timeframes:
1. Recommendation of using the 1 minute chart aggregation bars to maximize profits and limit losses
2. The script has a default charting aggregation limit of 25 minutes, adjustments to the input (in the settings) to increase the aggregation limit need to be made in order to use higher than 25 minute timeframes
Charting Example:
First note is to notice how our publish example uses the 1-minute timeframe aggregation, this is because our script was written to maximize profit on the 1 minute time frame. The script can be used on any time frame, however; make sure that you increase the aggregation limit input when using timeframes above 25 minutes.
From the chart included in the script post, you can notice that buy and sell signals happen only when specified criteria is met, and not every time there is a crossover of the Impact Zones there is a signal. You do not only have to trade the buy and sell signals that our system provides, however; our team believes that these signals are one of the best ways to trade the Impact Zone script. If you deviate from only using signals provided and choose to use the Impact Zones differently, we recommend using the next level, or zone, in the direction of your trade as your take profit (As described in trade we want to highlight section)

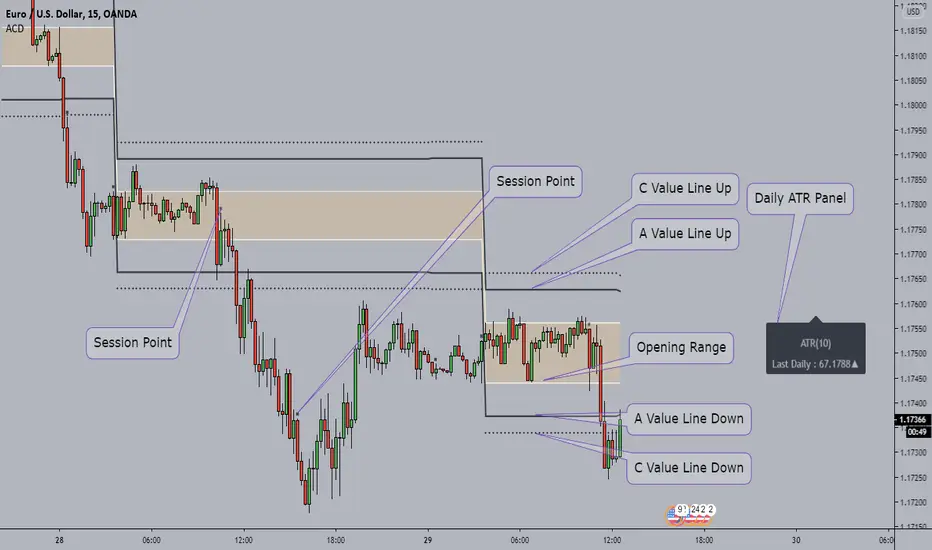
ACD - Fisher's Methodology(Manual Sessions & Values)ACD - Fisher's Methodology(Manual Sessions & Values)
Version 1.00
Created by TWA_TradeWithAmir(TWA_PriceActionTips)
Updated 10/14/2020
Based On Mark B. Fisher's ACD Methodology
* Open the Indicator only in GMT+0(UTC+0)
* You Can Change the Session with First Parameter in input
* Run Indicator with Session Breaks for better view
* Do not change the Session Values(Session Periods)
* Enjoy!
Fractal Trend Trading System [DW]This is an advanced utility that uses fractal dimension and trend information to generate useful insights about price activity and potential trade signals.
In this script, my Advanced FDI algorithm is used to estimate the fractal dimension of the dataset over a user defined period.
Fractal dimension, unlike spatial or topological dimension, measures how complexity or detail in an "object" changes as its unit of measurement changes, rather than the number of axes it occupies.
Many forms of time series data (seismic data, ECG data, financial data, etc.) have been theoretically shown to have limited fractal properties.
Consequently, we can estimate the fractal dimension from this data to get an approximate measure of how rough or convoluted the data stream is.
Financial data's fractal dimension is limited to between 1 and 2, so it can also be used to roughly approximate the Hurst Exponent by the relationship H = 2 - D.
When D=1.5, data statistically behaves like a random walk. D above 1.5 can be considered more rough or "mean reverting" due to the increase in complexity of the series.
D below 1.5 can be considered more prone to trending due to the decrease in complexity of the series.
In this script, you are given the option to apply my Band Shelf EQ algorithm to the dataset before estimating dimension.
This enables you to transform your data and observe how its newly measured complexity changes the outputs.
Whether you want to give emphasis to some frequencies, isolate specific bands, or completely alter the shape of your waveform, EQ filtration makes for an interesting experience.
The default EQ preset in this script removes the low shelf, then attenuates low end and high end oscillations.
The dominant cyclical components (bands 3 - 5 on default settings) are passed at 100%, keeping emphasis on 8 to 64 sample per cycle oscillations.
The estimated dimension is then used to calculate the High Dimension Zone and the Error Bands.
Both of these components are great for analyzing trends and for estimating support and resistance values.
The High Dimension Zone is composed of a high line, low line, and midline that update their values when D is at or above the user defined zone activation threshold.
The zone is then averaged over a user defined amount of updates and zone width is multiplied by a user defined value.
The Error Bands are composed of a high, low, and middle band that are calculated using an error adjusted adaptive filter algorithm that utilizes dimension as the smoothing constant modulator.
The basis filter for the error bands has two calculation types built in:
-> MA - Calculates the filters as adaptive moving averages modulated by D.
-> WAP - Calculates the filters as adaptive weighted average prices modulated by D.
The WAP starting point can be based on the High Dimension Zone being moved or a user defined interval.
You can also define the WAP's minimum and maximum periods for additional control of the initial and decayed sensitivity states.
The alpha (smoothing constant) modulator can be fine tuned using the designated dimension thresholds.
When D is at or below the low dimension threshold, the filter is most responsive, and vice-versa for the high dimension threshold.
Alpha is then multiplied by a user defined amount for additional control of sensitivity.
Band width is then multiplied by a user defined value.
A Hull transformation can be optionally performed on the zone averaging and band filter algorithms as well, which will alter the frequency and phase responses at the cost of some overshoot.
This transformation is the same as a typical Hull equation, but with custom filters being used instead of WMA.
The calculated outputs are then used to gauge the trend for signal and color scheme calculations.
First, a dominant trend indication is selected from its designated dropdown tab.
The available built in indications to choose from are:
-> Band Trend (Outer) - Detects band breakouts and saves their direction to gauge trend.
-> Band Trend (Median) - Uses disparity between source and the band median to gauge trend.
-> Zone Trend (Expansion) - Detects when the high fractal zone expands and saves its direction to gauge trend.
-> Zone Trend (Outer Levels) - Detects zone breakouts and saves their direction to gauge trend.
-> Zone Trend (Median) - Uses disparity between source and the zone median to gauge trend.
Then the trend output is optionally filtered before triggering signals.
There are multiple trend filtration options built into this script that can be used individually or in unison:
-> Filter Trend With High Fractal Zone - Filters the trend using the specified zone level or combination of levels with either disparity or crossover conditions.
There is a set of options for bullish and bearish trends.
-> Filter Trend With Error Bands - Filters the trend using the specified band level or combination of levels with either disparity or crossover conditions.
There is a set of options for bullish and bearish trends.
-> Filter Trend With Band - Zone Disparity Condition - Filters the trend using the specified band level, zone level, and disparity direction.
There is a set of options for bullish and bearish trends.
-> Filter By Zone That Moves With The Trend - Filters the specified trend by detecting when the high fractal zone’s direction correlates.
-> Filter By Bands That Move With The Trend - Filters the specified trend by detecting when the error bands’ direction correlates.
-> Filter Using Wave Confirmation - Filters the specified trend by detecting when source is in a correlating wave with user defined length.
You can also choose separate lengths for bullish and bearish trends.
-> Filter By Bars With Decreasing Dimension - Filters the specified trend by detecting when fractal dimension is decreasing, suggesting source is approaching more linear movement.
The filtered trend output is then used to generate entry and exit signals.
There are multiple options included to fine tune how these signals behave.
For entries, you have the following options built in:
-> Limit Entry Dimension - Limits the range of dimensional values that are acceptable for entry with user defined thresholds.
This can be incredibly useful for filtering out entries taken when price is moving in a more complex pattern,
or when price is approaching a peak and you’re a little late to the party.
-> Enable Position Increase Signals - Enables more entry signals to fire up to a user defined number of times when a position is active.
This is helpful for those who incrementally increase their positions, or for those who want to see additional signals as reference.
-> Limit Number Of Consecutive Trades - Limits the number of consecutive trades that can be opened in a single direction to a user defined maximum.
This is especially useful for markets that only trend for brief durations.
By limiting the amount of trades you take in one direction, you have more control over your market exposure.
There is a set of these options for both bullish and bearish entries.
For exits, you have the following options built in:
-> Include Exit Signals From High Fractal Zone - Enables exit signals generated from either crossover or disparity conditions between price and a specified zone level.
-> Include Exit Signals From Error Bands - Enables exit signals generated from either crossover or disparity conditions between price and a specified zone level.
-> Include Inactive Trend Output For Exits - Triggers exit signals when the filtered trend output is an inactive value.
-> Dimension Target Exit Method - Triggers exit signals based on fractal dimension hitting a user defined threshold.
You can either choose for the exit to trigger instantly, or after dimension reverts from the target by a user specified amount.
-> Exit At Maximum Entry Dimension - Triggers exit signals when dimension exceeds the maximum entry limit.
-> Number Of Signals Required For 100% Exit - Controls the number of exit signals required to close the position.
You can also choose whether or not to include partial exits.
Enabling them will fire a partial signal when an exit occurs, but the position is not 100% closed.
Of course, there is a set of these options for bullish and bearish exits.
In my opinion, no system is complete without some sort of risk management protocol in place.
So in this script, bullish and bearish trades come equipped with optional protective SL and TP levels with signals.
The levels can be fixed or trailing, and are calculated with a user defined scale.
The available scales for SL and TP distances are ticks, pips, points, % of price, ATR, band range, zone range, or absolute numerical value.
Now what if you have some awesome signals of your own that you’d like to use in conjunction with this script?
Well good news. You can!
In addition to all of the customizable features built into the script, you can integrate your own signals into the system using the external data inputs and linking your script.
This adds a whole new layer of customization to the system.
With external signals, you can use your own custom dominant trend indication, filter the dominant trend, and trigger exits and protective stops using custom signals.
The signal input is an integer format. 1=Bull Signal, -1=Bear Signal, 2=Bull Exit, -2=Bear Exit, 3=Bull SL Hit, -3=Bear SL Hit, 4=Bull TP Hit, -4=Bear TP Hit.
You can also use the external input as a custom source value for either dimension or global sources to further tailor the system to your liking.
The color scheme in this script utilizes two custom gradients that can be chosen for bar and background colors:
-> Trend (Dominant or Filtered) - A polarized gradient that shows green scaled values for bullish trend and red scaled values for bearish trend.
The colors are brighter and more vibrant as perceived trend strength increases.
-> Dimension - A thermal gradient that shows cooler colors when dimension is higher, and hotter colors when dimension is lower.
Both color schemes are dependent on the designated dimension thresholds.
The script comes equipped with alerts for entries, additional entries, exits, partial exits, and protective stops so you can automate more and stare at your charts less.
And lastly, the script comes equipped with additional external outputs to further your analysis:
-> Entry And Exit Signals - Outputs in the same format as the external signal input with these additions: 5=Bull Increase, -5=Bear Increase, 6=Bull Reduce, -6=Bear Reduce.
You can use these to send to other scripts, including strategy types so you can backtest your performance on TV’s engine.
-> Dominant Trend - Outputs 1 for bullish and -1 for bearish. Can be used to send trend signals to another script.
I designed this tool with individuality in mind.
Every trader has a different situation. We trade on different schedules, markets, perspectives, etc.
Analytical systems of basically any type are very seldom (if ever) “one size fits all” and usually require a fair amount of modification to achieve desirable results.
That’s why this system is so freely customizable.
Your system should be flexible enough to be tailored to your analytical style, not the other way around.
When a system is limited in what you can control, it limits your experience, analytical potential, and possibly even profitability.
This is not your typical pre-set system. If you're looking for just another "buy, sell" script that requires minimal thought, look elsewhere.
If you’re ready to dive into a powerful technical system that allows you to tailor the experience to your style, welcome!
-----------------------------------------------------------------------------------------------------------------------------------------------------------------
This is a premium script, and access is granted on an invite-only basis.
To gain access, get a copy of the system overview, or for additional inquiries, send me a direct message.
I look forward to hearing from you!
-----------------------------------------------------------------------------------------------------------------------------------------------------------------
General Disclaimer:
Trading stocks, futures, Forex, options, ETFs, cryptocurrencies or any other financial instrument has large potential rewards, but also large potential risk.
You must be aware of the risks and be willing to accept them in order to invest in stocks, futures, Forex, options, ETFs or cryptocurrencies.
Don’t trade with money you can’t afford to lose.
This is neither a solicitation nor an offer to Buy/Sell stocks, futures, Forex, options, ETFs, cryptocurrencies or any other financial instrument.
No representation is being made that any account will or is likely to achieve profits or losses of any kind.
The past performance of any trading system or methodology is not necessarily indicative of future results.
NN Trading SystemThis indicator is an attempt to be all-in-one solution that follows the structure of NNFX Youtube channel. The components may vary from trader to trader. This is my compilation. If you have any ideas to make it better, let me know.
Brief Info about the structure:
The trader chooses best indicators for the positions described below; enters and exits positions strictly based on the consensus of the indicators. Here are components:
1. Baseline (trend line): I usually use "Regression Line" indicator that can be found in the public library. If the price is above the baseline, look for longs; if the price is below the baseline, look for shorts. This part cannot be included in this indicator since it needs the indicator to be an overlay indicator. So choose and couple with your own.
2. Entry Signal: This is the main indicator that signals opening positions. I tested lots of indicators and finally chose LazyBear's MACD Leader Indicator. This is the modified version of it. When the signal line crosses over the zero line, it's a long signal. When the signal line crosses under the zero line, it's a short signal. You may also use the peaks of the hills it creates as a signal if you think it performs better. It's up to you. I have added dots for the possible peaks using "alma" cross algorithm.
3. Confirmation Signal #1: To open a position both the confirmation signals need to give a green signal. otherwise you are not allowed to open the position. Chosen indicator for this job is ATR. Set your minimum ATR value on the settings box and if the current ATR on the current timeframe is below the ATR value, a gray line will be drawn over the entry signal line and you should not take the trade. If you are already have a position, this doesn't mean that you should close the position though. It just informs you that momentum is low. YOU NEED TO ADJUST THIS ATR LIMIT FOR EVERY ASSET AND TIMEFRAME YOU TRADE. For BTC 1min, my example limit value is 8. Find your best value.
4. Confirmation Signal #2: I have chosen Aroon indicator for trend confirmations. If the background of the indicator is green, it's suitable for longs, if it's red, it's suitable for shorts. If the color is brighter, that means the signal is stronger. Aroon is a very powerful indicator but you need to find the best settings for the timeframe you are using.
5. Exit Signal: This one is the hardest role to find an indicator for. The one i ended up choosing is "Relative Vigor Index". It doesn't give good entry signals but with the right settings, it works as an exit signal in my experience. This signal is drawn as a green and red boxes and the top and the bottom of the indicator area. If it changes color while you have a position, it's time to close the position. Find the right settings for it so that every time it signals reversal, you obey the rule and close the position.
To summarise, the components are:
* ATR
* MACDL
* ALMA CROSSOVER
* AROON
* RVGI
plus
* a trend line indicator of your choice added seperately to your chart.
My recommendation is to turn all the indicators off on the settings box and enable on by one finding the best values individually. If you found the best settings for an asset and timeframe, please share in the comments for others.
You may leave a comment for bug reports, feedback and suggestions.
Hope it works for you.
Cheers.

Moving Average Variable Kit W/ Alerts V3 [Moon]Create your own MA system
5 basic kinds of Moving Average types available for now
DEMA
EMA
SMA
TEMA
WMA
Mix and match moving average types and lengths.
Create your own alerts built into Tradingview.
Turn alerts or MAs off or on with 1 click.
Choose visual transparency and alert coloration - everything is customizable.
Trend candles on crossovers.
Choose your MA input source.
Create your own MA cloud or cloud ribbons.
Trend MA coloration on candle or bar interactions.
It really empowers you to experiment and create your own trading system or strategy.
Don't be afraid to use Renko or Heikin Ashi for trend spotting or reversals.
Copy built in exchange bands or indicators for an edge up on the competition or exchange users (these are heavily watched and in my opinion do affect the price action especially on smaller coins like alts).
This is Binance's default kit that you can easily make (7/25/99) SMAs.
Works well on traditional markets or Forex | Should be cross compatible on any asset or timeframe.
Turn off a majority of signals except for "buy" or "sell" alerts. Use these clusters to DCA, short, long or take profit.
Use it to monitor classic "Golden" or "Death" crosses - Set a TV alert to get a notification when it official goes off.
These are just a few of the things you can create. I encourage you to explore further.
Send me a DM if interested.
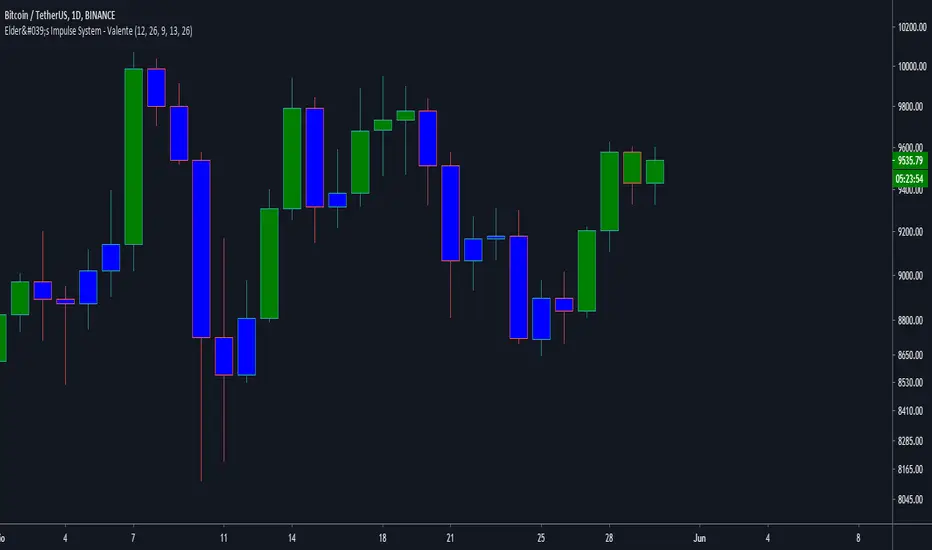
Elder's Impulse System with weekly EMA Filter - ValenteThis indicator was based on the Elders Impulse System by astraloverflow.
The only difference is that I included the weekly EMA26 as a filter and you can plot it on the graph if you want (unchecking the Weekly EMA26 won't turn the filter off, will only stop plotting it).
The indicator works this way:
When the MACD Histogram is growing UP, the EMA13 is pointing UP AND the Weekly EMA26 is pointing UP, the bar is Green
When the opposite is true, the bar is Red.
When any condition from both green and red is not true, the bar is blue.
In my opinion, this particular indicator works better on the D1 time frame. I recommended using the original one, by astraloverflow for other time frames.
I hope it is useful!
[GM ELITE] Dynamic - Setup AssistantAdditional Tool for Customers of Dynamic. Over 20 indicators built in. Separate Indicator windows to help setup GM Dynamic Algorithm. Toggle which indicator you want to view.

[GM ELITE] Dynamic_Introduction
This is the first of the GM ELITE indicator range. Designed for Algorithmic Traders looking to speed up their process of testing and optimizing their algorithm. This script contains an entire suite of indicators, that work together in unison to find optimal trade entries, based on NNFX rules. There are two versions of this script. One is a strategy and built in back-tester, and the other will update in real time designed for live trading and forward testing.
This script is for live trading/forward testing.
Entries/Exits
The System has 5 indicator slots, and the user can choose one indicator per slot
- Trend Confirmation Indicators to pick when the market has taken off
- Volume and volatility Indicators to determine the strength of the trend or whether the market is ranging.
- Moving Averages for trend bias
- Exit Indicators to signal when to get out!
Money Management
Dynamic allows you to choose your Stop Loss and Take Profit distance based on a multiplier x ATR.
Options to exit the whole trade at TP or at a signal from the exit indicator of your choosing.
Start and End times (Window) to backtest.
Forex - $EVZ
Euro Volatility FX Vix ( aka $EVZ) is built in. You can toggle a filter for low $EVZ or whether or not EVZ is above average. No signals will be given if EVZ is below threshold. EVZ is one of the best indicators of overall forex market volume and volatility .
Customization
Several visual and color customization options. Thousands of possible parameter combinations.
The "bias" or mode of the Confirmation Indicators appears at the top and bottom of the screen as horizontal rows of triangles.
For any two-line Indicator (eg MACD ) if the fast line is above the slow line, the triangles are green, other-wise, they are red.
For any "Level Cross" indicator, when the line is above the level, the triangles are green, otherwise, they are red.
The Arrows at the bottom of the screen determine whether or not there is sufficient volume

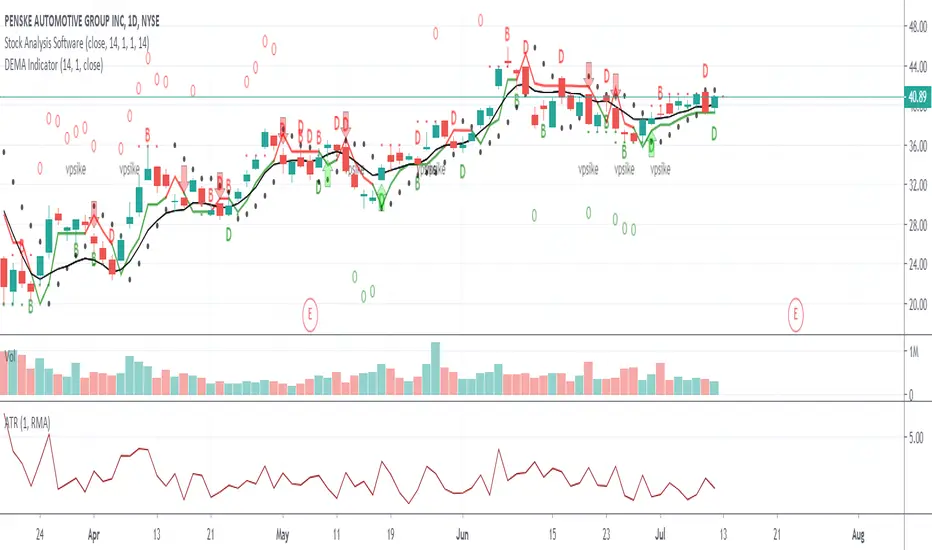
DEMA Indicator
The DEMA indicator is part of the stock analysis software trading system and will highlight on the chart when the moving average and candle are touching on a certain percent ratio. When the candle is GREEN and touching the moving average in the correct ratio it will show a GREEN D below the candle. If the candle is RED and it is touching the moving average in the correct ratio it will plot a RED D above the candle.
If you look at any of these charts you will see the red and green D's. The green D's below the green candles would signal a more bullish looking setup where as a red D would signal a more bearish looking setup.
This indicator is great when added to the complete system to look for entries but also exits. This indicator has been used by myself for many years as a trading professional.
Uber Baseline [UTS]Uber Baseline is a highly customizable Baseline component for any trading system. Different strategies can be applied making it a powerful tool for every trader.
General Usage
The Baseline is used as an indication of the prevailing trend and helps keeping the trader out of bad trades.
Price above the Baseline only allows for LONG trades and below Baseline only allows for SHORT trades.
On price cross upwards from below Baseline and and candle close above Baseline the movement can be considered as bullish. Controversy if price crosses Baseline downwards from above and and candle closes below the baseline the movement can be considered as bearish.
Hence, ENTRY Signals for LONG or SHORT can be derived from those Baseline crosses.
Furthermore, any Baseline cross can also be treated as valid EXIT signal for an open position as the movement indicates a possible shift in trend.
Price that moves with unusual high volatility into one direction often tends to not trend but instead pulls back. Overshoot of the base line (default setting: 1x ATR) is recognized but does not produce an ENRTY signal, only an EXIT signal.
Advanced techniques can incorporate the one-candle-rule waiting for pullbacks after Baseline overshot following a possible ENTRY in direction of the new trend.
Trend traders can also look for Baseline bounces after an ENTRY signal for confirmation and better trade entries.
Moving Averages
16 different Moving Averages are available:
ALMA (Arnaud Legoux Moving Average)
DEMA (Double Exponential Moving Average)
EMA (Exponential Moving Average)
FRAMA (Fractal Adaptive Moving Average)
HMA (Hull Moving Average)
JURIK (Jurik Moving Average)
KAMA (Kaufman Adaptive Moving Average)
Kijun (Kijun-sen / Tenkan-sen of Ichimoku)
LSMA (Least Square Moving Average)
RMA (Running Moving Average)
SMA (Simple Moving Average)
SuperSmoothed (Super Smoothed Moving Average)
TEMA (Triple Exponential Moving Average)
VWMA (Volume Weighted Moving Average)
WMA (Weighted Moving Average)
ZLEMA (Zero Lag Moving Average)
A freely determinable length allows for sensitivity adjustments that fits your own requirements.
Trend Visualization
If the predominant trend direction is DOWN the moving average is painted red. If the trend direction is UP the moving average is painted in green.
If the movement is FLAT then the color is gray.
Alerts
Traders can utilize the following signals to trigger alerts from:
Bull Cross
Bear Cross
Overshoot Up
Overshoot Down
Those values are > zero if a condition is triggered.
Alert condition example: "Bear Cross" - "GreaterThan" - "0"

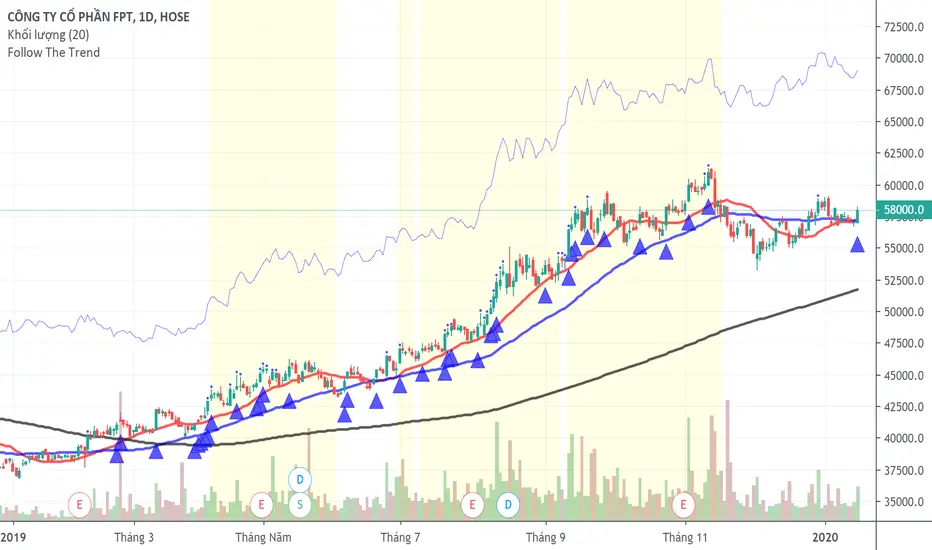
Follow The TrendFollow the trend system
The system uses MA20 as trailing stoploss and marks the strong trending area with color yellow.
This system only uses for stock and Long position.
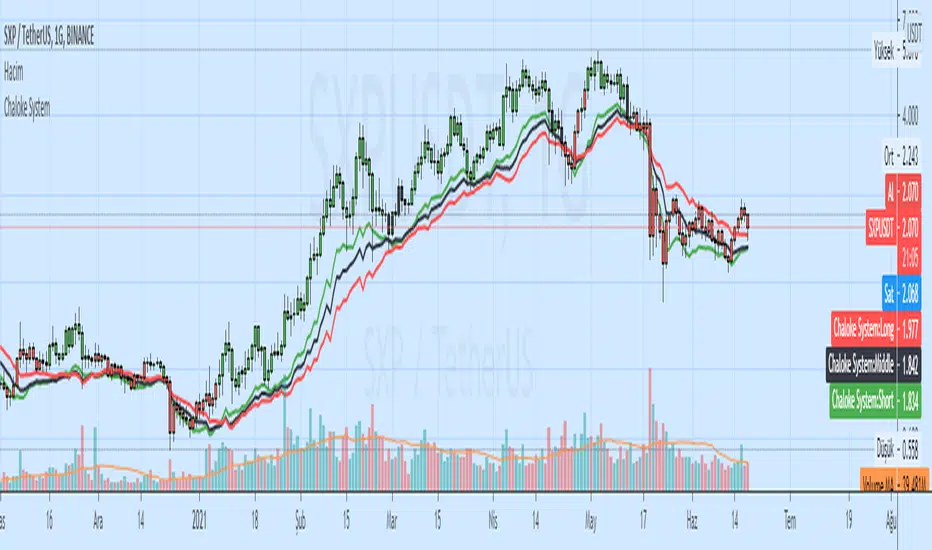
Chaloke SystemChaloke System
Buy=Short>Middle and Close > Short ,barcolor(green)
Sell=Close < Long or Short
Daily RangeHey traders,
at first thanks to the one and only Master Educator Stefan Kassing for sharing his legendary system with us!
And also credit to Mortdiggiddy , RootDuk and PineCoders for helping me with the script =)
This script is calculating the daily range (in pips) of the current market you are in, in relation to the last 70 days (10 weeks) .
It is used for a possible Take Profit in Stefan Kassing's System .
How to add the script to your chart:
1. Click " Add to Favorite Scripts "
-> i.imgur.com
2. Go in the Chart & click the little arrow in the upper bar and then click " Daily Range ", then the Daily Range appears in the top left corner
-> i.imgur.com
To avoid errors make sure to right-click the Y-Axis on the right side of the chart and then left-click "Scale Price Chart Only" .
-> i.imgur.com
Also be aware that the daily range is only showing up , if you are in the daily time interval or below and you are not hovering with the cursor over the past candles respectively above or below them .
If you are using this script in exotic currencypairs or uncommon other markets , the daily range can be incorrect or not showing up .
So don't hesitate contacting me , then I will try to add the markets that you want to.
To change the color or the decimal places of the number, you can click the gear in the upper left corner.
-> i.imgur.com
Happy Pips

X Period High/Low/MidToday we have a simple, but endlessly versatile, indicator that plots the X Period High/Low/Mid of your chosen market.
Traditionally the 52 week High/Low is used as a breakout signal. However, by changing to an X period, and adding a midway line, we create a more versatile indicator that can be tailored to various markets.
By default it's set at 250 periods (because I like the 250 period moving average), and I generally trade H4 and Daily time frames. But tweak it to your liking, you just have to modify the length periods by your desired time frame and lookback length. E.g. to create a 52 week indicator on the daily time frame, enter a length of 260 in the indicator (5 days per week * 52 weeks = 260).
For the above reason, I haven't made this indicator MTF, as there's no real need. However, if users find it easier I can look at adding it later.
Also, the mid point between an X period high/low is often a good trend-follower, as well as acting as support/resistance . I encourage you to experiment with different ways of using this indicator. Entire systems (if your risk management is correct) can be built and traded from this one indicator.
Good luck.
DD