IDLP – Intraday Daily Levels Pro [FXSMARTLAB]🔥 IDLP – Intraday Daily Levels Pro
IDLP – Intraday Daily Levels Pro is a precision toolkit for intraday traders who rely on objective daily structure instead of repainting indicators and noisy signals.
Every level plotted by IDLP is derived from one simple rule:
Today’s trading decisions must be based on completed market data only.
That means:
✅ No use of the current day’s unfinished data for levels
✅ No lookahead
✅ No hidden repaint behavior
IDLP reconstructs the previous trading day from the intraday chart and then projects that structure forward onto the current session, giving you a stable, institutional-style intraday map.
🧱 1. Previous Daily Levels (Core Structure)
IDLP extracts and displays the full previous daily structure, which you can toggle on/off individually via the inputs:
Previous Daily High (PDH)
Previous Daily Low (PDL)
Previous Daily Open
Previous Daily Close,
Previous Daily Mid (50% of the range)
Previous Daily Q1 (25% of the range)
Previous Daily Q3 (75% of the range)
All of these come from the day that just closed and are then locked for the entire current session.
What these levels tell you:
PDH / PDL – true extremes of yesterday’s price action (liquidity zones, breakout/reversal points).
Previous Daily Open / Close – how the market positioned itself between session start and end
Mid (50%) – equilibrium level of the previous day’s auction.
Q1 / Q3 (25% / 75%) internal structure of the previous day’s range, dividing it into four equal zones and helping you see if price is trading in the lower, middle, or upper quarter of yesterday’s range.
All these levels are non-repaint: once the day is completed, they are fixed and never change when you scroll, replay, or backtest.
🎯 2. Previous Day Pivot System (P, S1, S2, R1, R2)
IDLP includes a classic floor-trader pivot grid, but critically:
It is calculated only from the previous day’s high, low, and close.
So for the current session, the following are fixed:
Pivot P – central reference level of the previous day.
Support 1 (S1) and Support 2 (S2)
Resistance 1 (R1) and Resistance 2 (R2)
These levels are widely used by institutional desks and algos to structure:
mean-reversion plays, breakout zones, intraday targets, and risk placement.
Everything in this section is non-repaint because it only uses the previous day’s fully closed OHLC.
📏 3. 1-Day ADR Bands Around Previous Daily Open
Instead of a multi-day ADR, IDLP uses a pure 1-Day ADR logic:
ADR = Range of the previous day
ADR = PDH − PDL
From that, IDLP builds two clean bands centered around the previous daily Open:
ADR Upper Band = Previous Day Open + (ADR × Multiplier)
ADR Lower Band = Previous Day Open − (ADR × Multiplier)
The multiplier is user-controlled in the inputs:
ADR Multiplier (default: 0.8)
This lets you choose how “tight” or “wide” you want the ADR envelope to be around the previous day’s open.
Typical use cases:
Identify realistic intraday extension targets, Spot exhaustion moves beyond ADR bands, Frame reversals after reaching volatility extremes, Align trades with or against volatility expansion
Again, since ADR is calculated only from the completed previous day, these bands are totally non-repaint during the current session.
🔒 4. True Non-Repaint Architecture
The internal logic of IDLP is built to guarantee non-repaint behavior:
It reconstructs each day using time("D") and tracks:
dayOpen, dayHigh, dayLow, dayClose for the current day
prevDayOpen, prevDayHigh, prevDayLow, prevDayClose for the previous day
At the moment a new day starts:
The “current day” gets “frozen” into prevDay*
These prevDay* values then drive: Previous Daily Levels, Pivots, ADR.
During the current day:
All these “previous day” values stay fixed, no matter what happens.
They do not move in real time, they do not shift in replay.
This means:
What you see in the past is exactly what you would have seen live.
No fake backtests.
No illusion of perfection from repainting behavior.
🎯 5. Designed For Intraday Traders
IDLP – Intraday Daily Levels Pro is made for:
- Day traders and scalpers
- Index and FX traders
- Prop firm challenge trading
- Traders using ICT/SMC-style levels, liquidity, and range logic
- Anyone who wants a clean, institutional-style daily framework without noise
You get:
Previous Day OHLC
Mid / Q1 / Q3 of the previous range
Previous-Day Pivots (P, S1, S2, R1, R2)
1-Day ADR Bands around Previous Day Open
All calculated only from closed data, updated once per day, and then locked.
Targets

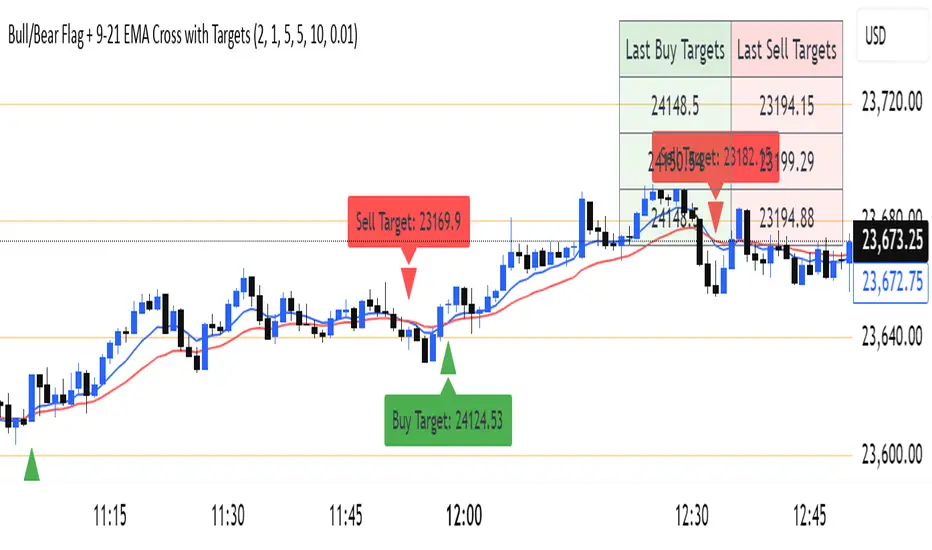
Bull/Bear Flag + 9-21 EMA Cross with Targetssimple chart indicator help with buy sell targets using bear and bull flag along with moving averages on chart -helpful for beginner traders
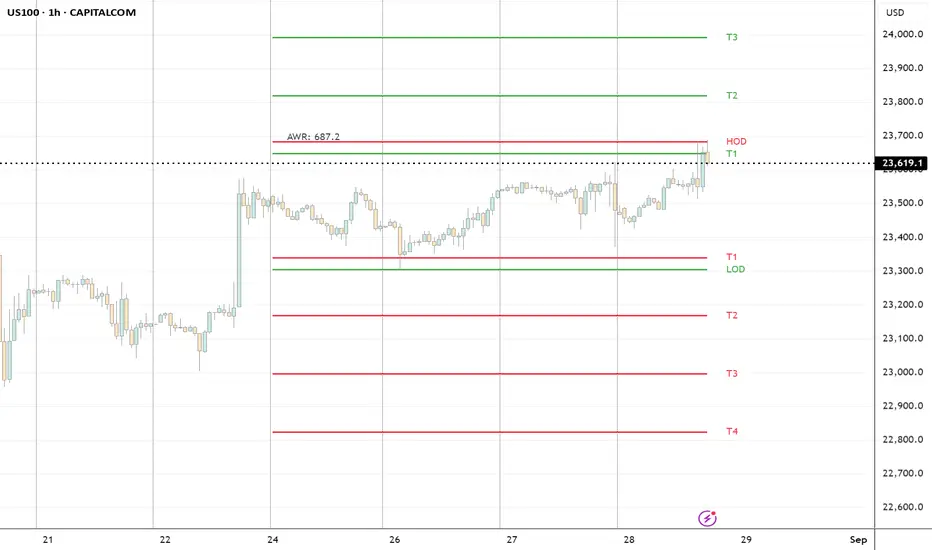
ADR H/L + Bull/Bear TargetsThis indicator calculates the Average Daily/Weekly Range over any given period and plots the Bull and Bear targets for that Session Daily/Weekly or both. Classic targets are calculated at ADR/AWR +/- .50 .75 1.00 1.25. Green is for the + and RED is for the - but colors can been changed to suit.
In 'Settings' there is the ability to toggle:
1. How many sessions you want to plotting on your chart.
2. Switching ON/OFF Bull/Bear targets.
3. Line color/thickness
4. Ability to offset Header for ADR/AWR vertically.
5. I've put in there a FIB option as well as Classic. FIB counts are at .382 .50 .618 1.00 of ADR and labelled as such.
Session Volatility MonitorOverview
Session Volatility Monitor is a versatile volatility indicator tailored for intraday and session-based trading. It computes the average maximum price deviation (either up or down) from the session's opening price over a user-specified number of prior days, providing insights into expected "room to move" in the current session. This helps traders gauge potential exhaustion points, set realistic targets or stops, and identify when a directional move has reached historical norms (flagged as "REACHED" with the exact price level).
Displayed via a customisable table and optional horizontal target lines, it's ideal for markets like forex, crypto, futures, or stocks where session volatility matters. The indicator supports custom sessions with timezone adjustments, making it adaptable to global trading hours (e.g., London, NY, or Asia kill zones). For assets with small tick sizes (e.g., forex pairs at 0.0001), a multiplier scales values for readability (e.g., showing pips as 67.0 instead of 0.00670).
Key Features
Session-Based Calculations:
Defines sessions via presets (e.g., "NY Kill Zone: 07:00-10:00") or custom HHMM-HHMM inputs. (please note that preset sessions are mainly for futures e.g. "Full Day18:01-17:00", but also can be useful for forex and crypto)
Adjustable UTC offset (e.g., -5 for ET) to align with your asset's timezone—ensures accurate detection regardless of TradingView's UTC internal clock.
Tracks the max one-sided move (high - open or open - low) per session, averaging over 1–N previous days (default: 14).
Table Display:
Avg Max Move: Historical average deviation, labeled with days averaged and session time.
Current Move: Real-time displacement from session open (positive for up, negative for down).
Room to Go Up/Down: Remaining distance to reach the average, updating live; appends "REACHED (price)" if hit during the session.
Customisable: Text color, font size (tiny to huge), position (e.g., bottom_left), and value scaling via multiplier/decimal places.
Target Lines:
Optional horizontal lines at "Up Target" (open + avg move) and "Down Target" (open - avg move).
Lines start at the session open bar and extend only through the session duration (e.g., stops at 12:00 for a 07:00-12:00 session)—no further projection post-session.
Fully customisable: Toggle on/off, color, style (solid/dotted/dashed), width, label text/background.
Display Adjustments for Forex/Crypto:
Multiplier: Scales raw values (e.g., set to 10000 for EURUSD to show pips like 45.0 instead of 0.0045).
Decimals: Controls precision (0–5 places) for table values.
How to Use
Add to Chart: Search for "Session Volatility Monitor" in TradingView's indicators and apply to your symbol (e.g., EURUSD for forex, NQ1! for futures, BTCUSD for crypto).
Configure Settings:
Select a session preset or custom range; adjust UTC offset if needed (e.g., +0 for UTC symbols like crypto).
Set "Number of Previous Days to Average" (e.g., 14 for a two-week look back).
For small-tick assets, set Multiplier (e.g., 100 for crypto points, 10000 for forex pips) and Decimals (e.g., 0 for whole numbers).
Customise table position/size/color and target lines for visibility.
Interpret Outputs:
Monitor the table for "room to go"—if Room Up is low/negative, upside might be limited; "REACHED" signals a potential reversal or exhaustion.
Use target lines as visual S/R levels; they auto-start at session open and halt at close.
Combine with price action, volume, or other indicators for entries (e.g., buy near down target if bullish bias).
Example Scenario:
Forex (GBPUSD, 1-min): Set session to "London Kill Zone: 02:00-05:00" (UTC+0), multiplier=10000. Table shows pips; lines mark expected highs/lows.
Limitations and Tips
Historical Data Limits: Averages are capped by TradingView's bar history (e.g., ~14 days on 1-min for free plans). Upgrade for deeper look backs or use higher timeframes.
Session Accuracy: Ensure UTC offset matches your chart—test with the "In Session" plot (enable in Style tab, zoom y-axis if columns are tiny).
No Alerts/Signals: Purely informational; add custom alerts via TradingView for "REACHED" conditions.
Performance: On very low timeframes with long sessions, lines might consume line limits (max ~50)—toggle off if needed.
Tips: For crypto/forex, experiment with multiplier to match your preferred units (e.g., points vs. decimals). Hide debug plot in Style tab for clean charts. If "REACHED" doesn't trigger, verify on historical data where moves exceed averages.
This tool draws from concepts like Average Daily Range but focuses on directional, session-specific volatility for precise intraday decision-making. Feedback welcome!
Disclaimer
This indicator is for educational purposes only and does not constitute financial advice. Always consult a professional before trading.

Bracket PreviewThe Bracket Preview indicator allows the user to set their intended bracket order distance (distance, in ticks, to take-profit and stop-loss) from the current live price so that a preview is generated and updated in real-time as price moves. This gives the trader a quick reference of where the bracket orders would be placed if a position were entered at that specific moment in time. This can be helpful by making it more obvious to the trader before a trade is placed exactly where these levels would be in relation to previous price action or if it would be better to wait for price to move to a more favorable level or accept a different Risk-Reward (RR) from this specific trade.
• “If I entered a long position now, would my target be in front of or beyond a recent consolidation area where it is likely to run into resistance and potentially reverse before hitting my take-profit?”
• “Would this bracket order place my stop-loss above or below a previous pivot or would I need to move it after entering the trade and potentially increase the risk on this trade to have it in a more logical level?”
• “If price is in a range and I enter now, would my stop be in the middle of the range while my target is outside the top of the range? Maybe I should wait for price to move to an area where my target would be inside but near the top of the range while my stop loss is below the range so that I’m not taking unnecessary risk or being forced to take an unfavorable RR.”

ADR Plots + OverlayADR Plots + Overlay
This tool calculates and displays Average Daily Range (ADR) levels on your chart, giving traders a quick visual reference for expected daily price movement. It plots guide levels above and below the daily open and shows how much of the day's typical range has already been covered—all in one interactive table and on-chart overlay.
What It Does
ADR Calculation:
Uses daily high-low differences over a user-defined period (default 14 days), smoothed via RMA, SMA, EMA, or WMA to calculate the average daily range.
Projected Levels:
Plots four reference levels relative to the current day's open price:
+100% ADR: Open + ADR
+50% ADR: Open + 50% of ADR
−50% ADR: Open − 50% of ADR
−100% ADR: Open − ADR
Coverage %:
Tracks intraday high and low prices to calculate what percentage of the ADR has already been covered for the current session:
Coverage % = (High − Low) ÷ ADR × 100
Interactive Table:
Shows the ADR value and today's ADR coverage percentage in a customizable table overlay. The table position, colors, border, transparency, and an optional empty top row can all be adjusted via settings.
Customization Options
Table Settings:
Position the table (top/bottom × left/right).
Change background color, text color, border color and thickness.
Toggle an empty top row for spacing.
Line Settings:
Choose color, line style (solid/dotted/dashed), and width.
Lines automatically reposition each day based on that day's open price and ADR calculation.
General Inputs:
ADR length (number of days).
Smoothing method (RMA, SMA, EMA, WMA).
How to Use It for Trading
Measure Daily Movement: Instantly know the expected daily price range based on historical volatility.
Identify Overextension: Use the coverage % to see if the market has already moved close to or beyond its typical daily range.
Plan Entries & Exits: Align trade targets and stops with ADR levels for more objective intraday planning.
Visual Reference: Horizontal guide lines and table update automatically as new data comes in, helping traders stay informed without manual calculations.
Ideal For
Intraday traders tracking daily volatility limits.
Swing traders wanting a quick reference for expected price movement per day.
Anyone seeking a volatility-based framework for planning targets, stops, or identifying extended market conditions.

ATR Trailing Stop with ATR Targets [v6]What the Indicator Does
This custom TradingView indicator is designed for active traders who want to automate and visualize their trailing stop management and target setting, using true market volatility. It combines the Average True Range (ATR) with dynamic market structure logic to:
Trail a stop-loss behind major swings in real time, using 2×ATR (adjustable) from the highest high in uptrends or the lowest low in downtrends.
Flip trading bias between bullish and bearish when the stop is breached.
Identify and plot three profit targets (at 1, 2, and 3 ATR from the breakout/flip point) after every stop-flip, helping traders scale out or set take-profits objectively.
Maintain a visible presence on your chart every bar to avoid indicator errors, with color and labeling for clear distinction between long/short phases.
How the Indicator Works
1. ATR Calculation
ATR Period and Multiplier: You select your preferred ATR length (default is 14 bars) and a multiplier (default is 2.0).
Volatility Adjustment: ATR measures the average "true" bar range, so the trailing stop and targets adapt to current volatility.
2. Trailing Stop Logic
Uptrend (bullish bias): The indicator tracks the highest high made since the last bearish-to-bullish flip and sets the stop at - .
The stop only raises (never lowers) during an uptrend, protecting gains in strong moves.
Downtrend (bearish bias): Tracks the lowest low made since the last bullish-to-bearish flip, with stop at + .
The stop only lowers (never raises) in a downtrend.
Flip Point: If price closes through the trailing stop, the current bias “flips,” and the logic reverses (bullish to bearish or vice versa). At the new close, flip price and bar index are stored for target calculation.
3. ATR Targets after Flip
After each stop flip:
Three targets—based on the new close price—are calculated and plotted:
Long flip (new bull bias): Target1 = close + 1×ATR, Target2 = close + 2×ATR, Target3 = close + 3×ATR.
Short flip (new bear bias): Target1 = close - 1×ATR, Target2 = close - 2×ATR, Target3 = close - 3×ATR.
These targets help with scaling out, partial profit-taking, or setting automated orders.
4. Visual Feedback
Trailing stop line: Green for long bias, red for short bias.
Targets: Distinct color-coded circles at 1, 2, 3 ATR levels from the most recent flip.
Flip Labels: Mark the bar and price where bias flipped (“Long Flip” or “Short Flip”) for quick pattern recognition.
Subtle background shading: Ensures TradingView's requirement for “indicator output every bar.”
How to Use This Indicator
Parameter Setup
ATR Period and Multiplier: Adjust to match the timeframe and volatility of your instrument.
Lower periods/multipliers for short-term/volatile trading.
Higher values for smoother signals or higher timeframes.
Starting Trend: Set to match the expected initial bias if the instrument has strong trend characteristics.
Trading Application
1. Daily Bias Approach
Establish your bias in line with your trading plan (e.g., only trade long if price is above the previous day's high, short below the previous day's low).
Only look for trades in the indicator's current bias direction, as expressed by the stop and background color.
2. Entry
Use the indicator as a real-time confirmation or trailing stop for your entries.
Breakout: Enter when price establishes the current bias, using the trailing stop as your risk level.
Reversal: Wait for a bias flip after an extended move; enter in the direction of the new bias.
VWAP Rebound: Combine with a VWAP bounce—enter only if the indicator bias supports your direction.
3. Exits/Targets
Trailing stop management: Move your stop according to the plotted line; exit if your stop is hit.
Profit-taking: Scale out or take profits as price approaches each ATR-based target.
Use the dynamic labeling to identify reversal flips and reset your plan if stopped or the bias changes.
4. Market Context
Filter and frame setups by watching correlated indicators (DXY, VIX, AUDJPY, put/call ratio) and upcoming news; trade only in the daily bias direction for best consistency.
5. Practical Tips
Combine this indicator with your custom watchlist and alert settings to get notified on flips or targets.
Review the last label ("Long Flip"/"Short Flip") and targets to plan partial exits.
Remember: ATR adapts to volatility, so the stop and targets stay proportionate even when price action shifts.

CPR by DSKThis CPR (Central Pivot Range) indicator is designed to provide multi-timeframe insights and simplify trend analysis for traders of all levels. Key features include:
1. Dynamic CPR Levels
Automatically adapts and displays CPR levels based on the current chart timeframe (Daily, Weekly, or Monthly).
Useful for identifying intraday or swing trading opportunities.
2. Market Sentiment Summary Table
A compact summary table indicates the market bias (Bullish/Bearish) using the relative position of the price to the Daily, Weekly, and Monthly CPR Pivots.
Helps you instantly assess the prevailing trend across key timeframes.
3. Target Achievement Status
The summary also highlights if any CPR-based targets or key levels have been hit, offering valuable confirmation for trade setups and exits.
This indicator is ideal for traders seeking a quick, visual overview of market structure and trend strength using the well-known CPR method.

Momentum Shift [Bigbeluga]
This indicator identifies momentum shifts using a smoothed momentum calculation. It plots dynamic shift zones consisting of five levels that expand or contract based on price action. When momentum rises, the indicator creates an upward shift zone, and when momentum falls, it generates a downward shift zone. The shift zones dynamically react to price, stopping extension when a level is crossed.
🔵Key Features:
Smoothed Momentum Calculation:
➣ Utilizes a Hull Moving Average (HMA) to smooth momentum and reduce noise.
➣ Identifies momentum shifts with crossovers between the current momentum value and its previous state.
➣ Uses a gradient color scheme to highlight momentum strength.
Dynamic Shift Zones:
➣ When momentum rises, the indicator plots an upper shift zone with five incremental levels.
➣ When momentum falls, a lower shift zone is formed with five descending levels.
➣ Each level within the shift zone represents a progressively stronger momentum shift.
Level Extension Control:
➣ Shift zones stop extending once a level is crossed by price.
➣ Levels closer to price act as key momentum resistance or support zones.
➣ If price retraces after a shift, the remaining levels stay intact for further reference.
Momentum Direction Indications:
➣ Labels (▲ and ▼) appear at momentum shift points to indicate rising or falling momentum.
🔵Usage:
Momentum-Based Entries: Identify momentum shifts early by using shift zones as confirmation for trade entries.
Trend Continuation & Exhaustion: Observe which shift levels price respects—if momentum shift zones hold, the trend may continue; if they break, momentum may reverse.
Dynamic Support & Resistance: Use the five-level shift zones as temporary support and resistance areas that adapt to momentum shifts.
Momentum Strength Analysis: If price moves through multiple shift levels in one direction, it signals strong momentum in that direction.
Momentum Shift is a powerful tool for traders looking to analyze momentum shifts with structured visual zones. By combining smoothed momentum calculations with dynamic shift zones, this indicator provides a clear view of market momentum and helps traders navigate price action effectively.

The Curved Market Structure [BigBeluga]Curved Market Structure
The Curved Market Structure indicator offers an innovative twist on traditional market structure tools by using curved lines instead of horizontal ones, enabling faster breakout detection for traders.
🔵Key Features:
Curved Market Structure Levels: The indicator identifies high and low pivots and plots curved lines connecting these points, adapting to market dynamics and providing a more intuitive view of potential breakout zones.
Breakout Detection: Breakouts above or below the curved levels are marked with triangle symbols (▲ or ▼), making it easy to spot critical price movements.
Dynamic Target Levels: After a breakout, the indicator plots three target levels, which serve as potential price objectives. Each target is marked with a number and a star (e.g., 1★) upon being reached.
Customizable Line Length and Angle: Users can adjust the length and angle of the curved lines to fit their trading style and timeframe, making the tool versatile and adaptable.
Market Structure Trend Filtering: To maintain a clean chart, the indicator plots curved levels only from high pivots during uptrends and low pivots during downtrends.
🔵How It Works:
The indicator identifies high and low pivots using user-defined parameters (left and right bars).
Curved lines are drawn from these pivot points, showing the structure of the market and potential breakout zones.
When a breakout occurs, the indicator highlights the direction with triangle symbols and dynamically plots three price targets.
Upon reaching these targets, the level is marked with its respective number and a star, helping traders track price progression effectively.
The lines and targets are adjusted based on market conditions, ensuring real-time relevance and accuracy.
🔵Use Cases:
Spotting key breakout zones to identify entry and exit points more effectively.
Setting dynamic target levels for take-profit or stop-loss planning.
Filtering market noise and maintaining a cleaner chart while analyzing trends.
Enhancing traditional market structure analysis with an intuitive curved visualization.
This indicator is ideal for traders who want a modern, dynamic, and visually appealing way to track market structure and breakouts while maintaining chart clarity.

Target Trend [BigBeluga]The Target Trend indicator is a trend-following tool designed to assist traders in capturing directional moves while managing entry, stop loss, and profit targets visually on the chart. Using adaptive SMA bands as the core trend detection method, this indicator dynamically identifies shifts in trend direction and provides structured exit points through customizable target levels.
SP500:
🔵 IDEA
The Target Trend indicator’s concept is to simplify trade management by providing automated visual cues for entries, stops, and targets directly on the chart. When a trend change is detected, the indicator prints an up or down triangle to signal entry direction, plots three customizable target levels for potential exits, and calculates a stop-loss level below or above the entry point. The indicator continuously adapts as price moves, making it easier for traders to follow and manage trades in real time.
When price crosses a target level, the label changes to a check mark, confirming that the target has been achieved. Similarly, if the stop-loss level is hit, the label changes to an "X," and the line becomes dashed, indicating that the stop loss has been activated. This feature provides traders with a clear visual trail of whether their targets or stop loss have been hit, allowing for easier trade tracking and exit strategy management.
🔵 KEY FEATURES & USAGE
SMA Bands for Trend Detection: The indicator uses adaptive SMA bands to identify the trend direction. When price crosses above or below these bands, a new trend is detected, triggering entry signals. The entry point is marked on the chart with a triangle symbol, which updates with each new trend change.
Automated Targets and Stop Loss Management: Upon a new trend signal, the indicator automatically plots three price targets and a stop loss level. These levels provide traders with structured exit points for potential gains and a clear risk limit. The stop loss is placed below or above the entry point, depending on the trend direction, to manage downside risk effectively.
Visual Target and Stop Loss Validation: As price hits each target, the label beside the level updates to a check mark, indicating that the target has been reached. Similarly, if the stop loss is activated, the stop loss label changes to an "X," and the line becomes dashed. This feature visually confirms whether targets or stop losses are hit, simplifying trade management.
The indicator also marks the entry price at each trend change with a label on the chart, allowing traders to quickly see their initial entry point relative to current price and target levels.
🔵 CUSTOMIZATION
Trend Length: Set the lookback period for the trend-detection SMA bands to adjust the sensitivity to trend changes.
Targets Setting: Customize the number and spacing of the targets to fit your trading style and market conditions.
Visual Styles: Adjust the appearance of labels, lines, and symbols on the chart for a clearer view and personalized layout.
🔵 CONCLUSION
The Target Trend indicator offers a streamlined approach to trend trading by integrating entry, target, and stop loss management into a single visual tool. With automatic tracking of target levels and stop loss hits, it helps traders stay focused on the current trend while keeping track of risk and reward with minimal effort.

Opening Range with Breakouts & Targets [LuxAlgo]Opening Range with Breakouts & Targets is based on the long-standing Opening Range Breakout strategy popularized by traders such as Toby Crabel and Mark Fisher.
This indicator measures and displays the price range created from the first period within a new trading session, along with price breakouts from that range and targets associated with the range width.
🔶 USAGE
The Opening Range (OR) can be a powerful tool for making a clear distinction between ranging and trending trading days. Using a rigid structure for drawing a range, provides a consistent basis to make judgments and comparisons that will better assist the user in determining a hypothesis for the day's price action.
NOTE: During a suspected "Range Day", the Opening Range can be used for reversion strategies, typically targeting the opposite extreme of the range or the mean of the range. However, more commonly the Opening Range is used for breakouts on suspected "Trend Days", targeting further upward or downward market movement.
The common Opening Range Breakout Strategy (ORB) outlines a structure to enter and exit positions based on rigid points determined by the Opening Range. This methodology can be adjusted based on markets or trading styles.
Determine Opening Range High & Low: These are the high and low price within a chosen period of time after the market opens. This can be customized to the user's trading style and preference. Common Ranges are from 5-60 mins.
Watch for a Breakout with Volume: A Breakout occurs when price crosses the OR High (ORH) or OR Low (ORL), an increase in volume is typically desired when witnessing these breakouts to confirm a stronger movement.
Manage Risk: Based on user preference and the appropriately determined amount of risk, multiple ways can be determined to manage risk by using Opening Range.
For Example: A stop-loss could be set at OR Mean (ORM) or the opposite side of the range, while a profit target could optionally be set at the first price target generated by the script.
Alternatively, a user might want to use a Moving Average (MA) as an adaptive stop-loss and use price targets to scale out. These are just 2 examples of the possible options, both capable with this tool.
🔹 Signals
Signals will fire based on the break of the opening range, this is indicated by arrows above and below the range boundaries.
Optionally, a bias can be added to these signals to aid in mitigating false signals by using a directional filter based on the current day's OR relative to the previous day's OR.
Regardless of the signal bias being enabled, the Opening Range Zone will always be colored directionally according to this.
If the current day's OR is above the previous day's OR, the Zone will be Green.
If the current day's OR is below the previous day's OR, the Zone will be Red.
By enabling the signal bias, signals in the opposite direction of the daily bias will fire on the cross of the first target in that direction.
🔹 Targets
In this indicator, targets are not limited and will generate infinitely based on a % width of the Opening Range.
Additionally, there are 2 display methods for these targets.
Extended: Extends the targets to the current bar and displays all targets that have been crossed so far within the session.
Adaptive: Extends only the 2 closest targets surrounding price, allowing for a display consisting of fewer lines at one time.
🔶 DETAILS
🔹 Historical Display
This indicator can be utilized in multiple ways, for use in real-time, and for historical analysis to form methods. Because of this, the indicator has an option to display only the current day's data or the entire historical data. This can also help clean up the chart when it is in use.
🔹 Time Period
The specific time period to create the opening range is entirely up to each user's preference, by default it is set to 30 mins; however, this time period can be edited with full control if desired.
Simply toggle on the "Custom Range" and input a range of time to create the range.
🔹 Session Moving Average
The Session Moving Average is a common Moving Average, which resets at the beginning of a new session. This allows for an unbiased MA that was created entirely from the current session's price action.
Note: The start of the session is determined by the start of the Opening Range if using a custom range of time.
🔶 SETTINGS
Show Historical Data: Choose to display only the current session's data or the full history of data.
Opening Range Time Period: Select the time period to form the opening range from. This operates on Session Start, so it will change with the chart.
Custom Range: Opt for a custom Range by enabling this and inputting your range times as well as your needed timezone.
Breakout Signal Bias: Select if the Breakout Signals will use a Daily Directional Bias for firing.
Target % of Range: Sets the % of the Range width that will be used as an increment for the Targets to display in.
Target Cross Source: Choose to use the Close price or High/Low price as the crossing level for Target displays. When this source crosses a target it will generate more targets.
Target Display: Choose which style of display to use for targets.
Session Moving Average: Optionally enable a Moving average of your choice that resets at the beginning of each session (start of opening range).

Fundur - Easy ZonesFundur Easy Zones Trading Indicator
The Fundur Easy Zones trading indicator is designed to simplify market analysis by visually marking critical trading zones. This tool helps traders identify optimal buy and sell areas based on historical price action, making it easier to make informed trading decisions.
Calculation Methodology
The Easy Zones indicator employs pivot point calculations combined with price action analysis and the Average True Range (ATR) to determine key trading zones. These zones are calculated by analyzing market volatility and price movements within each timeframe, allowing the identification of significant discount and premium levels.
Pivot Points: The indicator calculates pivot points based on the average of high, low, and close prices from previous periods. These pivot points serve as the foundational levels from which discount and premium zones are derived.
Price Action Analysis: Historical price data is scrutinized to identify patterns and behaviors that signify potential reversal points. This analysis helps in pinpointing zones where the market is likely to experience significant support (discount) or resistance (premium).
Average True Range (ATR): ATR is used to measure market volatility. By incorporating ATR into the calculations, the indicator adjusts the zone boundaries to reflect current market conditions, ensuring that the zones remain relevant and accurate. Higher ATR values indicate greater volatility and wider zones, while lower ATR values result in narrower zones.
Discount and Premium Levels: Based on the pivot points and ATR, the indicator calculates various tiers of discount and premium levels. These tiers (D1, D2, D3 for discounts and P1, P2, P3 for premiums) represent increasing levels of price deviation from the mean, providing traders with clear entry and exit points.
Features Overview
Zones Settings:
Zones History Length: Adjust the number of historical zones displayed on the chart to analyze past price behavior.
Levels Line Width: Customize the thickness of the zone lines for better visibility.
Structure Settings:
Show Fair Value: Display the fair value zone, providing a visual reference for equilibrium price levels. The fair value is calculated based on the median price over the selected period.
DP (Discount and Premium) Settings:
Enable Discount and Premium Levels: Activate the display of critical buy (discount) and sell (premium) zones. These zones are determined using price deviation analysis from the mean, identifying significant discount (support) and premium (resistance) levels.
Tiered Levels: Visualize up to three levels of discount and premium zones, each with specific target prices (TP1, TP2, TP3), representing different levels of price deviation significance.
Highlight Buy and Sell Zones:
Enable Background: Highlight the background of buy and sell zones for enhanced clarity.
Label Settings:
Enable All Labels: Ensure all labels are visible for quick reference.
Show Descriptive Title: Display titles for each zone, making it easier to understand the context.
Show Take Profit Targets (TP): Clearly mark take profit targets within each zone.
Show Price: Display price levels for each zone for precise entry and exit points.
Symbols Settings:
Fair Value, Premium, and Discount Indicators: Customize symbols to represent gaining or losing fair value, premium, and discount levels, enhancing visual cues for market sentiment.
How to Use the Easy Zones Indicator
Identifying Entry Points:
Use the Discount Zones to identify optimal buy areas. The levels (D1, D2, D3) represent increasing levels of discount, with D1 being the least discounted and D3 the most.
Place buy orders at or near these zones to take advantage of potential price reversals.
Identifying Exit Points:
Use the Premium Zones to identify optimal sell areas. The levels (P1, P2, P3) represent increasing levels of premium, with P1 being the least and P3 the highest.
Place sell orders at or near these zones to maximize profits on upward price movements.
Using Fair Value:
The Fair Value Zone provides a balanced price level where the market is likely to return. Use this as a reference point for setting realistic entry and exit targets.
Strategic Planning:
Combine Discount and Premium Zones with the Fair Value Zone to create a strategic trading plan.
Monitor the zones for price reactions and adjust your trading strategy accordingly.
Best Practices
Historical Analysis:
Regularly review historical price actions within the marked zones to understand market behavior.
Customization:
Adjust the settings to suit your trading style and market conditions. Experiment with different zone lengths and line widths for optimal clarity.
Risk Management:
Always use stop-loss orders in conjunction with the identified zones to manage risk effectively.
By integrating the Fundur Easy Zones indicator into your trading strategy, you can enhance your market analysis, make more informed decisions, and ultimately improve your trading performance.

Market Structure Targets Model [LuxAlgo]The Market Structure Targets Model indicator provides an algorithmic approach to setting targets from market structure shifts (MSS) and market structure breaks (MSB), two popular Smart Money Concept (SMC) concepts. Depending on the target % settings, they can be used as take profit, confirmation levels, or potential reversal points.
🔶 USAGE
Our Market Structure Targets Model scripts provide automated and customizable targets from MSS and MSB. Each displayed target can be used in several ways described in the sub-sections below:
🔹 Take Profit
The targets can be used as take profit levels, where the target distance can be set separately for bullish/bearish MSS/MSB respectively.
🔹 Confirmation Levels
Alternatively, targets can be used as an additional confirmation level of a trend reversal when set at a lower percentage, filtering out fake signals that might be given from market structures. In this way, targets can be used as potential entry levels.
🔹 Potential Reversal Points
In some circumstances, targets being reached can be indicative of trend reversals. The percentage of the targets would be typically set higher to allow for trend exhaustion.
The above examples highlight this usage for bearish reversal scenarios, while the image below highlights it for bullish reversal scenarios.
🔹 Support/Resistance Levels
The targets, being horizontal levels, can also serve as potential support/resistances, with breakouts potentially confirming new trends. It is important to remain observant of the market structure. An MSS or MSB in the opposite direction provides essential information to be included in future decisions.
Using multiple timeframes can help detect longer-term trends. Depending on the user's preference, they can choose the appropriate timeframe for their needs.
Note that Target lines will only be drawn when the Target Level exceeds the close value when it is drawn.
🔹 Maximum Target Duration
The Maximum Target Duration setting removes unreached target levels when the amount of bars since the associated market structure of that target exceeds the user set limit. This effectively allows the removal of any target that might no longer be relevant to newer trends.
🔹 Type: Switch/Hold
This setting is another way to control unreached target levels.
Switch: When a new MSS/MSB is found, the previous target level associated with a market structure with the same direction (bullish/bearish) is deleted if it hasn't been reached.
Hold: Target levels are retained and continuously evaluated when a new MSS/MSB is formed.
The target level will be removed in both cases when the Maximum Target Duration condition is applied.
The above example shows the case when the Type setting is set to Switch , while in the example below, it is set to Hold .
🔶 DETAILS
🔹 Market Structure
Market structures are commonly classified as follows:
Market Structure Shift (MSS), also referred to as Change of Character (CHoCH)
Market Structure Break (MSB), also referred to as Break of Structure (BOS)
MSS indicates a shift in the market trend, confirming trend reversals. Conversely, MSB occurs once a trend is already determined, confirming new higher highs/lower lows.
🔹 Targets
A: Highest/lowest between the extremities of the MSS/MSB line
B: Price value of the MSS/MSB line
The distance between A and B is projected on the opposite side of the MSS/MSB line, adjusted with a percentage that can be set by the user. The above example used 100% of the distance between A and B.
The Target Percentage of MSS and MSB can be set separately for bullish or bearish market structures.
🔶 SETTINGS
Swings: Period used for the swing detection, with higher values returning longer-term Swing Levels.
Type: the Switch/Hold setting controls unattained target levels
Maximum Target Duration: removes the target lines when the amount of bars since the drawing of the target exceeds the limit and the target has not been reached
🔹 Market Structure Shift (MSS)
Bullish: Toggle, color setting, % Target
Bearish: Toggle, color setting, % Target
🔹 Market Structure Break (MSB)
Bullish: Toggle, color setting, % Target
Bearish: Toggle, color setting, % Target

Average SL% Calculator with TP Levels by GorkiAverage Stop Loss And Take Profit Calculator For Futures Trading by Gorki
Description
The "Average SL% Calculator with TP Levels" script, is a simple tool for traders to plan the trades and check how much loss they are going to receive if they run this strategy. This script calculates the average price of up to four entry points, determines the percentage distance to the stop-loss level, and provides potential loss information based on margin and leverage. Additionally, it includes multiple take-profit levels to help traders systematically capture profits. Visual elements such as horizontal lines and labels make it easy to monitor key levels directly on the chart.
Why To Use This Indicator?
Risk Management: Automatically calculates the percentage distance to the stop-loss level, helping you to understand potential losses.
Profit Optimization: Supports up to four take-profit levels, enabling a structured approach to capturing gains.
Visual Clarity: Displays key levels and important information directly on the chart for easy monitoring.
Alerts: Generates alerts when the price crosses specified levels, ensuring you never miss critical trading signals.
How to Use the Script
Add the Script to Your Chart: Apply the script to your TradingView chart.
Set Input Values: Entry Points: Define up to four limit prices (LIMIT 1, LIMIT 2, LIMIT 3, LIMIT 4).
Stop-Loss: Set your stop-loss price (STOP LOSS).
Take Profits: Specify up to four take-profit levels (Take Profit 1, Take Profit 2, Take Profit 3, Take Profit 4).
Leverage: Input your leverage factor.
Margin: Enter the total margin amount for the trade.
View Calculations: The script will calculate the average entry price, the percentage distance to the stop-loss, and the potential loss based on margin and leverage.
Monitor Levels: Horizontal lines and labels will appear on the chart, showing entry points, stop-loss, and take-profit levels.
Set Alerts: Alerts will trigger when the price crosses your defined levels, helping you to take timely action.
Calculation Details
Average Price: Calculated as the mean of the specified limit prices.
Distance to Stop-Loss: Determined as the percentage difference between the average price and the stop-loss level.
Leveraged Distance: The stop-loss distance percentage multiplied by the leverage factor.
Potential Loss: Calculated by applying the leveraged distance percentage to the margin amount.
Take Profit Percentages: The percentage difference between the average price and each take-profit level.
This comprehensive indicator is a must-have for any trader looking to manage risks effectively while maximizing potential profits. Happy trading!

Ichimoku Theories [LuxAlgo]The Ichimoku Theories indicator is the most complete Ichimoku tool you will ever need. Four tools combined into one to harness all the power of Ichimoku Kinkō Hyō.
This tool features the following concepts based on the work of Goichi Hosoda:
Ichimoku Kinkō Hyō: Original Ichimoku indicator with its five main lines and kumo.
Time Theory: automatic time cycle identification and forecasting to understand market timing.
Wave Theory: automatic wave identification to understand market structure.
Price Theory: automatic identification of developing N waves and possible price targets to understand future price behavior.
🔶 ICHIMOKU KINKŌ HYŌ
Ichimoku with lines only, Kumo only and both together
Let us start with the basics: the Ichimoku original indicator is a tool to understand the market, not to predict it, it is a trend-following tool, so it is best used in trending markets.
Ichimoku tells us what is happening in the market and what may happen next, the aim of the tool is to provide market understanding, not trading signals.
The tool is based on calculating the mid-point between the high and low of three pre-defined ranges as the equilibrium price for short (9 periods), medium (26 periods), and long (52 periods) time horizons:
Tenkan sen: middle point of the range of the last 9 candles
Kinjun sen: middle point of the range of the last 26 candles
Senkou span A: middle point between Tankan Sen and Kijun Sen, plotted 26 candles into the future
Senkou span B: midpoint of the range of the last 52 candles, plotted 26 candles into the future
Chikou span: closing price plotted 26 candles into the past
Kumo: area between Senkou pans A and B (kumo means cloud in Japanese)
The most basic use of the tool is to use the Kumo as an area of possible support or resistance.
🔶 TIME THEORY
Current cycles and forecast
Time theory is a critical concept used to identify historical and current market cycles, and use these to forecast the next ones. This concept is based on the Kihon Suchi (translating to "Basic Numbers" in Japanese), these are 9 and 26, and from their combinations we obtain the following sequence:
9, 17, 26, 33, 42, 51, 65, 76, 129, 172, 200, 257
The main idea is that the market moves in cycles with periods set by the Kihon Suchi sequence.
When the cycle has the same exact periods, we obtain the Taito Suchi (translating to "Same Number" in Japanese).
This tool allows traders to identify historical and current market cycles and forecast the next one.
🔹 Time Cycle Identification
Presentation of 4 different modes: SWINGS, HIGHS, KINJUN, and WAVES .
The tool draws a horizontal line at the bottom of the chart showing the cycles detected and their size.
The following settings are used:
Time Cycle Mode: up to 7 different modes
Wave Cycle: Which wave to use when WAVE mode is selected, only active waves in the Wave Theory settings will be used.
Show Time Cycles: keep a cleaner chart by disabling cycles visualisation
Show last X time cycles: how many cycles to display
🔹 Time Cycle Forecast
Showcasing the two forecasting patterns: Kihon Suchi and Taito Suchi
The tool plots horizontal lines, a solid anchor line, and several dotted forecast lines.
The following settings are used:
Show time cycle forecast: to keep things clean
Forecast Pattern: comes in two flavors
Kihon Suchi plots a line from the anchor at each number in the Kihon Suchi sequence.
Taito Suchi plot lines from the anchor with the same size detected in the anchored cycle
Anchor forecast on last X time cycle: traders can place the anchor in any detected cycle
🔶 WAVE THEORY
All waves activated with overlapping
The main idea behind this theory is that markets move like waves in the sea, back and forth (making swing lows and highs). Understanding the current market structure is key to having realistic expectations of what the market may do next. The waves are divided into Simple and Complex.
The following settings are used:
Basic Waves: allows traders to activate waves I, V and N
Complex Waves: allows traders to activate waves P, Y and W
Overlapping waves: to avoid missing out on any of the waves activated
Show last X waves: how many waves will be displayed
🔹 Basic Waves
The three basic waves
The basic waves from which all waves are made are I, V, and N
I wave: one leg moves
V wave: two legs move, one against the other
N wave: Three legs move, push, pull back, and another push
🔹 Complex Waves
Three complex waves
There are other waves like
P wave: contracting market
Y wave: expanding market
W wave: double top or double bottom
🔶 PRICE THEORY
All targets for the current N wave with their calculations
This theory is based on identifying developing N waves and predicting potential price targets based on that developing wave.
The tool displays 4 basic targets (V, E, N, and NT) and 3 extended targets (2E and 3E) according to the calculations shown in the chart above. Traders can enable or disable each target in the settings panel.
🔶 USING EVERYTHING TOGETHER
Please DON'T do this. This is not how you use it
Now the real example:
Daily chart of Nasdaq 100 futures (NQ1!) with our Ichimoku analysis
Time, waves, and price theories go together as one:
First, we identify the current time cycles and wave structure.
Then we forecast the next cycle and possible key price levels.
We identify a Taito Suchi with both legs of exactly 41 candles on each I wave, both together forming a V wave, the last two I waves are part of a developing N wave, and the time cycle of the first one is 191 candles. We forecast this cycle into the future and get 22nd April as a key date, so in 6 trading days (as of this writing) the market would have completed another Taito Suchi pattern if a new wave and time cycle starts. As we have a developing N wave we can see the potential price targets, the price is actually between the NT and V targets. We have a bullish Kumo and the price is touching it, if this Kumo provides enough support for the price to go further, the market could reach N or E targets.
So we have identified the cycle and wave, our expectations are that the current cycle is another Taito Suchi and the current wave is an N wave, the first I wave went for 191 candles, and we expect the second and third I waves together to amount to 191 candles, so in theory the N wave would complete in the next 6 trading days making a swing high. If this is indeed the case, the price could reach the V target (it is almost there) or even the N target if the bulls have the necessary strength.
We do not predict the future, we can only aim to understand the current market conditions and have future expectations of when (time), how (wave), and where (price) the market will make the next turning point where one side of the market overcomes the other (bulls vs bears).
To generate this chart, we change the following settings from the default ones:
Swing length: 64
Show lines: disabled
Forecast pattern: TAITO SUCHI
Anchor forecast: 2
Show last time cycles: 5
I WAVE: enabled
N WAVE: disabled
Show last waves: 5
🔶 SETTINGS
Show Swing Highs & Lows: Enable/Disable points on swing highs and swing lows.
Swing Length: Number of candles to confirm a swing high or swing low. A higher number detects larger swings.
🔹 Ichimoku Kinkō Hyō
Show Lines: Enable/Disable the 5 Ichimoku lines: Kijun sen, Tenkan sen, Senkou span A & B and Chikou Span.
Show Kumo: Enable/Disable the Kumo (cloud). The Kumo is formed by 2 lines: Senkou Span A and Senkou Span B.
Tenkan Sen Length: Number of candles for Tenkan Sen calculation.
Kinjun Sen Length: Number of candles for the Kijun Sen calculation.
Senkou Span B Length: Number of candles for Senkou Span B calculation.
Chikou & Senkou Offset: Number of candles for Chikou and Senkou Span calculation. Chikou Span is plotted in the past, and Senkou Span A & B in the future.
🔹 Time Theory
Show Time Cycle Forecast: Enable/Disable time cycle forecast vertical lines. Disable for better performance.
Forecast Pattern: Choose between two patterns: Kihon Suchi (basic numbers) or Taito Suchi (equal numbers).
Anchor forecast on last X time cycle: Number of time cycles in the past to anchor the time cycle forecast. The larger the number, the deeper in the past the anchor will be.
Time Cycle Mode: Choose from 7 time cycle detection modes: Tenkan Sen cross, Kijun Sen cross, Kumo change between bullish & bearish, swing highs only, swing lows only, both swing highs & lows and wave detection.
Wave Cycle: Choose which type of wave to detect from 6 different wave types when the time cycle mode is set to WAVES.
Show Time Cycles: Enable/Disable time cycle horizontal lines. Disable for better performance.
how last X time cycles: Maximum number of time cycles to display.
🔹 Wave Theory
Basic Waves: Enable/Disable the display of basic waves, all at once or one at a time. Disable for better performance.
Complex Waves: Enable/Disable complex wave display, all at once or one by one. Disable for better performance.
Overlapping Waves: Enable/Disable the display of waves ending on the same swing point.
Show last X waves: 'Maximum number of waves to display.
🔹 Price Theory
Basic Targets: Enable/Disable horizontal price target lines. Disable for better performance.
Extended Targets: Enable/Disable extended price target horizontal lines. Disable for better performance.

TrendLine ScythesTrendline Scythes is a script designed to automatically detect and draw special curved trendlines, resembling scythes or blades, based on pivotal points in price action. These trendlines adapt to the volatility of the market, providing a unique perspective on trend dynamics.
🔲 Methodology
Traditional trendlines connect consecutive pivot points on a price chart, providing a linear representation of trend direction. However, this script employs a distinctive methodology by automatically detecting price pivots and then calculating special curved trendlines based on the Average True Range (ATR) of the price. This introduces a curvature to the trendlines, resembling scythes, offering a unique way to interpret market trends.
🔲 Auto Breakout and Target Detection
Trendline Scythes includes features for automatic breakout detection, signaling potential trend changes. Additionally, the script assists in target detection, helping traders set realistic and data-driven profit-taking levels based on market volatility and user adjustment.
🔲 Utility
Trend Confirmation - Use Trendline Scythes to confirm existing trends by observing how price interacts with the curved trendlines.
Breakout Signals - Auto-detection of breakouts adds a proactive element to your trading strategy, helping you stay ahead of potential trend reversals.
Target Setting - Utilize the script to set profit-taking targets based on volatility, aligning with the current market conditions.
🔲 Settings
Pivot Length - Swing detection length
Scythe Length - Adjusts the length of the scythes blade
Sensitivity - Controls how restrained the target calculation is, higher values will result in tighter targets.
🔲 Alerts
Breakout
Breakdown
Target Reached
Target Invalidated
As well as the option to trigger 'any alert' call.
Trendline Scythes is a versatile tool combining the benefits of traditional trendlines with the dynamic adaptability of curved lines for a unique approach to trend analysis.

Targets For Many Indicators [LuxAlgo]The Targets For Many Indicators is a useful utility tool able to display targets for many built-in indicators as well as external indicators. Targets can be set for specific user-set conditions between two series of values, with the script being able to display targets for two different user-set conditions.
Alerts are included for the occurrence of a new target as well as for reached targets.
🔶 USAGE
Targets can help users determine the price limit where the price might start deviating from an indication given by one or multiple indicators. In the context of trading, targets can help secure profits/reduce losses of a trade, as such this tool can be useful to evaluate/determine user take profits/stop losses.
Due to these essentially being horizontal levels, they can also serve as potential support/resistances, with breakouts potentially confirming new trends.
In the above example, we set targets 3 ATR's away from the closing price when the price crosses over the script built-in SuperTrend indicator using ATR period 10 and factor 3. Using "Long Position Target" allows setting a target above the price, disabling this setting will place targets below the price.
Users might be interested in obtaining new targets once one is reached, this can be done by enabling "New Target When Reached" in the target logic setting section, resulting in more frequent targets.
Lastly, users can restrict new target creation until current ones are reached. This can result in fewer and longer-term targets, with a higher reach rate.
🔹 Dashboard
A dashboard is displayed on the top right of the chart, displaying the amount, reach rate of targets 1/2, and total amount.
This dashboard can be useful to evaluate the selected target distances relative to the selected conditions, with a higher reach rate suggesting the distance of the targets from the price allows them to be reached.
🔶 DETAILS
🔹 Indicators
Besides 'External' sources, each source can be set at 1 of the following Build-In Indicators :
ACCDIST : Accumulation/distribution index
ATR : Average True Range
BB (Middle, Upper or Lower): Bollinger Bands
CCI : Commodity Channel Index
CMO : Chande Momentum Oscillator
COG : Center Of Gravity
DC (High, Mid or Low): Donchian Channels
DEMA : Double Exponential Moving Average
EMA : Exponentially weighted Moving Average
HMA : Hull Moving Average
III : Intraday Intensity Index
KC (Middle, Upper or Lower): Keltner Channels
LINREG : Linear regression curve
MACD (macd, signal or histogram): Moving Average Convergence/Divergence
MEDIAN : median of the series
MFI : Money Flow Index
MODE : the mode of the series
MOM : Momentum
NVI : Negative Volume Index
OBV : On Balance Volume
PVI : Positive Volume Index
PVT : Price-Volume Trend
RMA : Relative Moving Average
ROC : Rate Of Change
RSI : Relative Strength Index
SMA : Simple Moving Average
STOCH : Stochastic
Supertrend
TEMA : Triple EMA or Triple Exponential Moving Average
VWAP : Volume Weighted Average Price
VWMA : Volume-Weighted Moving Average
WAD : Williams Accumulation/Distribution
WMA : Weighted Moving Average
WVAD : Williams Variable Accumulation/Distribution
%R : Williams %R
Each indicator is provided with a link to the Reference Manual or to the Build-In Indicators page.
The latter contains more information about each indicator.
Note that when "Show Source Values" is enabled, only values that can be logically found around the price will be shown. For example, Supertrend , SMA , EMA , BB , ... will be made visible. Values like RSI , OBV , %R , ... will not be visible since they will deviate too much from the price.
🔹 Interaction with settings
This publication contains input fields, where you can enter the necessary inputs per indicator.
Some indicators need only 1 value, others 2 or 3.
When several input values are needed, you need to separate them with a comma.
You can use 0 to 4 spaces between without a problem. Even an extra comma doesn't give issues.
The red colored help text will guide you further along (Only when Target is enabled)
Some examples that work without issues:
Some examples that work with issues:
As mentioned, the errors won't be visible when the concerning target is disabled
🔶 SETTINGS
Show Target Labels: Display target labels on the chart.
Candle Coloring: Apply candle coloring based on the most recent active target.
Target 1 and Target 2 use the same settings below:
Enable Target: Display the targets on the chart.
Long Position Target: Display targets above the price a user selected condition is true. If disabled will display the targets below the price.
New Target Condition: Conditional operator used to compare "Source A" and "Source B", options include CrossOver, CrossUnder, Cross, and Equal.
🔹 Sources
Source A: Source A input series, can be an indicator or external source.
External: External source if 'External" is selected in "Source A".
Settings: Settings of the selected indicator in "Source A", entered settings of indicators requiring multiple ones must be comma separated, for example, "10, 3".
Source B: Source B input series, can be an indicator or external source.
External: External source if 'External" is selected in "Source B".
Settings: Settings of the selected indicator in "Source B", entered settings of indicators requiring multiple ones must be comma separated, for example, "10, 3".
Source B Value: User-defined numerical value if "value" is selected in "Source B".
Show Source Values: Display "Source A" and "Source B" on the chart.
🔹 Logic
Wait Until Reached: When enabled will not create a new target until an existing one is reached.
New Target When Reached: Will create a new target when an existing one is reached.
Evaluate Wicks: Will use high/low prices to determine if a target is reached. Unselecting this setting will use the closing price.
Target Distance From Price: Controls the distance of a target from the price. Can be determined in currencies/points, percentages, ATR multiples, ticks, or using multiple of external values.
External Distance Value: External distance value when "External Value" is selected in "Target Distance From Price".

Targets For Overlay Indicators [LuxAlgo]The Targets For Overlay Indicators is a useful utility tool able to display targets during crossings made between the price and external indicators on the user chart. Users can display a series of two targets, one for crossover events and another one for crossunder event.
Alerts are included for the occurrence of a new target as well as for reached targets.
🔶 USAGE
In order for targets to be displayed users need to select an appropriate input source from the "Source" drop-down input setting. In the example above we apply the indicator to a volatility stop.
This can also easily be done by adding the "Targets For Overlay Indicators" script on the VStop indicator directly.
Targets can help users determine the price limit where the price might start deviating from an indication given by one or multiple indicators. In the context of trading, targets can help secure profits/reduce losses of a trade, as such this tool can be useful to evaluate/determine user take profits/stop losses.
Due to these essentially being horizontal levels, they can also serve as potential support/resistances, with breakouts potentially confirming new trends.
Users might be interested in obtaining new targets once one is reached, this can be done by enabling "New Target When Reached" in the target logic setting section, resulting in more frequent targets.
Lastly, users can restrict new target creation until current ones are reached. This can result in fewer and longer-term targets, with a higher reach rate.
🔹 Examples
The indicator can be applied to many overlay indicators that naturally produce crosses with the price, such as moving average, trailing stops, bands...etc.
Users can use trailing stops such as the SuperTrend or VStop to more easily create clean targets. Do note that certain SuperTrend scripts separate the upper and lower extremities of the SuperTrend into two different plot, which cannot be used with this tool, you may use the provided SuperTrend script below to have a compatible version with our tool:
//@version=5
indicator("SuperTrend", overlay = true)
factor = input.float(3, 'Factor', minval = 0)
atrLen = input.int(10, 'ATR Length', minval = 1)
= ta.supertrend(factor, atrLen)
plot(spt, 'SuperTrend', dir != dir ? na : dir < 0 ? #089981 : #f23645, 2)
plot(spt, 'Circles', dir > dir ? #f23645 : dir < dir ? #089981 : na, 3, plot.style_circles)
Using moving averages can produce more targets than other overlay indicators.
Users can apply the tool twice when using bands or any overlay indicator returning two outputs, using crossover targets for obtaining targets using the upper band as source and crossunder targets for targets using the lower band. We can also use the Trendlines with breaks indicator as example:
🔹 Dashboard
A dashboard is displayed on the top right of the chart, displaying the amount, reach rate of targets 1/2, and total amount.
This dashboard can be useful to evaluate the selected target distances relative to the selected conditions, with a higher reach rate suggesting the distance of the targets from the price allows them to be reached.
🔶 SETTINGS
Source: Indicator source used to create targets. Targets are created when the closing price crosses the specified source.
Show Target Labels: Display target labels on the chart.
Candle Coloring: Apply candle coloring based on the most recent active target.
🔹 Target
Crossover and Crossunder targets use the same settings below:
Show Target: Determines if the target is displayed or not.
Above Price Target: If selected, will create targets above the closing price.
Wait Until Reached: When enabled will not create a new target until an existing one is reached.
New Target When Reached: Will create a new target when an existing one is reached.
Evaluate Wicks: Will use high/low prices to determine if a target is reached. Unselecting this setting will use the closing price.
Target Distance From Price: Controls the distance of a target from the price. Can be determined in currencies/points, percentages, ATR multiples, or ticks.

Ranges With Targets [ChartPrime]The Ranges With Targets indicator is a tool designed to assist traders in identifying potential trading opportunities on a chart derived from breakout trading. It dynamically outlines ranges with boxes in real-time, providing a visual representation of price movements. When a breakout occurs from a range, the indicator will begin coloring the candles. A green candle signals a long breakout, suggesting a potential upward movement, while a red candle indicates a short breakout, suggesting a potential downward movement. Grey candles indicate periods with no active trade. Ranges are derived from daily changes in price action.
This indicator builds upon the common breakout theory in trading whereby when price breaks out of a range; it may indicate continuation in a trend.
Additionally, users have the ability to customize their risk-reward settings through a multiplier referred to as the Target input. This allows traders to set their Take Profit (TP) and Stop Loss (SL) levels according to their specific risk tolerance and trading strategy.
Furthermore, the indicator offers an optional stop loss setting that can automatically exit losing trades, providing an additional layer of risk management for users who choose to utilize this feature.
A dashboard is provided in the top right showing the statistics and performance of the indicator; winning trades; losing trades, gross profit and loss and PNL. This can be useful when analyzing the success of breakout trading on a particular asset or timeframe.

Fibo Levels with Volume Profile and Targets [ChartPrime]The Fib Levels With Volume Profile and Targets (FIVP) is a trading tool designed to provide traders with a unique understanding of price movement and trading volume through the lens of Fibonacci levels. This dynamic indicator merges the concepts of Fibonacci retracement levels with trading volume analytics to offer predictive insights into potential price trajectories.
Features:
1. Fibonacci Levels: The FPI showcases three prominent Fibonacci levels on both sides of the current price, offering an intricate picture of potential support and resistance levels.
2. Support and Resistance Recognition: Harnessing the power of Fibonacci levels, the FPI provides traders with potential areas of support and resistance, aiding in informed decision-making for entries, exits, and stop placements.
3. Customizable Timeframe Settings: In order to cater to different trading strategies and styles, users can manually select their preferred timeframe for the Fibonacci calculations, ensuring optimal relevance and accuracy for their trading approach.
4. Volume Analytics: One of the standout features of the FIVP is its ability to calculate trading volume for every bar that is sandwiched between the top and lower Fibonacci levels. This ensures traders have a clear vision of where the majority of trading activity is occurring, lending weight to the credibility of the displayed support and resistance zones.
5. Volume-Derived Price Targeting: The Possible Target Arrow function is an innovative feature. By analyzing and comparing the trading volume in the bearish and bullish zones, it provides an arrow indicating the potential direction the market might take. If the bull volume surpasses the bear volume, the market is likely skewing bullish and vice versa.
Usage
Ideal for both novice and seasoned traders, the FPI offers a rich tapestry of information. It allows for refined technical analysis, more precise entries and exits, and a holistic view of the interplay between price and trading volume. Whether you're scalping, day trading, or swing trading, the Fibonacci Profile Indicator is designed to enhance your trading strategy, providing a comprehensive perspective of the market's potential movements.

Algo Targets [Premium]The Algo Targets indicator includes a suite of tools that attempt to identify market maker liquidity targets in advance.
These levels can be used by traders to determine:
1. future support/resistance
2. entries/exits
3. directional bias
4. potential reversal levels
5. pullback targets
The script uses a proprietary prediction model based on specific candle sequences, historical moves and volatility projections.
These tools have been live tested across a variety of instruments and timeframes, but should be backtested against your preferred ticker for best performance.
Primary Features:
1. Anchors
Anchors are derived from a simple, but powerful, three-candle breakout pattern. We have found that this pattern, when combined with the relative position to previous Anchor patterns on the chart, gives us clues to predicting future price structure.
Common use case: The simplest way to trade Anchors is to know that price *almost always* makes a return visit. This can be a useful tool for reversal traders. Additionally, Anchors often occur just before strong directional momentum. This can be useful for trend traders looking for entry signals.
Power User feature: Projected Ranges can be enabled in Settings. Each Anchor provides a Retracement leg (measured as the midpoint between the last two Anchors) and an Expansion leg (measured as twice the size of the Retracement leg, projected in the opposite direction). If Projected Ranges are enabled, the directional bias is also highlighted within the range, making it easy to spot at a glance.
Caveats: Expansion legs require patience and solid risk management. Additionally, the Expansion leg contains an additional Trigger level which price MUST cross before we consider the Expansion leg to be "in play" as a valid price target. This Trigger is marked on each Expansion legs as a dotted line.
Please note, Anchors require a 3 candle lookback before they are printed to the chart.
2. Target Zones
Target Zones are an advanced feature, and can be enabled in the Settings panel.
Each Target Zone consists of three levels:
Trigger — This the level closest to the current price. We expect it to act as a support/resistance level until price breaks through.
Target — This is the level farthest from the price. This is how far price is likely to move AFTER crossing the Trigger.
Midpoint — This is the level between the Trigger and Target. If price enters a Target Zone and wicks off of the Midpoint line, it’s usually a reversal signal. In this case we would cut our trade, consider the Target “filled” and potentially enter a reversal trade.
Common use case: When prices crosses a Trigger into a Target Zone, we consider that Target level to be “unlocked.” Our expectation is that price will gravitate toward the Target.
Power User feature: There are many strategies that a trader can build around Target Zones. One of our favorites is to use Targets strictly as reversal entries. On ranging days, price will often wick off of a Target level, before making a quick move in the opposite direction.
Caveats: After a Target is unlocked, it may be reached within the next few bars, or it may be saved by the market algorithms for later. Keep an eye on the Midpoint for potential reversals, and as always, proper risk management is key.
IMPORTANT: The presence of a Target Zone on the chart is neither bullish not bearish by itself. We consider the Target to be in play if, AND ONLY IF, price has crossed the Trigger level.
3. Pullback Levels
Pullback Levels are algorithmically detected return levels. They usually act as a strong draw on price, and often appear just before a pullback in price.
Common use case: The simplest way to use Pullbacks is to look for ones that have not been filled, either from a previous day or in after-hours/pre-market. We use them for confirmation bias along with Anchors and unlocked Targets.
Power User feature: For day trading, we set Alerts on our favorite tickers for any detected Pullbacks on the 5 min chart. This usually gives us plenty of time to review the chart for a possible day trade entry.
Settings:
All features are customizable, including color, line length and visibility. This lets you keep your chart as clean as you like, while only displaying additional data when it is needed.
Alerts:
Alerts can be set for all features, with the ability to set bearish and bullish alerts separately, depending on your trading preference. It is recommended to use "Once Per Bar Close" when you create an alert.

EMAflowPRO -Ranges-DISCLAIMER: Always, please keep in mind that market conditions change, past results cannot guarantee the same results in the future.
EMAflowPRO - Ranges-
EMAflowPRO ranges indicator will detect key movements in the market that fit certain conditions and based on that create key tradable zones by providing dynamic and static range levels.
Before reading further please take a look at the indicator values names on the right in the main chart above - these names are linked to the content below when we talk about range structure. The examples included in charts are linked to the area we're discussing (if something was said - most likely closest chart demonstrates it - Also arrows present entries; can be limit or can be market buy/sell in to the wicks.)
Let's find out what indicator does...
Static range logic:
Indicator uses combination of market timing indicators (counting relationship between candles) , fisher transform, stoch rsi, bollinger bands to detect important market price action that show strenght - based on that it will project a static range where key goal is to predict where market will be extremely oversold, extremely overbought or where market could change bias etc.
The setups it provides are very similar to those that come out of harmonic patterns - but it was developed with unique approach without knowing what harmonic patterns are.. so it's not completly the same.
Range is represented by 3 tradable areas (actual trade ideas on charts - arrow points towards a level - on the right there is a scale with a number- limit order can be placed there )
Top of the range - It serves as a shorting area or if top is converted to support can also signal a potential breakout or start of new trend.
Example of a short the top of the range:
29732 - is area where wicks can be sold in to , or limit sell is placed - with higher leverage sl should be tight, with lower sell orders can be spread out up to the middle with sl just above 30500, targets can be choosen based on the provious range top as % moves point.
Example of longing the levels on the recent rise - price staying above middle of the top of the range keeps bias on the upside and potentially signals a break out or start of new trend
Uppper, Middle, Lower part of the range: Sideway area - middle of the range decides direction , above favors the upper levels , below favors the lower levels.
Very nice example where white line is middle of the range and shows that even in strong trend - range projection is able to accurately predict key pullback areas that provide substantial gain. See image below - again settign limit orders where middle of the range is allows you to get a comfortable entry with very big risk reward ratio.
Bottom of the range - market is extremely oversold
Spx example of our recent range from last year's summer - again chart includes both EMAflow indicator and EMAflow ranges as all indicators are extremely complementary and present two sides of the medal sideway and trend view.
Chart only contains ranges but shows the same pair and time:
If price goes below middle of the bottom of the range it could signal a break down or start of new bearish trend.
Dynamic range logic
Since sometimes static range gets broken out or is not respected and the price action is not yet sufficient to generated a new one we included a dynamic supply demand part where dynamic range is generated working in a similar way but does add clarity when static range fails.
example of this can be seen when ftx caused a btc dump we broke through the bottom of the range but dynamic range later showed us new bottom we could trade.
Confluence between both can also provide even more sure levels to place limit orders or to market buy or sell when wicks in to that area occurs.
Minuses:
Since ranges tend to work best when market is sideway - a second part is recommended with EMAflowPRO where focus on moving averages helps you navigate stronger trends.
Not all tfs are well synced with ranges on various assets so you will need to flip through few ones to find the best timeframes that historically worked the best - if you come across an asset that doens't look good you should just change timeframe to higher until you see something that fits or change asset until you get something that looks clear.
Settings:
EMAflow - Ranges - allows you to preset minimum potential of a trade setup you want to look for - default is 6% that ensures you can get a good setup on lower and higher tfs.
