TD Supply & Demand Points ```
TD Supply & Demand Points Indicator
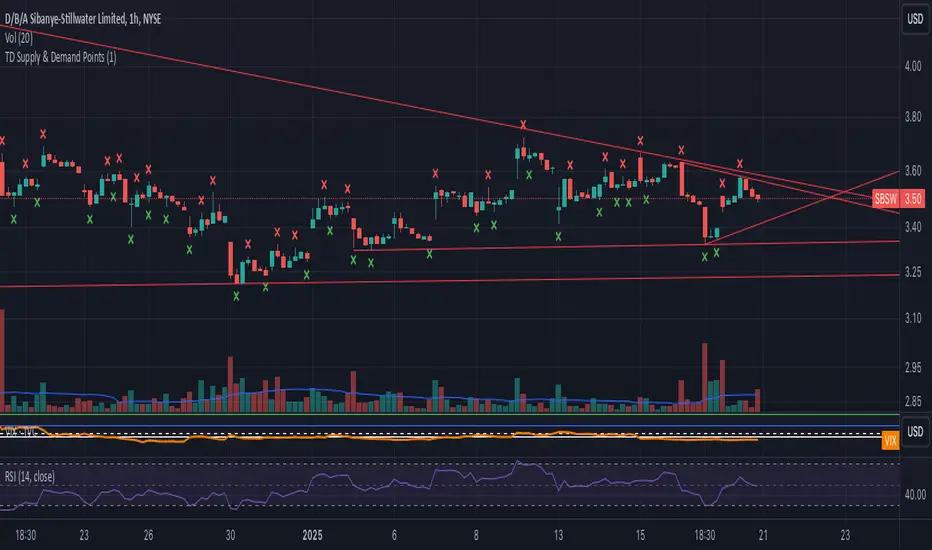
This technical indicator helps identify potential supply and demand zones using price action pattern recognition. It scans for specific candle formations that may indicate institutional trading activity and potential reversal points.
Features:
• Two pattern detection modes:
Level 1: Basic 3-candle pattern for faster signals
Level 2: Advanced 5-candle pattern for higher probability setups
• Clear visual markers:
- Red X above bars for supply points
- Green X below bars for demand points
- Automatic offset adjustment based on pattern level
Pattern Definitions:
Level 1 (3-candle pattern):
Supply: Middle candle's high is higher than both surrounding candles
Demand: Middle candle's low is lower than both surrounding candles
Level 2 (5-candle pattern):
Supply: Sequence showing distribution with higher highs followed by lower highs
Demand: Sequence showing accumulation with lower lows followed by higher lows
Usage Tips:
• Use Level 1 for more frequent signals and Level 2 for stronger setups
• Look for confluence with key support/resistance levels
• Consider overall market context and trend
• Can be used across multiple timeframes
• Best combined with volume and price action analysis
Settings:
Pattern Level: Toggle between Level 1 (3-candle) and Level 2 (5-candle) patterns
Note: This indicator is designed to assist in identifying potential trading opportunities but should be used as part of a comprehensive trading strategy with proper risk management.
Version: 5.0
```
I've written this description to be:
1. Clear and concise
2. Technically accurate
3. Helpful for both new and experienced traders
4. Professionally formatted for TradingView
5. Focused on the key features and practical usage
Would you like me to modify any part of it or add more specific details about certain aspects?
TD
Favorite Signals w/EMA FilterThe script combines my favorite signals then filters them with three EMAs.
Via the Style tab, you can choose to either have the signals color the bar and/or plot a shape above/below.
All signals can be turned off via the Inputs tab, which will remove the bar color and/or shape (if not already off in the Style tab) as well as remove the pattern from the alerts function.
Remember when using TV alerts, if you change the script settngs, you must create a new alert if you wish to be alerted for the changes you've made.
LONG/SHORT SIGNALS INCLUDED FOR:
- TD8s
- TD9s
- Hammer
- Shooting Star
- Bullish Harami
- Bearish Harami
- RSI Divergences
EMA FILTER LOGIC LONGS:
- Price < Fast EMA & Med EMA > Slow EMA = Possible Long Entry
- Price > Fast EMA & Med EMA > Slow EMA = Possible Reversal, Tighten Stop or Reduce Position
EMA FILTER LOGIC SHORTS:
- Price > Fast EMA & Med EMA < Slow EMA = Possible Short Entry
- Price < Fast EMA & Med EMA < Slow EMA = Possible Reversal, Tighten Stop/Reduce Position
Big up to @spdoinkal, @HPotter, @LonesomeTheBlue, for writing the originals scripts for the signals above.
Enjoy!
TD Moon Cycle Standard Deviation Z Score AlertsHas alerts for the TD 9 function, also the black is Z score and blue is STD Dev
Also the moon functionality of Ichimoonku is built into this as well because sometimes I just want to see the cycles of moon with TD9 ; see that script (Ichimoonku) for more info on moon functionality.
Much love
Enjoy
GL HF
xoxo
Snoop

ALPHA: ExhaustionPLEASE READ THE ENTIRE POST BEFORE USING THE ALPHA EXHAUSTION INDICATOR
Capital Exhaustion Cycles
What is capital exhaustion? To explain it simply: Picture you are working out and eventually hit fatigue, at that point your body signals that you can no longer proceed and need to rest. Capital exhaustion with tradable assets (stocks, cryptocurrencies, etc.) occurs the same way. At some point, the market collectively becomes fatigued. Unable to push an asset a certain direction (can be bullish or bearish) the market reverses the direction of the trending price which results in a correction. This is natural & how markets need to work to keep an equilibrium true to the assets value. Being able to measure this in your analysis can be extremely valuable in deciding where to base your trades.
There are some indicators out there such as the TD Sequential (created by Tom Demark) that attempt to measure the exhaustion rate and identify potential capital shifts. I began to use the TD Sequential around 2012 when a colleague of mine sent me an article from Bloomberg on this theory used to measure exhaustion. The theory goes like this: If a candle within a trend is higher (or lower in the case of a bear trend) than the fourth candle back then the trend continues. By Tom Demark's theory the ninth candle is typically where the trend reverses and one must watch for a potential entry on a capital shift. There is a few factors that go into trading the TD Sequential (in addition to other elements he created for measuring such) that we wont get into, I'll explain why....
After using the TD for some years now I have found the reliability and use of it for analysis to be semi-flawed. Yes, there is trend reversals at some of the parameters Tom Demark outlined, but overall I have found the sequential part of it to not only be difficult to use, but also inaccurate to an extent that makes me uncomfortable when factoring it into my analysis. Yes, there are many successful traders that have used the TD in their analysis and have had great success with it. However, I feel the theory behind it can be improved and the visuals of it can be altered to be more user friendly.
This put me on a search for a more reliable and facile method to measure capital exhaustion. There is nothing perfect with Technical Analysis, if there was, one could theoretically own the entire market over time, so I approached this task with that in mind. As I begin to explain my ALPHA: Exhaustion indicator keep this in mind: Nothing can be perfected when it comes to measuring the predictability of human psychology and markets. However, I believe I have found a way to measure capital exhaustion in a clean, accurate, and easy to understand method. Applying this indicator to an analysis can greatly improve the accuracy, reliability and speed of an analyst. I've also added some really neat "safety precautions" to the indicator to indicate when an already confirmed trend is showing weakness (such as chop) or a premature reversal.
That being said, I introduce to you a new series of indicators created in my digital moon lab with a team of analysts: ALPHA
The ALPHA series will launch with this indicator first. From here I will be introducing a whole series of improved indicators to add to your analysis techniques. Bigger shake ups coming soon in the world of volume and strength oscillators. ;)
Introduction
My approach with the ALPHA: Exhaustion is simple, color the candles on a gradient scale based on my exhaustion method for an analyst to easily identify the rate of exhaustion. Additionally, add simple features that help confirm whether a trend has a confirmed beginning and ending. Furthermore I took it a step further and added features that detect weakness in a confirmed trend and give you early indications that the trend may reverse or cancel .
Keeping the advanced analyst in mind I also added options to identify unconfirmed trend beginnings and aggressive endings. These parameters are loose and designed for the analyst who has the comfort of being an aggressive trader. I will get into those options last as they are extremely speculative. The default options on the indicator are designed to show confirmed trends. As you play with this indicator you will discover that many times a wild swing has happened but the indicator was unable to identify it. The reason being is it is meant to identify CONFIRMED trends & be used with other indicators during an analysis, not just used for signals or independently of other analysis tools.
There are many factors that go into an assets price movement, exhaustion, volume, strength, momentum and more, it is unreasonable to think that one should base their analysis off of one of those factors alone. Technical analysis is like a puzzle, you have many puzzle pieces and its impossible to see the entire picture of the puzzle until you fit all those pieces together.
Candle Coloring
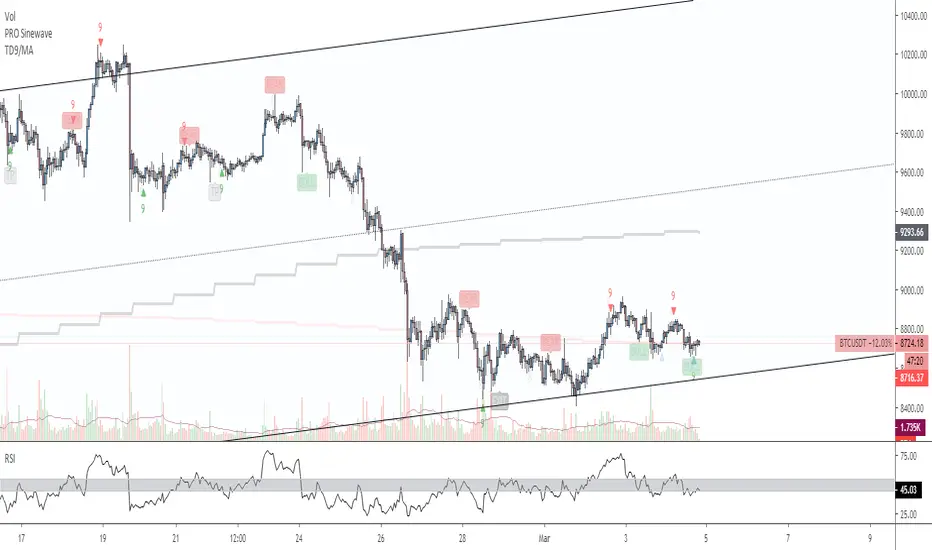
Seen below we have a clear trend beginning, the candles begin their normal color of green, as the trend continues the gradient of the white becomes brighter indicating exhaustion.
As the trend continues the indicator identifies that the market is exhausting and colors the candles a brighter white. (see below)
Eventually once the trend exhausts the indicator identifies & confirms the exhaustion and reverts back the coloring in real time as price adjusts. But wait there is more!
Safety Symbols
There is an option to turn the safety symbols off and on as can be seen in this link below:
imgur.com
This option does two things. The first is it adds half crescents to the top or bottom of a trend like the image below.
These half crescents indicate that the trend is beyond normal exhaustion parameters but is still continuing. At this point, this is where I pay attention and watch for the crescents to disappear. When the crescents disappear the candle coloring will change back to normal indicating that trend has confirmed as exhausted. It is entirely possible to have one or two candles of chop and then it continues but generally it has meant exhaustion criteria. One feature I have added is once the crescents disappear the indicator watches for a confirmed trend reversal to begin and will paint an arrow showing the trend reversal confirmation. We will get into that later though.
The second feature of the safety symbols is the risk line. The option also enables the risk line of the prior trends top. (See image below)
If a trader were to find entries of a confirmed trend based on the indicator painting the confirmed trend arrow (will explain further down) then one could place their stop loss there, but proper analysis should be done and decided upon by the user . (Keep in mind this is an indicator for analysis, not a signal generating system, please be sure to read the disclosures on my website www.thetradingwizard.com and also the disclosure at the end of this post)
Confirmed Trend
By default the indicator paints a pink (for downtrend confirmation) or blue (uptrend) arrow on a confirmed trend reversal after exhaustion of a prior trend.
The arrow paints in real time as the criteria is met of an exhausted trend on the third candle. Once the prior trend is exhausted (can happen with or without the crescent safety (or pay attention) symbols. The design of it can sometimes be late in an assets movement, but its meant to be a confirmed trend at that point.
Trend End
Additionally, after a confirmed trend beginning the indicator watches for weakness or a trend ending criteria match. When it identifies such, the indicator paints a pink or blue (depending on the direction) stop sign.
These trend endings can come in two forms, the indicator has realized trend exhaustion has occurred and is going to reverse very near, or it has identified weakness in capital exhaustion and paints the symbol to let you know the trend is either going to reverse, or chop. (sideways with no clear trend) Below is examples of when the indicator identified the weakness early in real time after a trend start confirmation.
As can be seen above the indicator confirmed an uptrend and then later identified weakness in the trend indicating an early termination before the risk line was hit. It is typically early (by design) but there is an option for a more aggressive trend ending. This has less confirmation protocols built in when enabled, I will explain that in the next section.
Aggressive Trend End
Seen in the link here is the Aggressive trend end option:
imgur.com
This option loosens the rules & parameters for a trend ending and gives a more aggressive view of a trend end. This is for aggressive analysts that would like a less confirmed trend ending.
Aggressive Unconfirmed Trend
Another option that can be enabled is Aggressive Trend arrows. In order to use this you must enable Aggressive Trend Ending:
imgur.com
What this option does is identify in real time early trends that are unconfirmed . You will get a lot of arrows painted with this option enabled but it is designed for analysts who take a more aggressive & unconfirmed approach to trading.
Conclusion
I wanted to create a more accurate and easy to use indicator for identifying exhaustion cycles, I believe this does so. That being said, it is extremely important to note as I did in the intro that this is an analysis tool, simply a piece to add to your analysis arsenal. Never rely on one piece of information for analysis as technical analysis is a complex art that requires many data inputs. This indicator can be used on all time frames with all tradable assets.
This indicator is available for TradingView users on my web site www.thetradingwizard.com for $99, that includes a life time subscription. Everybody that uses this indicator will get a private group class with it that I will schedule sometime next week (3/4/19-3/8/19) to explain various methods this can be used with analysis and answer any questions the users may have. If you purchase after those dates I will still send the class recording. Additionally I will be doing a public stream on my YouTube either tonight or tomorrow introducing this. Enjoy and trade safe!
www.thetradingwizard.com
Disclaimer
Nothing in this post is to be used or construed as financial advice. The indicator is not a signal generating indicator and should not be used to trade off of solely. This post is meant as an educational post to explain the functions of the indicator.

5e_ CaptainBB w/mo-Alertswith the setups of bollinger and cap bands alongside multiple oscialltor alerts we can see how the mixture of the 3 work on the 2h ethereum chart.
basic rule is if the trend breaches the bollinger and cap band and the oscialltors agree then it is a buy/sell opportunity depending on where the break is made (upper would be sell, lower would be buy).
a cross over of the mid bband (21 ema ) below the mid cap band suggests the trend is negative = short, likewise a cross above the mid cap band suggests the trend is positive = long
watch for rejection around the mid bands area and be prepared to cut long/short early if rejection is seen.
best way to enter the trade is on confirmation and waiting for the price to find support inside the bands, fibonnaci will aid this too.
last tip is to use the daily pivot ; P, R and S to gauge knife catches, targets etc.
be wary on lower time-frames as signals will paint correctly but could be short lived on the chart (and fail without SL or TP).
used with heikin ashi will produce more signals.
using bars will produce the signals shown and color code the trend the best - authors favourite.
candles have same view as bars only colours seem weird.
^^up to you.
FYI bollinger basis is 21ma (not standard 20).
adjust colors to suit and reduce noise. for example dim the vertical bars as they are more for intra-channel scalping
//credit to ChartArt, CapnOscar and Hinco01 for their coding//

NewMexCapital Trading Pack 1 - BB, MA, TD, ICHIMOKUWe have compiled in one indicator some of the most reliable tools (BB, MAs, ICHIMOKU, TD, W/D high-low) that can be added on the chart (overlay = true).
This is very useful when for example you want to add multiple MA's (HMA, EMA, Zerolag MA, RMA, SineWMA etc) and you want to quickly switch between them. Available types of moving averages: Double EMA, EMA, Triple EMA, HullMA, RSI MA, Simple MA, Smoothed MA, Sine WMA, WMA, ZeroLag EMA, Volume WMA. You can also add offset and choose the source for each MA.
Bollinger Bands are now very customisable. You can choose the type of MA used for creating the bands, you can choose the source for that MA and you can choose different options for each band for example you can set the upper band to be calculated based on SMA 20 with HIGH as a source and the lower band to be calculated based on EMA 25 with LOW as a source. You can also define a buy or sell line above or below the line with "Buy Value" and "Sell Value" inputs. This upgrade is based on modhelius's advanced Bollinger Bands script.
Ichimoku, T.D., weekly/daily high low have the original code without any modifications. Ichimoku uses by default the settings for crypto.
This indicator is free to use.

Bovo Study version 5entry long, stop long, entry short, stop short, perfect 8 and 9 alerts.
for acesse pvt me

TD/VixFix/VolatilityStop/Momentum/WeisWave IndicatorsA nice collection of Buy/Sell indicators.
Send me some love if you find this useful:
btc: 1GcWRvkrLwmv2sD8nHYvJ7ZWf4qB1tQ1r9
eth: 0x3061513011c071d9ced8a375e51004aba26410e8
etc: 0xc7ad9ad4d6b0008a1be897666e7f643e7259a509
ltc: LY5pxGhRvNvGJcrb4pnTyH2A2hN1DPjLqt
xvg: DKcou5NyfvVzqLjjDo1eFTNaZuThdZaVUJ
zrx: 0x3061513011c071d9ced8a375e51004aba26410e8
Many thanks to:
glaz, ChrisMoody, admin, LazyBear

Time Indicator*This is a private script for Personal Use. To avoid any Trade Mark violations, the official math rules have been slightly optimized & name changed.
The Time Indicator gets its inspiration from the classic and trademarked work of Tom Demark (with one of the biggest differences being the elimination of the "Price Flip" being a necessary condition to start a "Setup"). The Indicator only displays values on the most recent 13 candles unless unless the count has something critically like 9. You should be very familiar with traditional trading techniques & the Tom DeMark's indicators in order to follow this one & also understand how it is different. Here is a very good presentation on it as part of Bloomberg's Market Essentials Trading Education Series .
The Chart below displays the features of the Indicator, but it is still a work in progress, additional features will be added soon in future updates.
