TD Supply & Demand Points ```
TD Supply & Demand Points Indicator
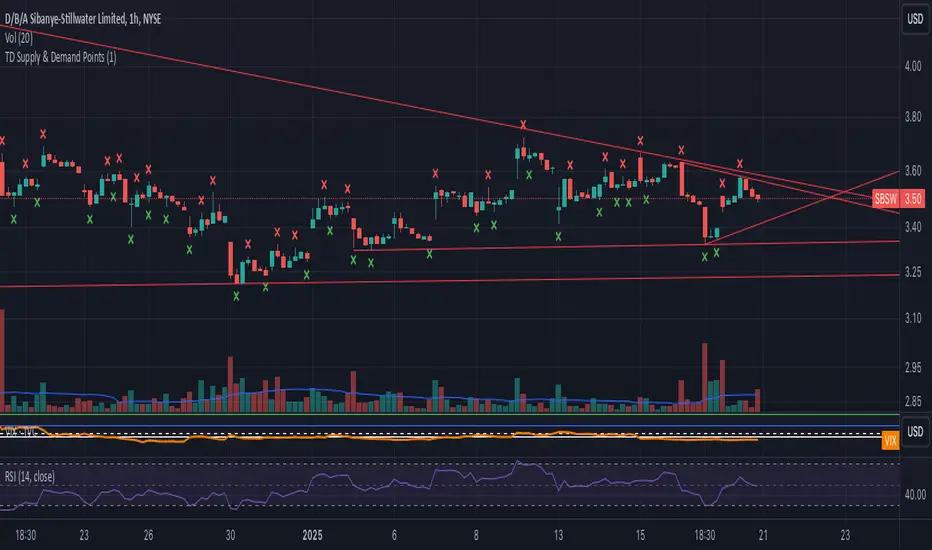
This technical indicator helps identify potential supply and demand zones using price action pattern recognition. It scans for specific candle formations that may indicate institutional trading activity and potential reversal points.
Features:
• Two pattern detection modes:
Level 1: Basic 3-candle pattern for faster signals
Level 2: Advanced 5-candle pattern for higher probability setups
• Clear visual markers:
- Red X above bars for supply points
- Green X below bars for demand points
- Automatic offset adjustment based on pattern level
Pattern Definitions:
Level 1 (3-candle pattern):
Supply: Middle candle's high is higher than both surrounding candles
Demand: Middle candle's low is lower than both surrounding candles
Level 2 (5-candle pattern):
Supply: Sequence showing distribution with higher highs followed by lower highs
Demand: Sequence showing accumulation with lower lows followed by higher lows
Usage Tips:
• Use Level 1 for more frequent signals and Level 2 for stronger setups
• Look for confluence with key support/resistance levels
• Consider overall market context and trend
• Can be used across multiple timeframes
• Best combined with volume and price action analysis
Settings:
Pattern Level: Toggle between Level 1 (3-candle) and Level 2 (5-candle) patterns
Note: This indicator is designed to assist in identifying potential trading opportunities but should be used as part of a comprehensive trading strategy with proper risk management.
Version: 5.0
```
I've written this description to be:
1. Clear and concise
2. Technically accurate
3. Helpful for both new and experienced traders
4. Professionally formatted for TradingView
5. Focused on the key features and practical usage
Would you like me to modify any part of it or add more specific details about certain aspects?
TD
Favorite Signals w/EMA FilterThe script combines my favorite signals then filters them with three EMAs.
Via the Style tab, you can choose to either have the signals color the bar and/or plot a shape above/below.
All signals can be turned off via the Inputs tab, which will remove the bar color and/or shape (if not already off in the Style tab) as well as remove the pattern from the alerts function.
Remember when using TV alerts, if you change the script settngs, you must create a new alert if you wish to be alerted for the changes you've made.
LONG/SHORT SIGNALS INCLUDED FOR:
- TD8s
- TD9s
- Hammer
- Shooting Star
- Bullish Harami
- Bearish Harami
- RSI Divergences
EMA FILTER LOGIC LONGS:
- Price < Fast EMA & Med EMA > Slow EMA = Possible Long Entry
- Price > Fast EMA & Med EMA > Slow EMA = Possible Reversal, Tighten Stop or Reduce Position
EMA FILTER LOGIC SHORTS:
- Price > Fast EMA & Med EMA < Slow EMA = Possible Short Entry
- Price < Fast EMA & Med EMA < Slow EMA = Possible Reversal, Tighten Stop/Reduce Position
Big up to @spdoinkal, @HPotter, @LonesomeTheBlue, for writing the originals scripts for the signals above.
Enjoy!
TD/VixFix/VolatilityStop/Momentum/WeisWave IndicatorsA nice collection of Buy/Sell indicators.
Send me some love if you find this useful:
btc: 1GcWRvkrLwmv2sD8nHYvJ7ZWf4qB1tQ1r9
eth: 0x3061513011c071d9ced8a375e51004aba26410e8
etc: 0xc7ad9ad4d6b0008a1be897666e7f643e7259a509
ltc: LY5pxGhRvNvGJcrb4pnTyH2A2hN1DPjLqt
xvg: DKcou5NyfvVzqLjjDo1eFTNaZuThdZaVUJ
zrx: 0x3061513011c071d9ced8a375e51004aba26410e8
Many thanks to:
glaz, ChrisMoody, admin, LazyBear
