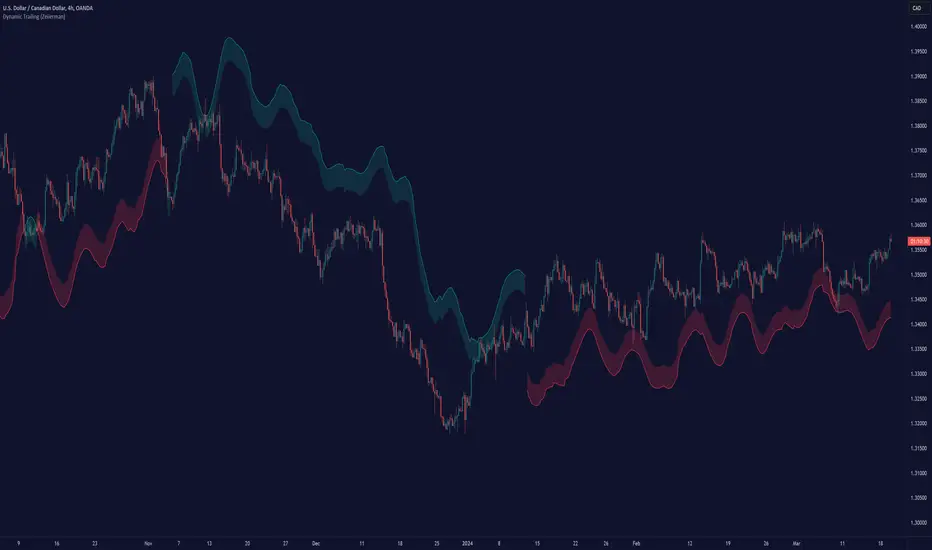
Dynamic Trailing (Zeiierman)█ Overview
The Dynamic Trailing (Zeiierman) indicator enhances the traditional SuperTrend approach by providing a more nuanced, adaptable tool for trend analysis and market volatility assessment. It combines techniques to identify dynamic support and resistance levels, trend directions, and market volatility. By integrating the Average True Range (ATR) with a unique multiplier system and smoothing mechanisms, this indicator offers a nuanced approach to trend-following strategies, making it a valuable asset for traders looking to leverage SuperTrend methodologies with additional insights into market dynamics.
█ How It Works
At its core, this indicator builds on the traditional SuperTrend formula by utilizing a modified ATR calculation to define the deviation for dynamic support and resistance levels. These levels are dynamically adjusted based on market volatility. The innovation lies in the addition of the Hull Moving Average (HMA) and the Triple Exponential Moving Average (TEMA) for an enhanced smoothing effect, making the indicator's trend signals more reliable and less prone to market noise. The trend direction is determined by comparing the closing price with the dynamic levels, facilitating clear bullish or bearish signals.
The indicator incorporates a 'Supertrend' function, which uses the dynamic levels and the price’s position relative to them to determine the trend direction. This determination is visualized through color-coded lines and a cloud zone, which expands or contracts based on the ATR and a user-defined width setting, illustrating the market's volatility and trend strength.
ATR Calculation: Utilizes the Average True Range (ATR) to measure market volatility. The ATR is a cornerstone of this indicator, helping to dynamically adjust the support and resistance levels according to the market’s changing conditions.
Supertrend Calculation: Implements a supertrend formula that combines the ATR with user-defined multipliers to plot potential trend directions. This feature helps in identifying whether the market is in an uptrend or downtrend, offering visual cues for potential reversals.
TEMA Calculation: Employs the Triple Exponential Moving Average (TEMA) through a Hull Moving Average (HMA) calculation to smooth out price data. This smoothing process helps in reducing market noise and makes the trend direction clearer.
Dynamic Support and Resistance: Calculates dynamic support and resistance levels by applying a deviation (derived from the ATR and user-defined multiplier) to the smoothed price data. These levels adapt to market conditions, providing areas where price might experience support or resistance.
Trend and Cloud Calculation: Determines the overall trend direction and plots a 'Cloud' zone around it, which adjusts in width based on the ATR and a user-defined cloud width setting. This cloud acts as a visual buffer, indicating the strength and stability of the current trend.
█ How to Use
Trend Identification: The primary function of this indicator is to help traders quickly identify the prevailing market trend. A change in the color of the dynamic trailing line or its position relative to the price can signal potential trend reversals.
Dynamic Support and Resistance: Unlike static levels, the dynamic levels adjust with market conditions, providing current areas where the price might experience support or resistance.
Dynamic Support
Dynamic Resistance
█ Settings
Mult (Multiplier): Adjusts the multiplier for the ATR calculation, affecting the deviation distance for support and resistance levels. Higher values decrease sensitivity and vice versa.
Len (Length): Sets the period for the HMA in the TEMA calculation, influencing the indicator's responsiveness to price changes.
Smoothness: Determines the smoothness of the dynamic support and resistance lines by setting the SMA length. Higher values result in smoother lines.
Cloud Width : Modifies the width of the cloud, providing a visual representation of market volatility.
Color Settings (upcol and dncol): Allows users to customize the colors of the indicator's lines and cloud, aiding in visual trend identification.
-----------------
Disclaimer
The information contained in my Scripts/Indicators/Ideas/Algos/Systems does not constitute financial advice or a solicitation to buy or sell any securities of any type. I will not accept liability for any loss or damage, including without limitation any loss of profit, which may arise directly or indirectly from the use of or reliance on such information.
All investments involve risk, and the past performance of a security, industry, sector, market, financial product, trading strategy, backtest, or individual's trading does not guarantee future results or returns. Investors are fully responsible for any investment decisions they make. Such decisions should be based solely on an evaluation of their financial circumstances, investment objectives, risk tolerance, and liquidity needs.
My Scripts/Indicators/Ideas/Algos/Systems are only for educational purposes!
Triple Exponential Moving Average (TEMA)
EMA Scalp Alerts by Sabir KhanThis TradingView indicator, developed by Sabir Khan, is designed for scalping strategies based on Exponential Moving Averages (EMAs). The indicator visually represents three EMAs with customizable parameters and provides alerts for potential trading signals.
Key Features:
Fast EMA: User-configurable fast EMA with default period set to 21.
Slow EMA: User-configurable slow EMA with default period set to 55.
Third EMA: User-configurable third EMA with default period set to 200.
Line Width: Adjustable line width for the fast and third EMAs, allowing customization for better visibility.
Color Customization: Choose colors for each EMA to suit your chart preferences.
Alerts: Automatic alerts for potential trading signals:
Long Signal: Triggered when the fast EMA crosses above the slow EMA.
Short Signal: Triggered when the fast EMA crosses below the slow EMA.
All EMAs Crossover: Triggered when all three EMAs cross over, indicating a potentially strong trend.
Usage:
Users can observe the visual representation of the three EMAs on the chart.
Alerts are generated for potential long, short, or strong trend signals based on EMA crossovers.
The indicator's parameters, including EMA periods, line widths, and colors, are customizable to fit individual preferences.
Alert Message Format:
The alert message provides essential information about the detected signal, including the signal type (Long, Short, None), the involved symbol, timeframe, open, close, high, low, and whether a strong crossover is detected.
Note: This indicator is particularly suitable for traders employing scalp trading strategies focusing on short-term market movements.
*Disclaimer: Trading involves risk, and users should conduct their own research and analysis before making any trading decisions based on this indicator.*

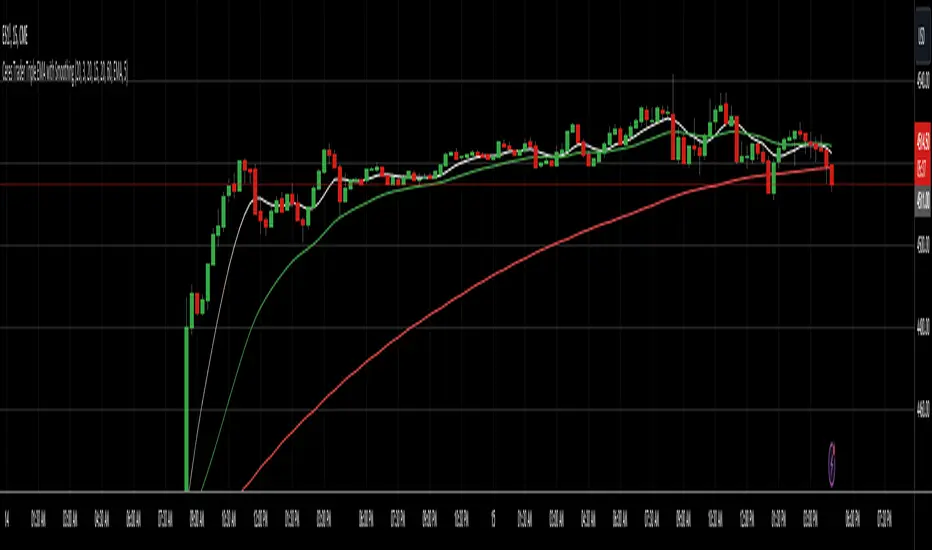
Ceres Trader MTF Triple EMA with SmoothingDescription:
The "Ceres Trader MTF EMA with Smoothing" indicator is a versatile tool designed for traders who rely on Exponential Moving Averages (EMAs) for their technical analysis. This indicator uniquely blends the concept of EMAs with customizable smoothing techniques, enhancing the clarity and interpretability of moving average lines on your charts.
Features:
Triple EMA Visualization: Visualize three distinct EMAs on your chart, each customizable in terms of length, timeframe, and color. This triple-layer approach allows for a comprehensive view of price trends across different time periods.
User-defined EMA Lengths: Set the lengths of all three EMAs according to your trading strategy. The default length is set at 20 bars, but this can be easily adjusted to suit different trading styles and timeframes.
Flexible Timeframes: Each EMA can be plotted based on different timeframes, providing a multi-timeframe analysis within a single chart view.
Smoothing Techniques: Choose from five different smoothing methods (SMA, EMA, SMMA, WMA, VWMA) to refine the EMA lines. This feature reduces market “noise” and helps in identifying the true underlying trends.
Enhanced Smoothing for Longer Timeframes: The indicator applies an advanced double smoothing technique to the EMA of the longest timeframe, offering an even smoother line that is beneficial for long-term trend analysis.
Customizable Aesthetics: Personalize the appearance of each EMA line with a selection of colors, enhancing visual differentiation and readability.
Benefits:
Versatility: Suitable for various trading styles, including swing trading, day trading, and long-term trend following.
Clarity in Trend Analysis: The smoothing techniques help in filtering out market noise, making it easier to identify meaningful trends.
Multi-Timeframe Analysis: The ability to view EMAs from different timeframes simultaneously offers a comprehensive analysis, saving time and enhancing decision-making.
Ideal for: Traders looking for a customizable and insightful way to use EMAs in their market analysis. Whether you are a beginner or an experienced trader, this indicator's flexibility and depth can add significant value to your technical analysis toolkit.
Triple Moving Averages + RSI Divergence + Trade Creator [CSJ7]This indicator uses triple moving averages to identify the prevailing trend, and calculates the linear regression of the closing price, and of the RSI, to either confirm the current trend direction, or to identify a potential trade reversal. Additionally, it includes a trade management tool that allows you to rate your trade setup according to your selected entry minimums and preferences, plus you obtain an estimated P&L with profitability metrics of your trade.
The key features are:
Dashboard : Includes entry/exit amounts, prices, quantities, estimated Profit & Loss, ROI, ROE, RRR, insights into market trends, entry conditions, and operational logs.
Trade Setup : Allows you to design your trade in detail. Select entry/exit levels, and let the tool suggest optimal target levels based on your ROI and RRR preferences. Specify your desired stop-loss type, and the tool will present the corresponding price.
Entry Conditions Management : Customize your trade entry prerequisites within the settings. The system evaluates these, offering a Trade Rating and displaying current values and entry statuses in the Entry Conditions table.
Trade Box : Visualize your trade strategy with a trade box that shows in alongside your chart, highlighting potential profit/loss zones and entry price points.
RSI & Close Price Linear Regressions : Calculates the linear regression of RSI and the close prices, since the beginning of the current trend, and presents them directly in the chart and alongside the active trend, to allow you to spot a potential trend continuation or reversal.
Adaptive price levels : The tool calculates the viability, trade rating and P&L based on contextual levels, like moving averages and highest or lowest prices, instead of using fixed prices; this allows for the results to adapt dynamically to market fluctuations, eliminating the need for manual recalibrations and adjustments.
Automatic Trade Side Detection : While manual input is available, the tool can intuitively determine the optimal trade side based on current data.
Market Outlook Events : By using the crossings of the three averages, the tool keeps track of the evolution of the current trend, providing points of interest like when the initial momentum is observed, when the trend initiates, when a potential entry zone starts, when a buy or sell opportunity arises and when the trend ends.
Alerts : You can set up two distinct alerts – one notifies on trend milestones and another for trade initiation conditions. Note: Manual activation is required in the Tradingview dashboard.
Logs : The tool provides a log section where you can find relevant information regarding the operation and any encountered errors via the dashboard's log section.
Usage
Choose your desired ticker and timeframe. If a tradable trend is detected and levels are set correctly, the trade box appears. Incorrect levels will trigger a warning in the error logs.
The tool will suggest the logical trade side, but manual adjustments are possible.
Customize ROI, maximum loss, and RRR in the settings. When in 'Auto', the tool will calculate the target price accordingly.
Adjust leverage to align with your risk and reward parameters.
View linear regressions for trend analysis and spotting RSI divergences.
Manage position sizing and risk in the settings, accounting for broker/exchange fees.
Activate alerts for trade notifications.
Enable 'Show Trade Levels' in settings to get the details of the necessary limit orders for the trade.
In the image below, you can view the expanded Trade Creator Dashboard, the Trade Box, and the Linear Regression Lines:
The linear regression lines are colored red when trending downward and green when trending upward.
The labels displaying information related to the entry and exit prices can be hidden, as demonstrated in the image above.

Dee EMA 5.0
1. Indicator Features:
- The indicator can plot four different sets of EMA on a chart.
- The EMA values can be displayed on the chart with their respective names (e.g., ema9, ema20, etc.).
- The indicator allows customization of the EMA values.
2. Purpose of Dee_EMA 5.0:
- Dee_EMA 5.0 is a unique EMA indicator specially designed for traders to provide better insights and aid in trading decisions.
- The primary reason for building this indicator is to address the challenge of managing multiple time frames while using normal EMA tables.
- Traditional EMA tables might not show all EMA values across different time frames simultaneously, leading to time-consuming processes like shifting time frames and refreshing charts.
- Dee_EMA 5.0 solves this issue by displaying EMA values for different time frames in one table, allowing traders to make quick judgments without repeatedly changing time frames and refreshing charts.
3. Importance of Different Time Frame EMA Values:
- Different time frames EMA values are crucial in trading because they provide valuable insights into the market dynamics at various levels.
- When using shorter time frames (e.g., 1-minute), EMA values can help identify short-term trends, support, and resistance levels.
- On the other hand, using larger time frames (e.g., 5-minute or 15-minute) provides more data and increases the accuracy of EMA-based analysis, enabling traders to identify longer-term trends and potential price movements.
4. EMA Crossover Table:
- Traders often prefer a clutter-free chart without too many lines, but they still need access to EMA values for analysis.
- The EMA table and EMA crossover table serve this purpose by providing EMA values and EMA crossover information in a structured table format.
- With the EMA crossover table, traders can quickly check EMA values and crossovers across different time frames without having to switch time frames repeatedly, saving time and facilitating faster decision-making during trading.
In summary, Dee_EMA 5.0 is an EMA indicator designed to help traders efficiently analyze EMA values across different time frames, allowing for faster and more informed trading decisions. The EMA crossover table provides additional convenience by presenting EMA crossovers without cluttering the chart.

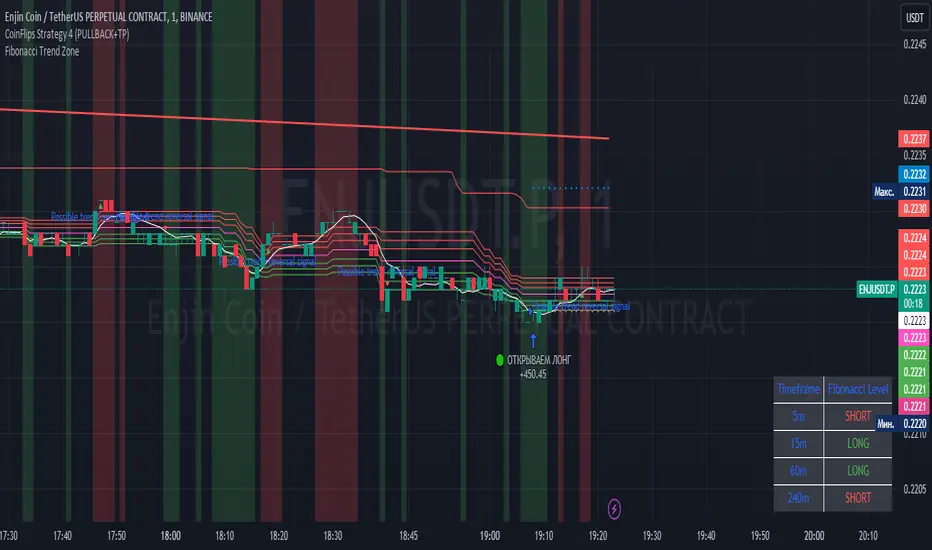
Fibonacci Trend Zone The "Fibonacci Trend Zone" indicator is a supplementary tool that helps identify the current trend based on Fibonacci zones. It utilizes Fibonacci levels (0.62, 0.705, and 0.79) to define long-term trend zones. The green zone indicates potential long trades, while the red zone suggests potential short trades. The indicator also includes the Triple Exponential Moving Average (TEMA), which helps confirm trend reversals. When the TEMA crosses the Fibonacci level of 0.5, it may signal a possible trend reversal. Use this indicator in conjunction with your primary trading strategy to make more informed trading decisions. Additionally, the indicator provides flexibility in customizing the styles, allowing you to change the color scheme or disable the display of certain elements to suit your preferences and requirements.
Индикатор "Fibonacci Trend Zone" является вспомогательным инструментом, который помогает определить текущий тренд на основе зон фибоначчи. Он использует уровни фибоначчи (0,62, 0,705 и 0,79) для определения зон долгосрочного тренда. Зеленая зона указывает на возможность лонг-сделок, а красная зона - на возможность шорт-сделок. Индикатор также включает Triple Exponential Moving Average (TEMA), который помогает подтвердить смену тренда. Когда TEMA пересекает уровень фибоначчи 0,5, это может сигнализировать о возможной смене тренда. Используйте данный индикатор в сочетании с вашей основной торговой стратегией для принятия более информированных решений. Индикатор также предоставляет гибкость в настройке стилей, позволяя вам изменить цветовую схему или отключить отображение некоторых элементов, чтобы соответствовать вашим предпочтениям и требованиям.
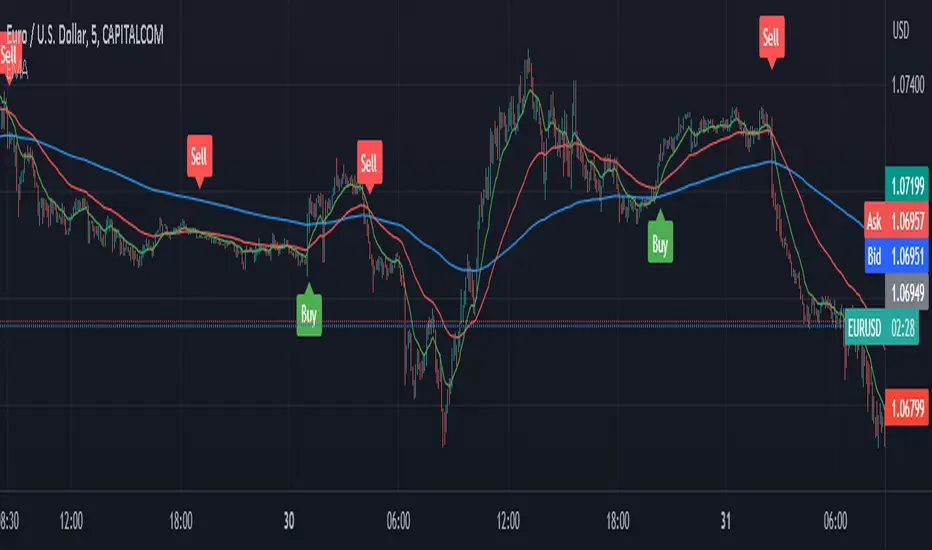
EMA with Buy/Sell Signals by lbkindCertainly! Here's a description of the code:
This Pine Script code is designed to plot Exponential Moving Averages (EMAs) on a chart and generate buy/sell signals based on specific conditions. The code includes a filter to reduce false signals by considering the trend of the EMA 200.
The key components of the code are as follows:
1. Input Variables: The code starts by defining input variables such as the periods for the EMAs (ema200Period, ema50Period, ema13Period), the Average True Range period (atrPeriod), and the chopiness threshold (chopinessThreshold).
2. Calculating EMAs: The EMAs (ema200, ema50, ema13) are calculated using the `ema()` function based on the closing price.
3. Average True Range (ATR): The ATR is calculated using the `atr()` function with the specified period (atrPeriod).
4. Normalized ATR: The normalized ATR is computed by dividing the ATR by the closing price and multiplying by 100. This allows for better comparison across different price levels.
5. EMA 200 Trend Direction: The code determines the trend direction of the EMA 200 by comparing the current value with the previous value. The variables `ema200TrendUp` and `ema200TrendDown` are assigned `true` or `false` values based on the trend direction.
6. Generate Buy/Sell Signals: The buySignal is generated when the following conditions are met:
- There is a crossover of the shorter EMAs (ema13, ema50).
- The EMA 200 is in an uptrend (`ema200TrendUp` is true).
- The current close is above the EMA 200.
- The normalized ATR is below the specified chopiness threshold.
The sellSignal is generated when the opposite conditions are met.
7. Plotting: The EMAs (ema200, ema50, ema13) are plotted on the chart using the `plot()` function. The buy and sell signals are plotted as labels using the `plotshape()` function. The buySignal is displayed below the candle (`location=location.belowbar`), and the sellSignal is displayed above the candle (`location=location.abovebar`).
By incorporating these features, the code provides a visual representation of the EMAs, along with buy and sell signals that consider the EMA 200 trend, crossover of shorter EMAs, and the normalized ATR condition. This helps in identifying potential entry and exit points in the market while attempting to reduce false signals.
Moving Averages SuiteThe Moving Averages Suite is a powerful technical analysis tool that provides traders with unparalleled control over five different moving averages and two special moving average indexes. This suite is designed to provide traders with a comprehensive understanding of market trends and help them make more informed trading decisions.
By default, the Moving Averages Suite displays two special moving average indexes that are made from the moving averages within the suite. These special moving average indexes are specially weighted indexes that are designed to provide a more accurate representation of market trends. The first index is the Moving Average Directional Index (MADI), which measures the strength of the trend in the market. The second index is the Moving Average Oscillator Index (MAOI), which measures the momentum of the trend in the market.
In addition to these special indexes, traders can enable five different moving averages within the suite. These moving averages include the TEMA, HMA, EMA, VWMA, and SMA. Each moving average has a specific purpose and is used to provide traders with a unique perspective on market trends.
The Triple Exponential Moving Average (TEMA) is designed to reduce the lag time associated with traditional moving averages. This moving average places more weight on recent price data, providing traders with a more accurate representation of current market trends.
The Hull Moving Average (HMA) is another moving average that is designed to reduce lag time. This moving average uses weighted averages to provide traders with a more accurate representation of market trends.
The Exponential Moving Average (EMA) is a popular moving average that is used to identify trends in the market. This moving average places more weight on recent price data, providing traders with a more accurate representation of current market trends.
The Volume Weighted Moving Average (VWMA) is another moving average that is used to identify trends in the market. This moving average places more weight on periods of high volume, providing traders with a more accurate representation of market trends during high volume periods.
The Simple Moving Average (SMA) is a widely used moving average that provides traders with a simple and easy-to-understand representation of market trends.
The Moving Averages Suite is a powerful technical analysis tool that provides traders with unparalleled control over five different moving averages and two special moving average indexes. Each moving average within the suite is designed to provide traders with a unique perspective on market trends, allowing them to make more informed trading decisions. Traders who are looking to gain a comprehensive understanding of market trends should consider using the Moving Averages Suite in their trading strategies.

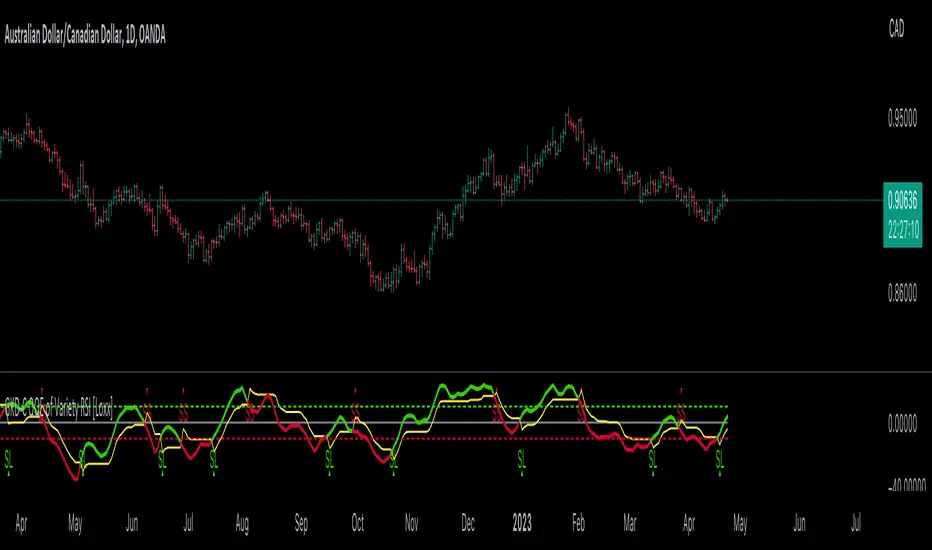
GKD-C QQE of Variety RSI [Loxx]Giga Kaleidoscope GKD-C QQE of Variety RSI is a Confirmation module included in Loxx's "Giga Kaleidoscope Modularized Trading System".
█ GKD-C QQE of Variety RSI
QQE: A Comprehensive Alternative to the Relative Strength Index
The Relative Strength Index (RSI) is a popular technical indicator that measures the speed and change of price movements to help traders identify potential trend reversals, overbought, and oversold conditions. Although the RSI is widely used, it has its limitations, and traders often seek alternative or complementary indicators to improve their market analysis. One such alternative is the Qualitative Quantitative Estimation (QQE) indicator, a comprehensive oscillator that combines the features of the RSI with additional smoothing and volatility adjustments. In the following, we will explore the QQE indicator, its calculation, and its potential benefits compared to using any type of RSI alone.
QQE Indicator
The QQE indicator was developed by an unknown author and is based on the RSI with additional modifications to enhance its performance. The QQE calculation involves three main steps:
1. The first step is to compute the RSI value for a specified period using the traditional RSI formula.
2. The second step is to apply a smoothing technique, such as the Wilder's smoothing or an exponential moving average (EMA), to the RSI value, resulting in the smoothed RSI.
3. The third step is to calculate the volatility-adjusted upper and lower bands (referred to as the QQE lines) around the smoothed RSI using an ATR-based (Average True Range) multiplier.
The QQE indicator is typically displayed as an oscillator with the smoothed RSI line in the middle and the upper and lower QQE lines acting as dynamic boundaries.
Comparison with the RSI
To better understand the potential benefits of the QQE indicator compared to using any type of RSI alone, let's examine its key features and how they may contribute to improved market analysis.
Advantages
1. The QQE indicator provides a more comprehensive view of the market by combining the strengths of the RSI with additional smoothing and volatility adjustments. This may result in a more reliable and accurate reflection of market conditions and price trends.
2. The smoothed RSI line in the QQE oscillator can help filter out noise and reduce the number of false signals often experienced when using the traditional RSI alone, making it easier for traders to identify genuine trend reversals and trading opportunities.
3. The dynamic QQE lines offer an additional layer of information by accounting for market volatility. This can help traders to better gauge the strength of price movements and identify potential support and resistance levels.
4. The QQE indicator can be used as a standalone tool or in combination with other technical indicators, providing traders with greater flexibility in their market analysis.
Disadvantages
1. The QQE indicator may be more complex to understand and implement than the traditional RSI due to the additional smoothing and volatility adjustments involved in its calculation.
2. As the QQE indicator is less widely known and used than the RSI, traders may find it more challenging to find resources and support for incorporating this indicator into their trading strategies.
Conclusion:
The QQE indicator is a versatile and comprehensive alternative to the traditional RSI, offering potential benefits in terms of noise reduction, volatility adjustment, and improved market analysis. However, it is important to recognize its limitations, such as increased complexity and limited resources compared to the RSI. Traders should carefully consider the potential advantages and drawbacks of using the QQE indicator before integrating it into their trading strategies. Ultimately, the choice between the QQE and any type of RSI will depend on individual traders' preferences and the specific market conditions they are analyzing.
This indicator includes 3 types of signals
1. Middle cross
2. Levels cross
3. Slow Trend cross
This indicator includes 9 types of RSI
1. Regular RSI
2. Slow RSI
3. Ehlers Smoothed RSI
4. Cutler's RSI or Rapid RSI
5. RSI T3
6. RSI DEMA
7. Harris' RSI
8. RSI TEMA
9. Jurik RSX
Regular RSI
The Relative Strength Index (RSI) is a widely used technical indicator in the field of financial market analysis. Developed by J. Welles Wilder Jr. in 1978, the RSI is a momentum oscillator that measures the speed and change of price movements. It helps traders identify potential trend reversals, overbought, and oversold conditions in a market.
The RSI is calculated based on the average gains and losses of an asset over a specified period, typically 14 days. The formula for calculating the RSI is as follows:
RSI = 100 - (100 / (1 + RS))
Where:
RS (Relative Strength) = Average gain over the specified period / Average loss over the specified period
The RSI ranges from 0 to 100, with values above 70 generally considered overbought (potentially indicating that the asset is overvalued and may experience a price decline) and values below 30 considered oversold (potentially indicating that the asset is undervalued and may experience a price increase).
Slow RSI
The Slow RSI is a variation of the standard RSI, which introduces a smoothing technique to the RSI calculation itself. The primary difference between the Slow RSI and the standard RSI lies in the calculation of the RSI value. In the Slow RSI, the current RSI value is calculated as a moving average of the previous RSI value and the standard RSI value for the current period.
The primary advantage of the Slow RSI is that it offers enhanced signal stability, reducing noise and potentially providing more reliable trading signals for traders.
Comparison with the original RSI
To better understand the potential advantages and disadvantages of the Slow RSI, it is essential to compare its performance against the original RSI.
Advantages
1. The Slow RSI provides enhanced signal stability by smoothing the RSI calculation, which can help traders better assess market conditions and identify potential overbought or oversold situations.
2. By offering more stable and reliable signals, the Slow RSI may improve the performance of trading strategies based on the RSI, especially in noisy or choppy market conditions.
Disadvantages
1. The smoothing technique employed by the Slow RSI may result in a slower response to changes in price momentum compared to the original RSI. This could lead to delayed signals for entering or exiting trades, which may not be ideal for short-term traders or fast-moving markets.
2. As the Slow RSI is less known and less widely used than the standard RSI, traders may find it more challenging to find resources and support for implementing this variation of the indicator.
The Slow RSI is an interesting modification of the standard RSI, offering potential benefits in terms of signal stability and reliability. However, it is crucial to recognize its limitations, such as a potentially slower response to changes in price momentum. Traders should carefully consider the potential advantages and drawbacks of using the Slow RSI compared to the original RSI before incorporating it into their trading strategies. Ultimately, the choice between the original RSI and the Slow RSI will depend on individual traders' preferences and the specific market conditions they are analyzing.
Ehlers Smoothed RSI
Ehlers Smoothed RSI is a variation of the standard RSI developed by John F. Ehlers, which introduces a smoothing technique to the price input data. The smoothing process involves averaging the current price with the previous two price values, which helps reduce noise and provide a more accurate representation of price momentum. The calculation of up and down price movements remains similar to the original RSI, but the smoothing technique alters the input data.
The primary advantage of Ehlers Smoothed RSI is that it reduces noise and offers a more accurate representation of price momentum, potentially providing more reliable signals for traders.
Comparison with the original RSI
To better understand the potential advantages and disadvantages of Ehlers Smoothed RSI, it is essential to compare its performance against the original RSI.
Advantages
1. Ehlers Smoothed RSI reduces noise by smoothing the price input data, which can help traders better assess market conditions and identify potential overbought or oversold situations.
2. By providing a more accurate representation of price momentum, Ehlers Smoothed RSI may offer more reliable signals for entering or exiting trades, potentially improving the performance of trading strategies based on the RSI.
Disadvantages
1. The smoothing technique employed by Ehlers Smoothed RSI may result in a slower response to changes in price momentum compared to the original RSI. This could lead to delayed signals for entering or exiting trades, which may not be ideal for short-term traders or fast-moving markets.
2. As Ehlers Smoothed RSI is less known and less widely used than the standard RSI, traders may find it more challenging to find resources and support for implementing this variation of the indicator.
Ehlers Smoothed RSI is an intriguing modification of the standard RSI, offering potential benefits in terms of noise reduction and accuracy. However, it is crucial to recognize its limitations, such as a potentially slower response to changes in price momentum. Traders should carefully consider the potential advantages and drawbacks of using Ehlers Smoothed RSI compared to the original RSI before incorporating it into their trading strategies. Ultimately, the choice between the original RSI and Ehlers Smoothed RSI will depend on individual traders' preferences and the specific market conditions they are analyzing.
Cutler's RSI or Rapid RSI
Cutler's RSI is a variation of the standard RSI, which modifies the calculation of average gains and losses. While the original RSI employs exponential moving averages (EMAs) for average gains and losses, Cutler's RSI utilizes simple moving averages (SMAs) instead. This change results in a slightly different behavior of the oscillator compared to the original RSI.
The primary advantage of Cutler's RSI is that it offers a simpler calculation method, which can potentially make it easier to understand and implement for traders. Additionally, by using SMAs, Cutler's RSI may provide a more consistent and stable representation of price momentum.
Comparison with the original RSI
It is essential to recognize the limitations and performance of Cutler's RSI compared to the original RSI to understand its potential advantages and disadvantages better.
Advantages
1. Cutler's RSI has a simpler calculation method, using SMAs instead of EMAs. This makes it easier to understand and implement for traders who prefer a more straightforward approach to technical analysis.
2. By using SMAs, Cutler's RSI may provide a more stable and consistent representation of price momentum, which can help traders better assess market conditions and identify potential overbought or oversold situations.
Disadvantages
1. The use of SMAs in Cutler's RSI may result in a slower response to changes in price momentum compared to the original RSI. This could lead to delayed signals for entering or exiting trades, which may not be ideal for short-term traders or fast-moving markets.
2. As Cutler's RSI is less known and less widely used than the standard RSI, it may be more challenging to find resources and support for implementing this variation of the indicator.
Cutler's RSI is an interesting modification of the standard RSI, offering potential benefits in terms of simplicity and stability. However, it is crucial to recognize its limitations, such as a potentially slower response to changes in price momentum. Traders should carefully consider the potential advantages and drawbacks of using Cutler's RSI compared to the original RSI before incorporating it into their trading strategies. Ultimately, the choice between the original RSI and Cutler's RSI will depend on individual traders' preferences and the specific market conditions they are analyzing.
RSI T3
The T3 RSI is a variation of the standard RSI that introduces the Triple Smoothed Exponential Moving Average (T3) into the calculation process. The primary difference between the T3 RSI and the standard RSI lies in the calculation of the average gains and losses. Instead of using simple moving averages or exponential moving averages, the T3 RSI utilizes T3 to calculate the average gains and losses for up and down price movements.
The primary advantage of the T3 RSI is that it offers enhanced responsiveness and accuracy compared to the original RSI, potentially providing more reliable trading signals for traders.
Comparison with the original RSI
To better understand the potential advantages and disadvantages of the T3 RSI, it is essential to compare its performance against the original RSI.
Advantages
1. The T3 RSI provides enhanced responsiveness and accuracy by incorporating the Triple Smoothed Exponential Moving Average into the calculation of average gains and losses. This can help traders better assess market conditions and identify potential overbought or oversold situations.
2. By offering more responsive and accurate signals, the T3 RSI may improve the performance of trading strategies based on the RSI, especially in fast-moving markets or during periods of high price volatility.
Disadvantages
1. The T3 RSI's increased responsiveness may result in more frequent trading signals, which could lead to higher trading costs or a higher likelihood of false signals.
2. As the T3 RSI is less known and less widely used than the standard RSI, traders may find it more challenging to find resources and support for implementing this variation of the indicator.
The T3 RSI is an innovative modification of the standard RSI, offering potential benefits in terms of responsiveness and accuracy. However, it is crucial to recognize its limitations, such as a potentially higher likelihood of false signals due to increased responsiveness. Traders should carefully consider the potential advantages and drawbacks of using the T3 RSI compared to the original RSI before incorporating it into their trading strategies. Ultimately, the choice between the original RSI and the T3 RSI will depend on individual traders' preferences and the specific market conditions they are analyzing.
RSI DEMA
The DEMA RSI is a variation of the standard RSI that introduces the Double Exponential Moving Average (DEMA) into the calculation process. The primary difference between the DEMA RSI and the standard RSI lies in the calculation of the average gains and losses. Instead of using simple moving averages or exponential moving averages, the DEMA RSI utilizes DEMA to calculate the average gains and losses for up and down price movements.
The primary advantage of the DEMA RSI is that it offers enhanced responsiveness and accuracy compared to the original RSI, potentially providing more reliable trading signals for traders.
Comparison with the original RSI
To better understand the potential advantages and disadvantages of the DEMA RSI, it is essential to compare its performance against the original RSI.
Advantages
1. The DEMA RSI provides enhanced responsiveness and accuracy by incorporating the Double Exponential Moving Average into the calculation of average gains and losses. This can help traders better assess market conditions and identify potential overbought or oversold situations.
2. By offering more responsive and accurate signals, the DEMA RSI may improve the performance of trading strategies based on the RSI, especially in fast-moving markets or during periods of high price volatility.
Disadvantages
1. The DEMA RSI's increased responsiveness may result in more frequent trading signals, which could lead to higher trading costs or a higher likelihood of false signals.
2. As the DEMA RSI is less known and less widely used than the standard RSI, traders may find it more challenging to find resources and support for implementing this variation of the indicator.
The DEMA RSI is an innovative modification of the standard RSI, offering potential benefits in terms of responsiveness and accuracy. However, it is crucial to recognize its limitations, such as a potentially higher likelihood of false signals due to increased responsiveness. Traders should carefully consider the potential advantages and drawbacks of using the DEMA RSI compared to the original RSI before incorporating it into their trading strategies. Ultimately, the choice between the original RSI and the DEMA RSI will depend on individual traders' preferences and the specific market conditions they are analyzing.
Harris' RSI
Harris' RSI is a variation of the standard RSI, designed to address some of its limitations and improve its performance in detecting potential trend reversals and filtering out noise. The key difference between the Harris' RSI and the standard RSI lies in the calculation of average gains and losses. While the standard RSI calculation uses exponential moving averages (EMAs) of gains and losses, Harris' RSI uses a different approach to compute the average gains and losses based on the number of up and down price movements.
The primary advantage of Harris' RSI is that it aims to provide a more adaptive and responsive indicator, making it better suited for detecting potential trend reversals and filtering out noise in the market. By taking into account the number of up and down price movements, Harris' RSI can be more sensitive to changes in the trend, potentially providing earlier signals for entering or exiting trades.
Comparison with the original RSI
While Harris' RSI offers potential improvements over the standard RSI, it is essential to recognize its limitations and compare its performance against the original RSI.
Advantages
1. Harris' RSI can potentially provide earlier signals for trend reversals due to its sensitivity to the number of up and down price movements. This can help traders to identify better entry and exit points in the market.
2. By focusing on the number of up and down price movements, Harris' RSI can filter out noise in the market, reducing the likelihood of false signals that may lead to losing trades.
Disadvantages
1. The increased sensitivity of Harris' RSI to price movements can lead to more frequent signals, which may result in overtrading and increased trading costs.
2. Harris' RSI is less known and less widely used than the standard RSI, which may make it more challenging to find resources and support for implementing this variation of the indicator.
Harris' RSI is an interesting variation of the standard RSI, offering potential advantages in detecting trend reversals and filtering out noise. However, like any technical indicator, it has its limitations and may not be suitable for all trading styles or market conditions. Traders should carefully consider the potential benefits and drawbacks of using Harris' RSI compared to the original RSI before incorporating it into their trading strategies. Ultimately, the choice between the original RSI and Harris' RSI will depend on individual traders' preferences and the specific market conditions they are analyzing.
RSI TEMA
The TEMA RSI is a variation of the standard RSI that introduces the Triple Exponential Moving Average (TEMA) into the calculation process. The primary difference between the TEMA RSI and the standard RSI lies in the calculation of the average gains and losses. Instead of using simple moving averages or exponential moving averages, the TEMA RSI utilizes TEMA to calculate the average gains and losses for up and down price movements.
The primary advantage of the TEMA RSI is that it offers enhanced responsiveness and accuracy compared to the original RSI, potentially providing more reliable trading signals for traders.
Comparison with the original RSI
To better understand the potential advantages and disadvantages of the TEMA RSI, it is essential to compare its performance against the original RSI.
Advantages
1. The TEMA RSI provides enhanced responsiveness and accuracy by incorporating the Triple Exponential Moving Average into the calculation of average gains and losses. This can help traders better assess market conditions and identify potential overbought or oversold situations.
2. By offering more responsive and accurate signals, the TEMA RSI may improve the performance of trading strategies based on the RSI, especially in fast-moving markets or during periods of high price volatility.
Disadvantages
1. The TEMA RSI's increased responsiveness may result in more frequent trading signals, which could lead to higher trading costs or a higher likelihood of false signals.
2. As the TEMA RSI is less known and less widely used than the standard RSI, traders may find it more challenging to find resources and support for implementing this variation of the indicator.
The TEMA RSI is an innovative modification of the standard RSI, offering potential benefits in terms of responsiveness and accuracy. However, it is crucial to recognize its limitations, such as a potentially higher likelihood of false signals due to increased responsiveness. Traders should carefully consider the potential advantages and drawbacks of using the TEMA RSI compared to the original RSI before incorporating it into their trading strategies. Ultimately, the choice between the original RSI and the TEMA RSI will depend on individual traders' preferences and the specific market conditions they are analyzing.
Jurik RSX
The Jurik RSX, developed by Mark Jurik, is a variation of the standard RSI that aims to provide a smoother and more responsive indicator by applying a unique smoothing algorithm based on a series of recursive calculations. The Jurik RSX calculates the price momentum (mom) and the absolute price momentum (moa) using a three-stage filtering process, which ultimately results in a smoother and more responsive output compared to the original RSI.
Comparison with the original RSI
To better understand the potential benefits and drawbacks of the Jurik RSX, it is essential to compare its performance against the original RSI.
Advantages
1. The Jurik RSX offers enhanced responsiveness and smoothness due to its unique recursive filtering process, allowing traders to better identify potential trend reversals, overbought, and oversold conditions.
2. The improved responsiveness of the Jurik RSX may result in more timely trading signals, helping traders to capitalize on opportunities more effectively, especially in fast-moving markets or during periods of high price volatility.
Disadvantages
1. The increased complexity of the Jurik RSX calculation may make it more challenging for traders to understand and implement compared to the original RSI.
2. As the Jurik RSX is less known and less widely used than the standard RSI, traders may find it more difficult to find resources and support for implementing this variation of the indicator.
The Jurik RSX is an innovative modification of the standard RSI, offering potential benefits in terms of responsiveness and smoothness. However, it is crucial to recognize its limitations, such as increased complexity and limited resources compared to the original RSI. Traders should carefully consider the potential advantages and drawbacks of using the Jurik RSX before incorporating it into their trading strategies. Ultimately, the choice between the original RSI and the Jurik RSX will depend on individual traders' preferences and the specific market conditions they are analyzing.
Additional Features
This indicator allows you to select from 33 source types. They are as follows:
Close
Open
High
Low
Median
Typical
Weighted
Average
Average Median Body
Trend Biased
Trend Biased (Extreme)
HA Close
HA Open
HA High
HA Low
HA Median
HA Typical
HA Weighted
HA Average
HA Average Median Body
HA Trend Biased
HA Trend Biased (Extreme)
HAB Close
HAB Open
HAB High
HAB Low
HAB Median
HAB Typical
HAB Weighted
HAB Average
HAB Average Median Body
HAB Trend Biased
HAB Trend Biased (Extreme)
What are Heiken Ashi "better" candles?
Heiken Ashi "better" candles are a modified version of the standard Heiken Ashi candles, which are a popular charting technique used in technical analysis. Heiken Ashi candles help traders identify trends and potential reversal points by smoothing out price data and reducing market noise. The "better formula" was proposed by Sebastian Schmidt in an article published by BNP Paribas in Warrants & Zertifikate, a German magazine, in August 2004. The aim of this formula is to further improve the smoothing of the Heiken Ashi chart and enhance its effectiveness in identifying trends and reversals.
Standard Heiken Ashi candles are calculated using the following formulas:
Heiken Ashi Close = (Open + High + Low + Close) / 4
Heiken Ashi Open = (Previous Heiken Ashi Open + Previous Heiken Ashi Close) / 2
Heiken Ashi High = Max (High, Heiken Ashi Open, Heiken Ashi Close)
Heiken Ashi Low = Min (Low, Heiken Ashi Open, Heiken Ashi Close)
The "better formula" modifies the standard Heiken Ashi calculation by incorporating additional smoothing, which can help reduce noise and make it easier to identify trends and reversals. The modified formulas for Heiken Ashi "better" candles are as follows:
Better Heiken Ashi Close = (Open + High + Low + Close) / 4
Better Heiken Ashi Open = (Previous Better Heiken Ashi Open + Previous Better Heiken Ashi Close) / 2
Better Heiken Ashi High = Max (High, Better Heiken Ashi Open, Better Heiken Ashi Close)
Better Heiken Ashi Low = Min (Low, Better Heiken Ashi Open, Better Heiken Ashi Close)
Smoothing Factor = 2 / (N + 1), where N is the chosen period for smoothing
Smoothed Better Heiken Ashi Open = (Better Heiken Ashi Open * Smoothing Factor) + (Previous Smoothed Better Heiken Ashi Open * (1 - Smoothing Factor))
Smoothed Better Heiken Ashi Close = (Better Heiken Ashi Close * Smoothing Factor) + (Previous Smoothed Better Heiken Ashi Close * (1 - Smoothing Factor))
The smoothed Better Heiken Ashi Open and Close values are then used to calculate the smoothed Better Heiken Ashi High and Low values, resulting in "better" candles that provide a clearer representation of the market trend and potential reversal points.
It's important to note that, like any other technical analysis tool, Heiken Ashi "better" candles are not foolproof and should be used in conjunction with other indicators and analysis techniques to make well-informed trading decisions.
Heiken Ashi "better" candles, as mentioned previously, provide a clearer representation of market trends and potential reversal points by reducing noise and smoothing out price data. When using these candles in conjunction with other technical analysis tools and indicators, traders can gain valuable insights into market behavior and make more informed decisions.
To effectively use Heiken Ashi "better" candles in your trading strategy, consider the following tips:
Trend Identification: Heiken Ashi "better" candles can help you identify the prevailing trend in the market. When the majority of the candles are green (or another color, depending on your chart settings) and there are no or few lower wicks, it may indicate a strong uptrend. Conversely, when the majority of the candles are red (or another color) and there are no or few upper wicks, it may signal a strong downtrend.
Trend Reversals: Look for potential trend reversals when a change in the color of the candles occurs, especially when accompanied by longer wicks. For example, if a green candle with a long lower wick is followed by a red candle, it could indicate a bearish reversal. Similarly, a red candle with a long upper wick followed by a green candle may suggest a bullish reversal.
Support and Resistance: You can use Heiken Ashi "better" candles to identify potential support and resistance levels. When the candles are consistently moving in one direction and then suddenly change color with longer wicks, it could indicate the presence of a support or resistance level.
Stop-Loss and Take-Profit: Using Heiken Ashi "better" candles can help you manage risk by determining optimal stop-loss and take-profit levels. For instance, you can place your stop-loss below the low of the most recent green candle in an uptrend or above the high of the most recent red candle in a downtrend.
Confirming Signals: Heiken Ashi "better" candles should be used in conjunction with other technical indicators, such as moving averages, oscillators, or chart patterns, to confirm signals and improve the accuracy of your analysis.
In this implementation, you have the choice of AMA, KAMA, or T3 smoothing. These are as follows:
Kaufman Adaptive Moving Average (KAMA)
The Kaufman Adaptive Moving Average (KAMA) is a type of adaptive moving average used in technical analysis to smooth out price fluctuations and identify trends. The KAMA adjusts its smoothing factor based on the market's volatility, making it more responsive in volatile markets and smoother in calm markets. The KAMA is calculated using three different efficiency ratios that determine the appropriate smoothing factor for the current market conditions. These ratios are based on the noise level of the market, the speed at which the market is moving, and the length of the moving average. The KAMA is a popular choice among traders who prefer to use adaptive indicators to identify trends and potential reversals.
Adaptive Moving Average
The Adaptive Moving Average (AMA) is a type of moving average that adjusts its sensitivity to price movements based on market conditions. It uses a ratio between the current price and the highest and lowest prices over a certain lookback period to determine its level of smoothing. The AMA can help reduce lag and increase responsiveness to changes in trend direction, making it useful for traders who want to follow trends while avoiding false signals. The AMA is calculated by multiplying a smoothing constant with the difference between the current price and the previous AMA value, then adding the result to the previous AMA value.
T3
The T3 moving average is a type of technical indicator used in financial analysis to identify trends in price movements. It is similar to the Exponential Moving Average (EMA) and the Double Exponential Moving Average (DEMA), but uses a different smoothing algorithm.
The T3 moving average is calculated using a series of exponential moving averages that are designed to filter out noise and smooth the data. The resulting smoothed data is then weighted with a non-linear function to produce a final output that is more responsive to changes in trend direction.
The T3 moving average can be customized by adjusting the length of the moving average, as well as the weighting function used to smooth the data. It is commonly used in conjunction with other technical indicators as part of a larger trading strategy.
█ Giga Kaleidoscope Modularized Trading System
Core components of an NNFX algorithmic trading strategy
The NNFX algorithm is built on the principles of trend, momentum, and volatility. There are six core components in the NNFX trading algorithm:
1. Volatility - price volatility; e.g., Average True Range, True Range Double, Close-to-Close, etc.
2. Baseline - a moving average to identify price trend
3. Confirmation 1 - a technical indicator used to identify trends
4. Confirmation 2 - a technical indicator used to identify trends
5. Continuation - a technical indicator used to identify trends
6. Volatility/Volume - a technical indicator used to identify volatility/volume breakouts/breakdown
7. Exit - a technical indicator used to determine when a trend is exhausted
What is Volatility in the NNFX trading system?
In the NNFX (No Nonsense Forex) trading system, ATR (Average True Range) is typically used to measure the volatility of an asset. It is used as a part of the system to help determine the appropriate stop loss and take profit levels for a trade. ATR is calculated by taking the average of the true range values over a specified period.
True range is calculated as the maximum of the following values:
-Current high minus the current low
-Absolute value of the current high minus the previous close
-Absolute value of the current low minus the previous close
ATR is a dynamic indicator that changes with changes in volatility. As volatility increases, the value of ATR increases, and as volatility decreases, the value of ATR decreases. By using ATR in NNFX system, traders can adjust their stop loss and take profit levels according to the volatility of the asset being traded. This helps to ensure that the trade is given enough room to move, while also minimizing potential losses.
Other types of volatility include True Range Double (TRD), Close-to-Close, and Garman-Klass
What is a Baseline indicator?
The baseline is essentially a moving average, and is used to determine the overall direction of the market.
The baseline in the NNFX system is used to filter out trades that are not in line with the long-term trend of the market. The baseline is plotted on the chart along with other indicators, such as the Moving Average (MA), the Relative Strength Index (RSI), and the Average True Range (ATR).
Trades are only taken when the price is in the same direction as the baseline. For example, if the baseline is sloping upwards, only long trades are taken, and if the baseline is sloping downwards, only short trades are taken. This approach helps to ensure that trades are in line with the overall trend of the market, and reduces the risk of entering trades that are likely to fail.
By using a baseline in the NNFX system, traders can have a clear reference point for determining the overall trend of the market, and can make more informed trading decisions. The baseline helps to filter out noise and false signals, and ensures that trades are taken in the direction of the long-term trend.
What is a Confirmation indicator?
Confirmation indicators are technical indicators that are used to confirm the signals generated by primary indicators. Primary indicators are the core indicators used in the NNFX system, such as the Average True Range (ATR), the Moving Average (MA), and the Relative Strength Index (RSI).
The purpose of the confirmation indicators is to reduce false signals and improve the accuracy of the trading system. They are designed to confirm the signals generated by the primary indicators by providing additional information about the strength and direction of the trend.
Some examples of confirmation indicators that may be used in the NNFX system include the Bollinger Bands, the MACD (Moving Average Convergence Divergence), and the MACD Oscillator. These indicators can provide information about the volatility, momentum, and trend strength of the market, and can be used to confirm the signals generated by the primary indicators.
In the NNFX system, confirmation indicators are used in combination with primary indicators and other filters to create a trading system that is robust and reliable. By using multiple indicators to confirm trading signals, the system aims to reduce the risk of false signals and improve the overall profitability of the trades.
What is a Continuation indicator?
In the NNFX (No Nonsense Forex) trading system, a continuation indicator is a technical indicator that is used to confirm a current trend and predict that the trend is likely to continue in the same direction. A continuation indicator is typically used in conjunction with other indicators in the system, such as a baseline indicator, to provide a comprehensive trading strategy.
What is a Volatility/Volume indicator?
Volume indicators, such as the On Balance Volume (OBV), the Chaikin Money Flow (CMF), or the Volume Price Trend (VPT), are used to measure the amount of buying and selling activity in a market. They are based on the trading volume of the market, and can provide information about the strength of the trend. In the NNFX system, volume indicators are used to confirm trading signals generated by the Moving Average and the Relative Strength Index. Volatility indicators include Average Direction Index, Waddah Attar, and Volatility Ratio. In the NNFX trading system, volatility is a proxy for volume and vice versa.
By using volume indicators as confirmation tools, the NNFX trading system aims to reduce the risk of false signals and improve the overall profitability of trades. These indicators can provide additional information about the market that is not captured by the primary indicators, and can help traders to make more informed trading decisions. In addition, volume indicators can be used to identify potential changes in market trends and to confirm the strength of price movements.
What is an Exit indicator?
The exit indicator is used in conjunction with other indicators in the system, such as the Moving Average (MA), the Relative Strength Index (RSI), and the Average True Range (ATR), to provide a comprehensive trading strategy.
The exit indicator in the NNFX system can be any technical indicator that is deemed effective at identifying optimal exit points. Examples of exit indicators that are commonly used include the Parabolic SAR, the Average Directional Index (ADX), and the Chandelier Exit.
The purpose of the exit indicator is to identify when a trend is likely to reverse or when the market conditions have changed, signaling the need to exit a trade. By using an exit indicator, traders can manage their risk and prevent significant losses.
In the NNFX system, the exit indicator is used in conjunction with a stop loss and a take profit order to maximize profits and minimize losses. The stop loss order is used to limit the amount of loss that can be incurred if the trade goes against the trader, while the take profit order is used to lock in profits when the trade is moving in the trader's favor.
Overall, the use of an exit indicator in the NNFX trading system is an important component of a comprehensive trading strategy. It allows traders to manage their risk effectively and improve the profitability of their trades by exiting at the right time.
How does Loxx's GKD (Giga Kaleidoscope Modularized Trading System) implement the NNFX algorithm outlined above?
Loxx's GKD v1.0 system has five types of modules (indicators/strategies). These modules are:
1. GKD-BT - Backtesting module (Volatility, Number 1 in the NNFX algorithm)
2. GKD-B - Baseline module (Baseline and Volatility/Volume, Numbers 1 and 2 in the NNFX algorithm)
3. GKD-C - Confirmation 1/2 and Continuation module (Confirmation 1/2 and Continuation, Numbers 3, 4, and 5 in the NNFX algorithm)
4. GKD-V - Volatility/Volume module (Confirmation 1/2, Number 6 in the NNFX algorithm)
5. GKD-E - Exit module (Exit, Number 7 in the NNFX algorithm)
(additional module types will added in future releases)
Each module interacts with every module by passing data between modules. Data is passed between each module as described below:
GKD-B => GKD-V => GKD-C(1) => GKD-C(2) => GKD-C(Continuation) => GKD-E => GKD-BT
That is, the Baseline indicator passes its data to Volatility/Volume. The Volatility/Volume indicator passes its values to the Confirmation 1 indicator. The Confirmation 1 indicator passes its values to the Confirmation 2 indicator. The Confirmation 2 indicator passes its values to the Continuation indicator. The Continuation indicator passes its values to the Exit indicator, and finally, the Exit indicator passes its values to the Backtest strategy.
This chaining of indicators requires that each module conform to Loxx's GKD protocol, therefore allowing for the testing of every possible combination of technical indicators that make up the six components of the NNFX algorithm.
What does the application of the GKD trading system look like?
Example trading system:
Backtest: Strategy with 1-3 take profits, trailing stop loss, multiple types of PnL volatility, and 2 backtesting styles
Baseline: Hull Moving Average
Volatility/Volume: Hurst Exponent
Confirmation 1: QQE of Variety RSI as shown on the chart above
Confirmation 2: Williams Percent Range
Continuation: QQE of Variety RSI
Exit: Rex Oscillator
Each GKD indicator is denoted with a module identifier of either: GKD-BT, GKD-B, GKD-C, GKD-V, or GKD-E. This allows traders to understand to which module each indicator belongs and where each indicator fits into the GKD protocol chain.
Giga Kaleidoscope Modularized Trading System Signals (based on the NNFX algorithm)
Standard Entry
1. GKD-C Confirmation 1 Signal
2. GKD-B Baseline agrees
3. Price is within a range of 0.2x Volatility and 1.0x Volatility of the Goldie Locks Mean
4. GKD-C Confirmation 2 agrees
5. GKD-V Volatility/Volume agrees
Baseline Entry
1. GKD-B Baseline signal
2. GKD-C Confirmation 1 agrees
3. Price is within a range of 0.2x Volatility and 1.0x Volatility of the Goldie Locks Mean
4. GKD-C Confirmation 2 agrees
5. GKD-V Volatility/Volume agrees
6. GKD-C Confirmation 1 signal was less than 7 candles prior
Volatility/Volume Entry
1. GKD-V Volatility/Volume signal
2. GKD-C Confirmation 1 agrees
3. Price is within a range of 0.2x Volatility and 1.0x Volatility of the Goldie Locks Mean
4. GKD-C Confirmation 2 agrees
5. GKD-B Baseline agrees
6. GKD-C Confirmation 1 signal was less than 7 candles prior
Continuation Entry
1. Standard Entry, Baseline Entry, or Pullback; entry triggered previously
2. GKD-B Baseline hasn't crossed since entry signal trigger
3. GKD-C Confirmation Continuation Indicator signals
4. GKD-C Confirmation 1 agrees
5. GKD-B Baseline agrees
6. GKD-C Confirmation 2 agrees
1-Candle Rule Standard Entry
1. GKD-C Confirmation 1 signal
2. GKD-B Baseline agrees
3. Price is within a range of 0.2x Volatility and 1.0x Volatility of the Goldie Locks Mean
Next Candle:
1. Price retraced (Long: close < close or Short: close > close )
2. GKD-B Baseline agrees
3. GKD-C Confirmation 1 agrees
4. GKD-C Confirmation 2 agrees
5. GKD-V Volatility/Volume agrees
1-Candle Rule Baseline Entry
1. GKD-B Baseline signal
2. GKD-C Confirmation 1 agrees
3. Price is within a range of 0.2x Volatility and 1.0x Volatility of the Goldie Locks Mean
4. GKD-C Confirmation 1 signal was less than 7 candles prior
Next Candle:
1. Price retraced (Long: close < close or Short: close > close )
2. GKD-B Baseline agrees
3. GKD-C Confirmation 1 agrees
4. GKD-C Confirmation 2 agrees
5. GKD-V Volatility/Volume Agrees
1-Candle Rule Volatility/Volume Entry
1. GKD-V Volatility/Volume signal
2. GKD-C Confirmation 1 agrees
3. Price is within a range of 0.2x Volatility and 1.0x Volatility of the Goldie Locks Mean
4. GKD-C Confirmation 1 signal was less than 7 candles prior
Next Candle:
1. Price retraced (Long: close < close or Short: close > close)
2. GKD-B Volatility/Volume agrees
3. GKD-C Confirmation 1 agrees
4. GKD-C Confirmation 2 agrees
5. GKD-B Baseline agrees
PullBack Entry
1. GKD-B Baseline signal
2. GKD-C Confirmation 1 agrees
3. Price is beyond 1.0x Volatility of Baseline
Next Candle:
1. Price is within a range of 0.2x Volatility and 1.0x Volatility of the Goldie Locks Mean
2. GKD-C Confirmation 1 agrees
3. GKD-C Confirmation 2 agrees
4. GKD-V Volatility/Volume Agrees
]█ Setting up the GKD
The GKD system involves chaining indicators together. These are the steps to set this up.
Use a GKD-C indicator alone on a chart
1. Inside the GKD-C indicator, change the "Confirmation Type" setting to "Solo Confirmation Simple"
Use a GKD-V indicator alone on a chart
**nothing, it's already useable on the chart without any settings changes
Use a GKD-B indicator alone on a chart
**nothing, it's already useable on the chart without any settings changes
Baseline (Baseline, Backtest)
1. Import the GKD-B Baseline into the GKD-BT Backtest: "Input into Volatility/Volume or Backtest (Baseline testing)"
2. Inside the GKD-BT Backtest, change the setting "Backtest Special" to "Baseline"
Volatility/Volume (Volatility/Volume, Backte st)
1. Inside the GKD-V indicator, change the "Testing Type" setting to "Solo"
2. Inside the GKD-V indicator, change the "Signal Type" setting to "Crossing" (neither traditional nor both can be backtested)
3. Import the GKD-V indicator into the GKD-BT Backtest: "Input into C1 or Backtest"
4. Inside the GKD-BT Backtest, change the setting "Backtest Special" to "Volatility/Volume"
5. Inside the GKD-BT Backtest, a) change the setting "Backtest Type" to "Trading" if using a directional GKD-V indicator; or, b) change the setting "Backtest Type" to "Full" if using a directional or non-directional GKD-V indicator (non-directional GKD-V can only test Longs and Shorts separately)
6. If "Backtest Type" is set to "Full": Inside the GKD-BT Backtest, change the setting "Backtest Side" to "Long" or "Short
7. If "Backtest Type" is set to "Full": To allow the system to open multiple orders at one time so you test all Longs or Shorts, open the GKD-BT Backtest, click the tab "Properties" and then insert a value of something like 10 orders into the "Pyramiding" settings. This will allow 10 orders to be opened at one time which should be enough to catch all possible Longs or Shorts.
Solo Confirmation Simple (Confirmation, Backtest)
1. Inside the GKD-C indicator, change the "Confirmation Type" setting to "Solo Confirmation Simple"
1. Import the GKD-C indicator into the GKD-BT Backtest: "Input into Backtest"
2. Inside the GKD-BT Backtest, change the setting "Backtest Special" to "Solo Confirmation Simple"
Solo Confirmation Complex without Exits (Baseline, Volatility/Volume, Confirmation, Backtest)
1. Inside the GKD-V indicator, change the "Testing Type" setting to "Chained"
2. Import the GKD-B Baseline into the GKD-V indicator: "Input into Volatility/Volume or Backtest (Baseline testing)"
3. Inside the GKD-C indicator, change the "Confirmation Type" setting to "Solo Confirmation Complex"
4. Import the GKD-V indicator into the GKD-C indicator: "Input into C1 or Backtest"
5. Inside the GKD-BT Backtest, change the setting "Backtest Special" to "GKD Full wo/ Exits"
6. Import the GKD-C into the GKD-BT Backtest: "Input into Exit or Backtest"
Solo Confirmation Complex with Exits (Baseline, Volatility/Volume, Confirmation, Exit, Backtest)
1. Inside the GKD-V indicator, change the "Testing Type" setting to "Chained"
2. Import the GKD-B Baseline into the GKD-V indicator: "Input into Volatility/Volume or Backtest (Baseline testing)"
3. Inside the GKD-C indicator, change the "Confirmation Type" setting to "Solo Confirmation Complex"
4. Import the GKD-V indicator into the GKD-C indicator: "Input into C1 or Backtest"
5. Import the GKD-C indicator into the GKD-E indicator: "Input into Exit"
6. Inside the GKD-BT Backtest, change the setting "Backtest Special" to "GKD Full w/ Exits"
7. Import the GKD-E into the GKD-BT Backtest: "Input into Backtest"
Full GKD without Exits (Baseline, Volatility/Volume, Confirmation 1, Confirmation 2, Continuation, Backtest)
1. Inside the GKD-V indicator, change the "Testing Type" setting to "Chained"
2. Import the GKD-B Baseline into the GKD-V indicator: "Input into Volatility/Volume or Backtest (Baseline testing)"
3. Inside the GKD-C 1 indicator, change the "Confirmation Type" setting to "Confirmation 1"
4. Import the GKD-V indicator into the GKD-C 1 indicator: "Input into C1 or Backtest"
5. Inside the GKD-C 2 indicator, change the "Confirmation Type" setting to "Confirmation 2"
6. Import the GKD-C 1 indicator into the GKD-C 2 indicator: "Input into C2"
7. Inside the GKD-C Continuation indicator, change the "Confirmation Type" setting to "Continuation"
8. Inside the GKD-BT Backtest, change the setting "Backtest Special" to "GKD Full wo/ Exits"
9. Import the GKD-E into the GKD-BT Backtest: "Input into Exit or Backtest"
Full GKD with Exits (Baseline, Volatility/Volume, Confirmation 1, Confirmation 2, Continuation, Exit, Backtest)
1. Inside the GKD-V indicator, change the "Testing Type" setting to "Chained"
2. Import the GKD-B Baseline into the GKD-V indicator: "Input into Volatility/Volume or Backtest (Baseline testing)"
3. Inside the GKD-C 1 indicator, change the "Confirmation Type" setting to "Confirmation 1"
4. Import the GKD-V indicator into the GKD-C 1 indicator: "Input into C1 or Backtest"
5. Inside the GKD-C 2 indicator, change the "Confirmation Type" setting to "Confirmation 2"
6. Import the GKD-C 1 indicator into the GKD-C 2 indicator: "Input into C2"
7. Inside the GKD-C Continuation indicator, change the "Confirmation Type" setting to "Continuation"
8. Import the GKD-C Continuation indicator into the GKD-E indicator: "Input into Exit"
9. Inside the GKD-BT Backtest, change the setting "Backtest Special" to "GKD Full w/ Exits"
10. Import the GKD-E into the GKD-BT Backtest: "Input into Backtest"
Baseline + Volatility/Volume (Baseline, Volatility/Volume, Backtest)
1. Inside the GKD-V indicator, change the "Testing Type" setting to "Baseline + Volatility/Volume"
2. Inside the GKD-V indicator, make sure the "Signal Type" setting is set to "Traditional"
3. Import the GKD-B Baseline into the GKD-V indicator: "Input into Volatility/Volume or Backtest (Baseline testing)"
4. Inside the GKD-BT Backtest, change the setting "Backtest Special" to "Baseline + Volatility/Volume"
5. Import the GKD-V into the GKD-BT Backtest: "Input into C1 or Backtest"
6. Inside the GKD-BT Backtest, change the setting "Backtest Type" to "Full". For this backtest, you must test Longs and Shorts separately
7. To allow the system to open multiple orders at one time so you can test all Longs or Shorts, open the GKD-BT Backtest, click the tab "Properties" and then insert a value of something like 10 orders into the "Pyramiding" settings. This will allow 10 orders to be opened at one time which should be enough to catch all possible Longs or Shorts.
Requirements
Inputs
Confirmation 1: GKD-V Volatility / Volume indicator
Confirmation 2: GKD-C Confirmation indicator
Continuation: GKD-C Confirmation indicator
Solo Confirmation Simple: GKD-B Baseline
Solo Confirmation Complex: GKD-V Volatility / Volume indicator
Solo Confirmation Super Complex: GKD-V Volatility / Volume indicator
Stacked 1: None
Stacked 2+: GKD-C, GKD-V, or GKD-B Stacked 1
Outputs
Confirmation 1: GKD-C Confirmation 2 indicator
Confirmation 2: GKD-C Continuation indicator
Continuation: GKD-E Exit indicator
Solo Confirmation Simple: GKD-BT Backtest
Solo Confirmation Complex: GKD-BT Backtest or GKD-E Exit indicator
Solo Confirmation Super Complex: GKD-C Continuation indicator
Stacked 1: GKD-C, GKD-V, or GKD-B Stacked 2+
Stacked 2+: GKD-C, GKD-V, or GKD-B Stacked 2+ or GKD-BT Backtest
Additional features will be added in future releases.
GKD-C STD-Filtered Jurik Volty Adaptive TEMA [Loxx]Giga Kaleidoscope GKD-C STD-Filtered Jurik Volty Adaptive TEMA is a Confirmation module included in Loxx's "Giga Kaleidoscope Modularized Trading System".
█ Giga Kaleidoscope Modularized Trading System
What is Loxx's "Giga Kaleidoscope Modularized Trading System"?
The Giga Kaleidoscope Modularized Trading System is a trading system built on the philosophy of the NNFX (No Nonsense Forex) algorithmic trading.
What is the NNFX algorithmic trading strategy?
The NNFX (No-Nonsense Forex) trading system is a comprehensive approach to Forex trading that is designed to simplify the process and remove the confusion and complexity that often surrounds trading. The system was developed by a Forex trader who goes by the pseudonym "VP" and has gained a significant following in the Forex community.
The NNFX trading system is based on a set of rules and guidelines that help traders make objective and informed decisions. These rules cover all aspects of trading, including market analysis, trade entry, stop loss placement, and trade management.
Here are the main components of the NNFX trading system:
1. Trading Philosophy: The NNFX trading system is based on the idea that successful trading requires a comprehensive understanding of the market, objective analysis, and strict risk management. The system aims to remove subjective elements from trading and focuses on objective rules and guidelines.
2. Technical Analysis: The NNFX trading system relies heavily on technical analysis and uses a range of indicators to identify high-probability trading opportunities. The system uses a combination of trend-following and mean-reverting strategies to identify trades.
3. Market Structure: The NNFX trading system emphasizes the importance of understanding the market structure, including price action, support and resistance levels, and market cycles. The system uses a range of tools to identify the market structure, including trend lines, channels, and moving averages.
4. Trade Entry: The NNFX trading system has strict rules for trade entry. The system uses a combination of technical indicators to identify high-probability trades, and traders must meet specific criteria to enter a trade.
5. Stop Loss Placement: The NNFX trading system places a significant emphasis on risk management and requires traders to place a stop loss order on every trade. The system uses a combination of technical analysis and market structure to determine the appropriate stop loss level.
6. Trade Management: The NNFX trading system has specific rules for managing open trades. The system aims to minimize risk and maximize profit by using a combination of trailing stops, take profit levels, and position sizing.
Overall, the NNFX trading system is designed to be a straightforward and easy-to-follow approach to Forex trading that can be applied by traders of all skill levels.
Core components of an NNFX algorithmic trading strategy
The NNFX algorithm is built on the principles of trend, momentum, and volatility. There are six core components in the NNFX trading algorithm:
1. Volatility - price volatility; e.g., Average True Range, True Range Double, Close-to-Close, etc.
2. Baseline - a moving average to identify price trend
3. Confirmation 1 - a technical indicator used to identify trends
4. Confirmation 2 - a technical indicator used to identify trends
5. Continuation - a technical indicator used to identify trends
6. Volatility/Volume - a technical indicator used to identify volatility/volume breakouts/breakdown
7. Exit - a technical indicator used to determine when a trend is exhausted
What is Volatility in the NNFX trading system?
In the NNFX (No Nonsense Forex) trading system, ATR (Average True Range) is typically used to measure the volatility of an asset. It is used as a part of the system to help determine the appropriate stop loss and take profit levels for a trade. ATR is calculated by taking the average of the true range values over a specified period.
True range is calculated as the maximum of the following values:
-Current high minus the current low
-Absolute value of the current high minus the previous close
-Absolute value of the current low minus the previous close
ATR is a dynamic indicator that changes with changes in volatility. As volatility increases, the value of ATR increases, and as volatility decreases, the value of ATR decreases. By using ATR in NNFX system, traders can adjust their stop loss and take profit levels according to the volatility of the asset being traded. This helps to ensure that the trade is given enough room to move, while also minimizing potential losses.
Other types of volatility include True Range Double (TRD), Close-to-Close, and Garman-Klass
What is a Baseline indicator?
The baseline is essentially a moving average, and is used to determine the overall direction of the market.
The baseline in the NNFX system is used to filter out trades that are not in line with the long-term trend of the market. The baseline is plotted on the chart along with other indicators, such as the Moving Average (MA), the Relative Strength Index (RSI), and the Average True Range (ATR).
Trades are only taken when the price is in the same direction as the baseline. For example, if the baseline is sloping upwards, only long trades are taken, and if the baseline is sloping downwards, only short trades are taken. This approach helps to ensure that trades are in line with the overall trend of the market, and reduces the risk of entering trades that are likely to fail.
By using a baseline in the NNFX system, traders can have a clear reference point for determining the overall trend of the market, and can make more informed trading decisions. The baseline helps to filter out noise and false signals, and ensures that trades are taken in the direction of the long-term trend.
What is a Confirmation indicator?
Confirmation indicators are technical indicators that are used to confirm the signals generated by primary indicators. Primary indicators are the core indicators used in the NNFX system, such as the Average True Range (ATR), the Moving Average (MA), and the Relative Strength Index (RSI).
The purpose of the confirmation indicators is to reduce false signals and improve the accuracy of the trading system. They are designed to confirm the signals generated by the primary indicators by providing additional information about the strength and direction of the trend.
Some examples of confirmation indicators that may be used in the NNFX system include the Bollinger Bands, the MACD (Moving Average Convergence Divergence), and the MACD Oscillator. These indicators can provide information about the volatility, momentum, and trend strength of the market, and can be used to confirm the signals generated by the primary indicators.
In the NNFX system, confirmation indicators are used in combination with primary indicators and other filters to create a trading system that is robust and reliable. By using multiple indicators to confirm trading signals, the system aims to reduce the risk of false signals and improve the overall profitability of the trades.
What is a Continuation indicator?
In the NNFX (No Nonsense Forex) trading system, a continuation indicator is a technical indicator that is used to confirm a current trend and predict that the trend is likely to continue in the same direction. A continuation indicator is typically used in conjunction with other indicators in the system, such as a baseline indicator, to provide a comprehensive trading strategy.
What is a Volatility/Volume indicator?
Volume indicators, such as the On Balance Volume (OBV), the Chaikin Money Flow (CMF), or the Volume Price Trend (VPT), are used to measure the amount of buying and selling activity in a market. They are based on the trading volume of the market, and can provide information about the strength of the trend. In the NNFX system, volume indicators are used to confirm trading signals generated by the Moving Average and the Relative Strength Index. Volatility indicators include Average Direction Index, Waddah Attar, and Volatility Ratio. In the NNFX trading system, volatility is a proxy for volume and vice versa.
By using volume indicators as confirmation tools, the NNFX trading system aims to reduce the risk of false signals and improve the overall profitability of trades. These indicators can provide additional information about the market that is not captured by the primary indicators, and can help traders to make more informed trading decisions. In addition, volume indicators can be used to identify potential changes in market trends and to confirm the strength of price movements.
What is an Exit indicator?
The exit indicator is used in conjunction with other indicators in the system, such as the Moving Average (MA), the Relative Strength Index (RSI), and the Average True Range (ATR), to provide a comprehensive trading strategy.
The exit indicator in the NNFX system can be any technical indicator that is deemed effective at identifying optimal exit points. Examples of exit indicators that are commonly used include the Parabolic SAR, the Average Directional Index (ADX), and the Chandelier Exit.
The purpose of the exit indicator is to identify when a trend is likely to reverse or when the market conditions have changed, signaling the need to exit a trade. By using an exit indicator, traders can manage their risk and prevent significant losses.
In the NNFX system, the exit indicator is used in conjunction with a stop loss and a take profit order to maximize profits and minimize losses. The stop loss order is used to limit the amount of loss that can be incurred if the trade goes against the trader, while the take profit order is used to lock in profits when the trade is moving in the trader's favor.
Overall, the use of an exit indicator in the NNFX trading system is an important component of a comprehensive trading strategy. It allows traders to manage their risk effectively and improve the profitability of their trades by exiting at the right time.
How does Loxx's GKD (Giga Kaleidoscope Modularized Trading System) implement the NNFX algorithm outlined above?
Loxx's GKD v1.0 system has five types of modules (indicators/strategies). These modules are:
1. GKD-BT - Backtesting module (Volatility, Number 1 in the NNFX algorithm)
2. GKD-B - Baseline module (Baseline and Volatility/Volume, Numbers 1 and 2 in the NNFX algorithm)
3. GKD-C - Confirmation 1/2 and Continuation module (Confirmation 1/2 and Continuation, Numbers 3, 4, and 5 in the NNFX algorithm)
4. GKD-V - Volatility/Volume module (Confirmation 1/2, Number 6 in the NNFX algorithm)
5. GKD-E - Exit module (Exit, Number 7 in the NNFX algorithm)
(additional module types will added in future releases)
Each module interacts with every module by passing data between modules. Data is passed between each module as described below:
GKD-B => GKD-V => GKD-C(1) => GKD-C(2) => GKD-C(Continuation) => GKD-E => GKD-BT
That is, the Baseline indicator passes its data to Volatility/Volume. The Volatility/Volume indicator passes its values to the Confirmation 1 indicator. The Confirmation 1 indicator passes its values to the Confirmation 2 indicator. The Confirmation 2 indicator passes its values to the Continuation indicator. The Continuation indicator passes its values to the Exit indicator, and finally, the Exit indicator passes its values to the Backtest strategy.
This chaining of indicators requires that each module conform to Loxx's GKD protocol, therefore allowing for the testing of every possible combination of technical indicators that make up the six components of the NNFX algorithm.
What does the application of the GKD trading system look like?
Example trading system:
Backtest: Strategy with 1-3 take profits, trailing stop loss, multiple types of PnL volatility, and 2 backtesting styles
Baseline: Hull Moving Average
Volatility/Volume: Hurst Exponent
Confirmation 1: STD-Filtered Jurik Volty Adaptive TEMA as shown on the chart above
Confirmation 2: Williams Percent Range
Continuation: Fisher Transform
Exit: Rex Oscillator
Each GKD indicator is denoted with a module identifier of either: GKD-BT, GKD-B, GKD-C, GKD-V, or GKD-E. This allows traders to understand to which module each indicator belongs and where each indicator fits into the GKD protocol chain.
Giga Kaleidoscope Modularized Trading System Signals (based on the NNFX algorithm)
Standard Entry
1. GKD-C Confirmation 1 Signal
2. GKD-B Baseline agrees
3. Price is within a range of 0.2x Volatility and 1.0x Volatility of the Goldie Locks Mean
4. GKD-C Confirmation 2 agrees
5. GKD-V Volatility/Volume agrees
Baseline Entry
1. GKD-B Baseline signal
2. GKD-C Confirmation 1 agrees
3. Price is within a range of 0.2x Volatility and 1.0x Volatility of the Goldie Locks Mean
4. GKD-C Confirmation 2 agrees
5. GKD-V Volatility/Volume agrees
6. GKD-C Confirmation 1 signal was less than 7 candles prior
Volatility/Volume Entry
1. GKD-V Volatility/Volume signal
2. GKD-C Confirmation 1 agrees
3. Price is within a range of 0.2x Volatility and 1.0x Volatility of the Goldie Locks Mean
4. GKD-C Confirmation 2 agrees
5. GKD-B Baseline agrees
6. GKD-C Confirmation 1 signal was less than 7 candles prior
Continuation Entry
1. Standard Entry, Baseline Entry, or Pullback; entry triggered previously
2. GKD-B Baseline hasn't crossed since entry signal trigger
3. GKD-C Confirmation Continuation Indicator signals
4. GKD-C Confirmation 1 agrees
5. GKD-B Baseline agrees
6. GKD-C Confirmation 2 agrees
1-Candle Rule Standard Entry
1. GKD-C Confirmation 1 signal
2. GKD-B Baseline agrees
3. Price is within a range of 0.2x Volatility and 1.0x Volatility of the Goldie Locks Mean
Next Candle:
1. Price retraced (Long: close < close or Short: close > close )
2. GKD-B Baseline agrees
3. GKD-C Confirmation 1 agrees
4. GKD-C Confirmation 2 agrees
5. GKD-V Volatility/Volume agrees
1-Candle Rule Baseline Entry
1. GKD-B Baseline signal
2. GKD-C Confirmation 1 agrees
3. Price is within a range of 0.2x Volatility and 1.0x Volatility of the Goldie Locks Mean
4. GKD-C Confirmation 1 signal was less than 7 candles prior
Next Candle:
1. Price retraced (Long: close < close or Short: close > close )
2. GKD-B Baseline agrees
3. GKD-C Confirmation 1 agrees
4. GKD-C Confirmation 2 agrees
5. GKD-V Volatility/Volume Agrees
1-Candle Rule Volatility/Volume Entry
1. GKD-V Volatility/Volume signal
2. GKD-C Confirmation 1 agrees
3. Price is within a range of 0.2x Volatility and 1.0x Volatility of the Goldie Locks Mean
4. GKD-C Confirmation 1 signal was less than 7 candles prior
Next Candle:
1. Price retraced (Long: close < close or Short: close > close)
2. GKD-B Volatility/Volume agrees
3. GKD-C Confirmation 1 agrees
4. GKD-C Confirmation 2 agrees
5. GKD-B Baseline agrees
PullBack Entry
1. GKD-B Baseline signal
2. GKD-C Confirmation 1 agrees
3. Price is beyond 1.0x Volatility of Baseline
Next Candle:
1. Price is within a range of 0.2x Volatility and 1.0x Volatility of the Goldie Locks Mean
2. GKD-C Confirmation 1 agrees
3. GKD-C Confirmation 2 agrees
4. GKD-V Volatility/Volume Agrees
]█ Setting up the GKD
The GKD system involves chaining indicators together. These are the steps to set this up.
Use a GKD-C indicator alone on a chart
1. Inside the GKD-C indicator, change the "Confirmation Type" setting to "Solo Confirmation Simple"
Use a GKD-V indicator alone on a chart
**nothing, it's already useable on the chart without any settings changes
Use a GKD-B indicator alone on a chart
**nothing, it's already useable on the chart without any settings changes
Baseline (Baseline, Backtest)
1. Import the GKD-B Baseline into the GKD-BT Backtest: "Input into Volatility/Volume or Backtest (Baseline testing)"
2. Inside the GKD-BT Backtest, change the setting "Backtest Special" to "Baseline"
Volatility/Volume (Volatility/Volume, Backte st)
1. Inside the GKD-V indicator, change the "Testing Type" setting to "Solo"
2. Inside the GKD-V indicator, change the "Signal Type" setting to "Crossing" (neither traditional nor both can be backtested)
3. Import the GKD-V indicator into the GKD-BT Backtest: "Input into C1 or Backtest"
4. Inside the GKD-BT Backtest, change the setting "Backtest Special" to "Volatility/Volume"
5. Inside the GKD-BT Backtest, a) change the setting "Backtest Type" to "Trading" if using a directional GKD-V indicator; or, b) change the setting "Backtest Type" to "Full" if using a directional or non-directional GKD-V indicator (non-directional GKD-V can only test Longs and Shorts separately)
6. If "Backtest Type" is set to "Full": Inside the GKD-BT Backtest, change the setting "Backtest Side" to "Long" or "Short
7. If "Backtest Type" is set to "Full": To allow the system to open multiple orders at one time so you test all Longs or Shorts, open the GKD-BT Backtest, click the tab "Properties" and then insert a value of something like 10 orders into the "Pyramiding" settings. This will allow 10 orders to be opened at one time which should be enough to catch all possible Longs or Shorts.
Solo Confirmation Simple (Confirmation, Backtest)
1. Inside the GKD-C indicator, change the "Confirmation Type" setting to "Solo Confirmation Simple"
1. Import the GKD-C indicator into the GKD-BT Backtest: "Input into Backtest"
2. Inside the GKD-BT Backtest, change the setting "Backtest Special" to "Solo Confirmation Simple"
Solo Confirmation Complex without Exits (Baseline, Volatility/Volume, Confirmation, Backtest)
1. Inside the GKD-V indicator, change the "Testing Type" setting to "Chained"
2. Import the GKD-B Baseline into the GKD-V indicator: "Input into Volatility/Volume or Backtest (Baseline testing)"
3. Inside the GKD-C indicator, change the "Confirmation Type" setting to "Solo Confirmation Complex"
4. Import the GKD-V indicator into the GKD-C indicator: "Input into C1 or Backtest"
5. Inside the GKD-BT Backtest, change the setting "Backtest Special" to "GKD Full wo/ Exits"
6. Import the GKD-C into the GKD-BT Backtest: "Input into Exit or Backtest"
Solo Confirmation Complex with Exits (Baseline, Volatility/Volume, Confirmation, Exit, Backtest)
1. Inside the GKD-V indicator, change the "Testing Type" setting to "Chained"
2. Import the GKD-B Baseline into the GKD-V indicator: "Input into Volatility/Volume or Backtest (Baseline testing)"
3. Inside the GKD-C indicator, change the "Confirmation Type" setting to "Solo Confirmation Complex"
4. Import the GKD-V indicator into the GKD-C indicator: "Input into C1 or Backtest"
5. Import the GKD-C indicator into the GKD-E indicator: "Input into Exit"
6. Inside the GKD-BT Backtest, change the setting "Backtest Special" to "GKD Full w/ Exits"
7. Import the GKD-E into the GKD-BT Backtest: "Input into Backtest"
Full GKD without Exits (Baseline, Volatility/Volume, Confirmation 1, Confirmation 2, Continuation, Backtest)
1. Inside the GKD-V indicator, change the "Testing Type" setting to "Chained"
2. Import the GKD-B Baseline into the GKD-V indicator: "Input into Volatility/Volume or Backtest (Baseline testing)"
3. Inside the GKD-C 1 indicator, change the "Confirmation Type" setting to "Confirmation 1"
4. Import the GKD-V indicator into the GKD-C 1 indicator: "Input into C1 or Backtest"
5. Inside the GKD-C 2 indicator, change the "Confirmation Type" setting to "Confirmation 2"
6. Import the GKD-C 1 indicator into the GKD-C 2 indicator: "Input into C2"
7. Inside the GKD-C Continuation indicator, change the "Confirmation Type" setting to "Continuation"
8. Inside the GKD-BT Backtest, change the setting "Backtest Special" to "GKD Full wo/ Exits"
9. Import the GKD-E into the GKD-BT Backtest: "Input into Exit or Backtest"
Full GKD with Exits (Baseline, Volatility/Volume, Confirmation 1, Confirmation 2, Continuation, Exit, Backtest)
1. Inside the GKD-V indicator, change the "Testing Type" setting to "Chained"
2. Import the GKD-B Baseline into the GKD-V indicator: "Input into Volatility/Volume or Backtest (Baseline testing)"
3. Inside the GKD-C 1 indicator, change the "Confirmation Type" setting to "Confirmation 1"
4. Import the GKD-V indicator into the GKD-C 1 indicator: "Input into C1 or Backtest"
5. Inside the GKD-C 2 indicator, change the "Confirmation Type" setting to "Confirmation 2"
6. Import the GKD-C 1 indicator into the GKD-C 2 indicator: "Input into C2"
7. Inside the GKD-C Continuation indicator, change the "Confirmation Type" setting to "Continuation"
8. Import the GKD-C Continuation indicator into the GKD-E indicator: "Input into Exit"
9. Inside the GKD-BT Backtest, change the setting "Backtest Special" to "GKD Full w/ Exits"
10. Import the GKD-E into the GKD-BT Backtest: "Input into Backtest"
Baseline + Volatility/Volume (Baseline, Volatility/Volume, Backtest)
1. Inside the GKD-V indicator, change the "Testing Type" setting to "Baseline + Volatility/Volume"
2. Inside the GKD-V indicator, make sure the "Signal Type" setting is set to "Traditional"
3. Import the GKD-B Baseline into the GKD-V indicator: "Input into Volatility/Volume or Backtest (Baseline testing)"
4. Inside the GKD-BT Backtest, change the setting "Backtest Special" to "Baseline + Volatility/Volume"
5. Import the GKD-V into the GKD-BT Backtest: "Input into C1 or Backtest"
6. Inside the GKD-BT Backtest, change the setting "Backtest Type" to "Full". For this backtest, you must test Longs and Shorts separately
7. To allow the system to open multiple orders at one time so you can test all Longs or Shorts, open the GKD-BT Backtest, click the tab "Properties" and then insert a value of something like 10 orders into the "Pyramiding" settings. This will allow 10 orders to be opened at one time which should be enough to catch all possible Longs or Shorts.
█ GKD-C STD-Filtered Jurik Volty Adaptive TEMA
The STD-Filtered Jurik Volty Adaptive TEMA is an advanced moving average overlay indicator that incorporates adaptive period inputs from Jurik Volty into a Triple Exponential Moving Average (TEMA). The resulting value is further refined using a standard deviation filter to minimize noise. This adaptation aims to develop a faster TEMA that leads the standard, non-adaptive TEMA. However, during periods of low volatility, the output may be noisy, so a standard deviation filter is employed to decrease choppiness, yielding a highly responsive TEMA without the noise typically caused by low market volatility.
What is Jurik Volty?
Jurik Volty calculates the price volatility and relative price volatility factor.
The Jurik smoothing includes 3 stages:
1st stage - Preliminary smoothing by adaptive EMA
2nd stage - One more preliminary smoothing by Kalman filter
3rd stage - Final smoothing by unique Jurik adaptive filter
Here's a breakdown of the code:
1. volty(float src, int len) => defines a function called volty that takes two arguments: src, which represents the source price data (like close price), and len, which represents the length or period for calculating the indicator.
2. int avgLen = 65 sets the length for the Simple Moving Average (SMA) to 65.
3. Various variables are initialized like volty, voltya, bsmax, bsmin, and vsum.
4. len1 is calculated as math.max(math.log(math.sqrt(0.5 * (len-1))) / math.log(2.0) + 2.0, 0); this expression involves some mathematical transformations based on the len input. The purpose is to create a dynamic factor that will be used later in the calculations.
5. pow1 is calculated as math.max(len1 - 2.0, 0.5); this variable is another dynamic factor used in further calculations.
6. del1 and del2 represent the differences between the current src value and the previous values of bsmax and bsmin, respectively.
7. volty is assigned a value based on a conditional expression, which checks whether the absolute value of del1 is greater than the absolute value of del2. This step is essential for determining the direction and magnitude of the price change.
8. vsum is updated based on the previous value and the difference between the current and previous volty values.
9. The Simple Moving Average (SMA) of vsum is calculated with the length avgLen and assigned to avg.
10. Variables dVolty, pow2, len2, and Kv are calculated using various mathematical transformations based on previously calculated variables. These variables are used to adjust the Jurik Volty indicator based on the observed volatility.
11. The bsmax and bsmin variables are updated based on the calculated Kv value and the direction of the price change.
12. inally, the temp variable is calculated as the ratio of avolty to vsum. This value represents the Jurik Volty indicator's output and can be used to analyze the market trends and potential reversals.
Jurik Volty can be used to identify periods of high or low volatility and to spot potential trade setups based on price behavior near the volatility bands.
What is the Triple Exponential Moving Average?
The Triple Exponential Moving Average (TEMA) is a technical indicator used by traders and investors to identify trends and price reversals in financial markets. It is a more advanced and responsive version of the Exponential Moving Average (EMA). TEMA was developed by Patrick Mulloy and introduced in the January 1994 issue of Technical Analysis of Stocks & Commodities magazine. The aim of TEMA is to minimize the lag associated with single and double exponential moving averages while also filtering out market noise, thus providing a smoother, more accurate representation of the market trend.
To understand TEMA, let's first briefly review the EMA.
Exponential Moving Average (EMA):
EMA is a weighted moving average that gives more importance to recent price data. The formula for EMA is:
EMA_t = (Price_t * α) + (EMA_(t-1) * (1 - α))
Where:
EMA_t: EMA at time t
Price_t: Price at time t
α: Smoothing factor (α = 2 / (N + 1))
N: Length of the moving average period
EMA_(t-1): EMA at time t-1
Triple Exponential Moving Average (TEMA):
Triple Exponential Moving Average (TEMA):
TEMA combines three exponential moving averages to provide a more accurate and responsive trend indicator. The formula for TEMA is:
TEMA = 3 * EMA_1 - 3 * EMA_2 + EMA_3
Where:
EMA_1: The first EMA of the price data
EMA_2: The EMA of EMA_1
EMA_3: The EMA of EMA_2
Here are the steps to calculate TEMA:
1. Choose the length of the moving average period (N).
2. Calculate the smoothing factor α (α = 2 / (N + 1)).
3. Calculate the first EMA (EMA_1) using the price data and the smoothing factor α.
4. Calculate the second EMA (EMA_2) using the values of EMA_1 and the same smoothing factor α.
5. Calculate the third EMA (EMA_3) using the values of EMA_2 and the same smoothing factor α.
5. Finally, compute the TEMA using the formula: TEMA = 3 * EMA_1 - 3 * EMA_2 + EMA_3
The Triple Exponential Moving Average, with its combination of three EMAs, helps to reduce the lag and filter out market noise more effectively than a single or double EMA. It is particularly useful for short-term traders who require a responsive indicator to capture rapid price changes. Keep in mind, however, that TEMA is still a lagging indicator, and as with any technical analysis tool, it should be used in conjunction with other indicators and analysis methods to make well-informed trading decisions.
Requirements
Inputs
Confirmation 1: GKD-V Volatility / Volume indicator
Confirmation 2: GKD-C Confirmation indicator
Continuation: GKD-C Confirmation indicator
Solo Confirmation Simple: GKD-B Baseline
Solo Confirmation Complex: GKD-V Volatility / Volume indicator
Solo Confirmation Super Complex: GKD-V Volatility / Volume indicator
Stacked 1: None
Stacked 2+: GKD-C, GKD-V, or GKD-B Stacked 1
Outputs
Confirmation 1: GKD-C Confirmation 2 indicator
Confirmation 2: GKD-C Continuation indicator
Continuation: GKD-E Exit indicator
Solo Confirmation Simple: GKD-BT Backtest
Solo Confirmation Complex: GKD-BT Backtest or GKD-E Exit indicator
Solo Confirmation Super Complex: GKD-C Continuation indicator
Stacked 1: GKD-C, GKD-V, or GKD-B Stacked 2+
Stacked 2+: GKD-C, GKD-V, or GKD-B Stacked 2+ or GKD-BT Backtest
Additional features will be added in future releases.

STD-Filtered Jurik Volty Adaptive TEMA [Loxx]The STD-Filtered Jurik Volty Adaptive TEMA is an advanced moving average overlay indicator that incorporates adaptive period inputs from Jurik Volty into a Triple Exponential Moving Average (TEMA). The resulting value is further refined using a standard deviation filter to minimize noise. This adaptation aims to develop a faster TEMA that leads the standard, non-adaptive TEMA. However, during periods of low volatility, the output may be noisy, so a standard deviation filter is employed to decrease choppiness, yielding a highly responsive TEMA without the noise typically caused by low market volatility.
█ What is Jurik Volty?
Jurik Volty calculates the price volatility and relative price volatility factor.
The Jurik smoothing includes 3 stages:
1st stage - Preliminary smoothing by adaptive EMA
2nd stage - One more preliminary smoothing by Kalman filter
3rd stage - Final smoothing by unique Jurik adaptive filter
Here's a breakdown of the code:
1. volty(float src, int len) => defines a function called volty that takes two arguments: src, which represents the source price data (like close price), and len, which represents the length or period for calculating the indicator.
2. int avgLen = 65 sets the length for the Simple Moving Average (SMA) to 65.
3. Various variables are initialized like volty, voltya, bsmax, bsmin, and vsum.
4. len1 is calculated as math.max(math.log(math.sqrt(0.5 * (len-1))) / math.log(2.0) + 2.0, 0); this expression involves some mathematical transformations based on the len input. The purpose is to create a dynamic factor that will be used later in the calculations.
5. pow1 is calculated as math.max(len1 - 2.0, 0.5); this variable is another dynamic factor used in further calculations.
6. del1 and del2 represent the differences between the current src value and the previous values of bsmax and bsmin, respectively.
7. volty is assigned a value based on a conditional expression, which checks whether the absolute value of del1 is greater than the absolute value of del2. This step is essential for determining the direction and magnitude of the price change.
8. vsum is updated based on the previous value and the difference between the current and previous volty values.
9. The Simple Moving Average (SMA) of vsum is calculated with the length avgLen and assigned to avg.
10. Variables dVolty, pow2, len2, and Kv are calculated using various mathematical transformations based on previously calculated variables. These variables are used to adjust the Jurik Volty indicator based on the observed volatility.
11. The bsmax and bsmin variables are updated based on the calculated Kv value and the direction of the price change.
12. inally, the temp variable is calculated as the ratio of avolty to vsum. This value represents the Jurik Volty indicator's output and can be used to analyze the market trends and potential reversals.
Jurik Volty can be used to identify periods of high or low volatility and to spot potential trade setups based on price behavior near the volatility bands.
█ What is the Triple Exponential Moving Average?
The Triple Exponential Moving Average (TEMA) is a technical indicator used by traders and investors to identify trends and price reversals in financial markets. It is a more advanced and responsive version of the Exponential Moving Average (EMA). TEMA was developed by Patrick Mulloy and introduced in the January 1994 issue of Technical Analysis of Stocks & Commodities magazine. The aim of TEMA is to minimize the lag associated with single and double exponential moving averages while also filtering out market noise, thus providing a smoother, more accurate representation of the market trend.
To understand TEMA, let's first briefly review the EMA.
Exponential Moving Average (EMA):
EMA is a weighted moving average that gives more importance to recent price data. The formula for EMA is:
EMA_t = (Price_t * α) + (EMA_(t-1) * (1 - α))
Where:
EMA_t: EMA at time t
Price_t: Price at time t
α: Smoothing factor (α = 2 / (N + 1))
N: Length of the moving average period
EMA_(t-1): EMA at time t-1
Triple Exponential Moving Average (TEMA):
Triple Exponential Moving Average (TEMA):
TEMA combines three exponential moving averages to provide a more accurate and responsive trend indicator. The formula for TEMA is:
TEMA = 3 * EMA_1 - 3 * EMA_2 + EMA_3
Where:
EMA_1: The first EMA of the price data
EMA_2: The EMA of EMA_1
EMA_3: The EMA of EMA_2
Here are the steps to calculate TEMA:
1. Choose the length of the moving average period (N).
2. Calculate the smoothing factor α (α = 2 / (N + 1)).
3. Calculate the first EMA (EMA_1) using the price data and the smoothing factor α.
4. Calculate the second EMA (EMA_2) using the values of EMA_1 and the same smoothing factor α.
5. Calculate the third EMA (EMA_3) using the values of EMA_2 and the same smoothing factor α.
5. Finally, compute the TEMA using the formula: TEMA = 3 * EMA_1 - 3 * EMA_2 + EMA_3
The Triple Exponential Moving Average, with its combination of three EMAs, helps to reduce the lag and filter out market noise more effectively than a single or double EMA. It is particularly useful for short-term traders who require a responsive indicator to capture rapid price changes. Keep in mind, however, that TEMA is still a lagging indicator, and as with any technical analysis tool, it should be used in conjunction with other indicators and analysis methods to make well-informed trading decisions.
Extras
Signals
Alerts
Bar coloring
Loxx's Expanded Source Types (see below):
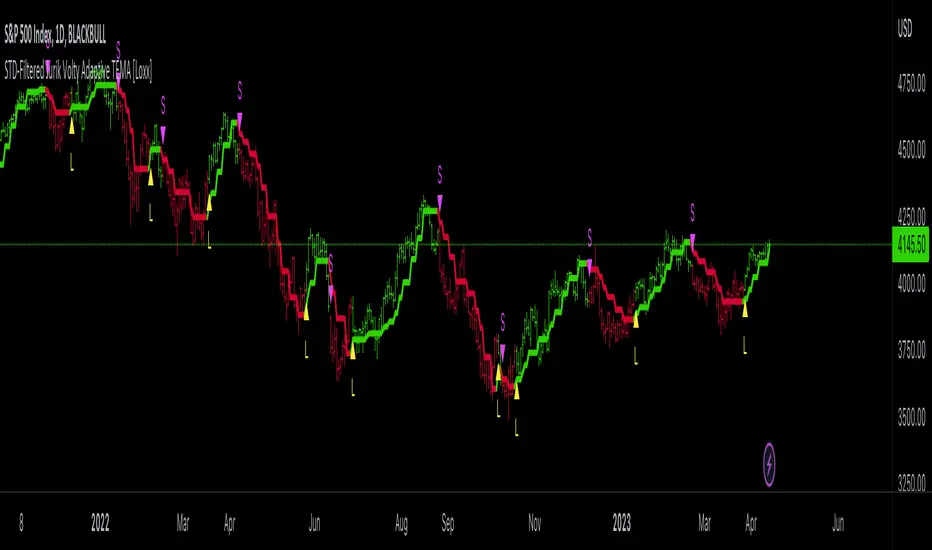
Zero-lag TEMA Crosses [Loxx]Zero-lag TEMA Crosses is a spinoff of a the Zero-lag MA as described by David Stendahl in the April 2000 issue of the journal "Technical Analysis of Stocks and Commodities". This indicator uses TEMA calculation mode in order to make the lag lesser compared to the original Zero-lag MA, and that makes this version even faster than the Zero-lag DEMA too. This indicator is the difference between a Fast and Slow Zero-lag TEMA. This indicator is very useful for lower timeframe scalping.
What is the Zero-lag MA?
The Zero-lag MA (Zero-Lag Moving Average) is a technical indicator that was introduced in the April 2000 issue of the journal "Technical Analysis of Stocks and Commodities" by David Stendahl.
The Zero-lag MA is a type of moving average (MA) that is designed to reduce or eliminate the lag that is typically associated with traditional moving averages. Moving averages are a widely used technical analysis tool that helps traders to identify trends and potential trading opportunities. They work by calculating the average price of a security over a given period of time, and then plotting that average on a chart. The most commonly used moving averages are simple moving averages (SMAs) and exponential moving averages (EMAs).
The problem with traditional moving averages is that they can be slow to respond to changes in market conditions. This lag can cause traders to miss out on potential trading opportunities, or to enter or exit trades at the wrong time. The Zero-lag MA was developed as a solution to this problem.
The Zero-lag MA is calculated using a combination of two EMAs and a subtraction formula. The first step in calculating the Zero-lag MA is to calculate two exponential moving averages: a fast EMA and a slow EMA. The fast EMA is calculated over a shorter period of time than the slow EMA. The exact period lengths will depend on the trader's preferences and the security being analyzed.
Once the two EMAs have been calculated, the next step is to take the difference between them. This difference represents the current market trend, with a positive value indicating an uptrend and a negative value indicating a downtrend. However, this difference alone is not enough to create a useful indicator, as it can still suffer from lag.
To further reduce lag, the difference between the two EMAs is multiplied by a factor derived from a third, slower EMA. This slower EMA acts as a smoothing factor, helping to reduce noise and make the indicator more accurate. The exact period length of the slower EMA will depend on the trader's preferences and the security being analyzed.
The final step in calculating the Zero-lag MA is to add the result of the multiplication to the fast EMA. This produces a final value that represents the current market trend with reduced lag. The Zero-lag MA can be plotted on a chart like any other moving average, and can be used to identify trends, potential trading opportunities, and support and resistance levels.
Overall, the Zero-lag MA is designed to provide traders with a more accurate representation of current market conditions by reducing the lag time between price changes and the moving average. By doing so, it can help traders to make more informed trading decisions and improve their overall profitability.
What is the TEMA?
The triple exponential moving average (TEMA) is a technical analysis indicator that was developed to reduce the lag of traditional moving averages, such as the simple moving average (SMA) or the exponential moving average (EMA). The TEMA was first introduced by Patrick Mulloy in the January 1994 issue of the "Technical Analysis of Stocks and Commodities" magazine.
The TEMA is a type of moving average that is calculated by applying multiple exponential smoothing techniques to price data. Unlike traditional moving averages, which apply a single smoothing factor to price data, the TEMA applies three smoothing factors to produce a more responsive and accurate indicator.
To calculate the TEMA, the following steps are taken:
Calculate the single exponential moving average (SMA) of the price data over a given period.
Calculate the double exponential moving average (DEMA) of the SMA over the same period.
Calculate the triple exponential moving average (TEMA) of the DEMA over the same period.
The formula for calculating the TEMA is:
TEMA = 3 * EMA(SMA) - 3 * EMA(EMA(SMA)) + EMA(EMA(EMA(SMA)))
where EMA is the exponential moving average and SMA is the simple moving average.
The TEMA is designed to reduce the lag associated with traditional moving averages by applying multiple smoothing factors to the price data. This helps to filter out short-term price fluctuations and provide a smoother indicator of the underlying trend. The TEMA is also less susceptible to whipsaws, which occur when a security's price moves in one direction and then quickly reverses, causing false trading signals.
The TEMA can be used in a variety of ways in technical analysis. It can be used to identify trends, determine support and resistance levels, and generate trading signals. When the TEMA is rising, it is generally interpreted as a bullish signal, indicating that the price is trending higher. When the TEMA is falling, it is generally interpreted as a bearish signal, indicating that the price is trending lower.
In summary, the TEMA is a more responsive and accurate indicator than traditional moving averages, designed to reduce lag and provide a smoother representation of the underlying trend. It is a useful tool for technical analysts and traders looking to identify trends, support and resistance levels, and potential trading opportunities.
Extras
Alerts
Bar coloring
Signals
Loxx's Expanded Source Types, see here:
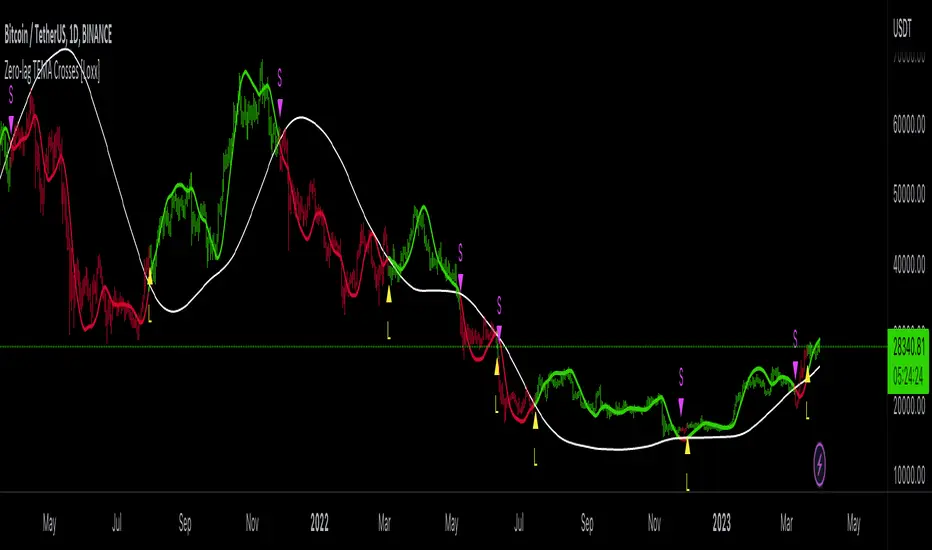
Multiple Indicators ScreenerThis is a stock screener that incorporates open source code by QuantNomad, with the addition of slow and fast EMA pullback and crossover functions. It is designed for intraday scalping and quick trades, using 1, 3, and 5 minute candles. The RSI, Supertrend, and ADX indicators help to confirm trade setups, and the use of discount, premium, and equilibrium zones can improve results. With the ability to screen 40 stocks, the screener ensures that no quick action is missed. ]
Disclaimer
It is important to note that any trade initiated using this screener should be well researched, as the creator is not responsible for any profit or loss incurred.
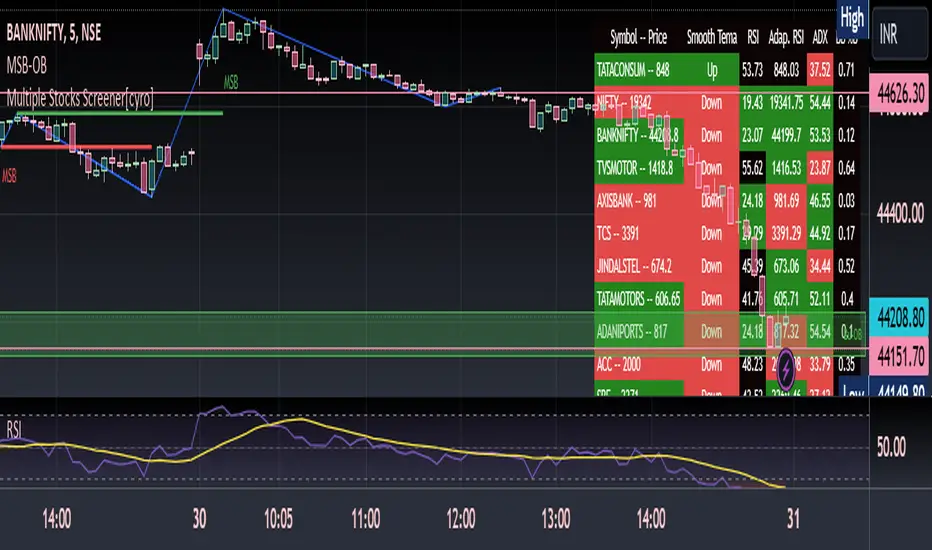
Smooth EMA/DEMA/TEMA/EHMA (SEMA)This is my attempt at smoothing the exponential moving average any its cousins. I literally just smoothed the source and alpha and this is what we got. I really like this because you get a nice smooth yet fast acting moving average that works better than a traditional simple moving average. This script also included directional alerts.
Smooth EMA
Smooth DEMA
Smooth TEMA
Smooth EHMA

Munich GuppyWELCOME to the Munich Guppy!
This is a simple moving average indicator that will help you determine the trend of your chart using historical moving averages.
The indicator consists of 3 EMA's and one ALMA moving average. Using these 4 moving averages I have programmed the relationship between the moving averages to color the background of your chart.
If your background is red, this means that the alma moving average has fallen below the EMA's (EMA1 and EMA 2) as well as (EMA 1 and EMA 2) are postured in a down trending/up trending fashion
For example, the 21EMA is greater than the 55EMA, this signals that the chart has been outperforming its intermediate averages. Now if the ALMA is below both the 21ema and 55ema, in this instance, your chart background will become green.
The ALMA has color options '+CoC' and '-Coc', this simply means if the candle closes below the alma, it will turn red, if closure above it will turn green.
EMA 3 which is default set to 200, has no affect on the color of the background.
Now I hope I have thoroughly explained the simplicity of this indicator, if you have any questions leave them below or private message me for any other requests,
Good Trading!
-CheatCode1

STD-Stepped, Variety N-Tuple Moving Averages [Loxx]STD-Stepped, Variety N-Tuple Moving Averages is the standard deviation stepped/filtered indicator of the following indicator
Variety N-Tuple Moving Averages is a moving average indicator that allows you to create 1- 30 tuple moving average types; i.e., Double-MA, Triple-MA, Quadruple-MA, Quintuple-MA, ... N-tuple-MA. This version contains 5 different moving average types including T3. A list of tuples can be found here if you'd like to name the order of the moving average by depth: Tuples extrapolated
STD-Stepped, You'll notice that this is a lot of code and could normally be packed into a single loop in order to extract the N-tuple MA, however due to Pine Script limitations and processing paradigm this is not possible ... yet.
If you choose the EMA option and select a depth of 2, this is the classic DEMA ; EMA with a depth of 3 is the classic TEMA , and so on and so forth this is to help you understand how this indicator works. This version of NTMA is restricted to a maximum depth of 30 or less. Normally this indicator would include 50 depths but I've cut this down to 30 to reduce indicator load time. In the future, I'll create an updated NTMA that allows for more depth levels.
This is considered one of the top ten indicators in forex. You can read more about it here: forex-station.com
How this works
Step 1: Run factorial calculation on the depth value,
Step 2: Calculate weights of nested moving averages
factorial(nemadepth) / (factorial(nemadepth - k) * factorial(k); where nemadepth is the depth and k is the weight position
Examples of coefficient outputs:
6 Depth: 6 15 20 15 6
7 Depth: 7 21 35 35 21 7
8 Depth: 8 28 56 70 56 28 8
9 Depth: 9 36 34 84 126 126 84 36 9
10 Depth: 10 45 120 210 252 210 120 45 10
11 Depth: 11 55 165 330 462 462 330 165 55 11
12 Depth: 12 66 220 495 792 924 792 495 220 66 12
13 Depth: 13 78 286 715 1287 1716 1716 1287 715 286 78 13
Step 3: Apply coefficient to each moving average
For QEMA, which is 5 depth EMA , the caculation is as follows
ema1 = ta. ema ( src , length)
ema2 = ta. ema (ema1, length)
ema3 = ta. ema (ema2, length)
ema4 = ta. ema (ema3, length)
ema5 = ta. ema (ema4, length)
qema = 5 * ema1 - 10 * ema2 + 10 * ema3 - 5 * ema4 + ema5
Included:
Alerts
Loxx's Expanded Source Types
Bar coloring
Signals
Standard deviation stepping

Variety N-Tuple Moving Averages [Loxx]Variety N-Tuple Moving Averages is a moving average indicator that allows you to create 1- 30 tuple moving average types; i.e., Double-MA, Triple-MA, Quadruple-MA, Quintuple-MA, ... N-tuple-MA. This version contains 5 different moving average types including T3. A list of tuples can be found here if you'd like to name the order of the moving average by depth: Tuples extrapolated
You'll notice that this is a lot of code and could normally be packed into a single loop in order to extract the N-tuple MA, however due to Pine Script limitations and processing paradigm this is not possible ... yet.
If you choose the EMA option and select a depth of 2, this is the classic DEMA; EMA with a depth of 3 is the classic TEMA, and so on and so forth this is to help you understand how this indicator works. This version of NTMA is restricted to a maximum depth of 30 or less. Normally this indicator would include 50 depths but I've cut this down to 30 to reduce indicator load time. In the future, I'll create an updated NTMA that allows for more depth levels.
This is considered one of the top ten indicators in forex. You can read more about it here: forex-station.com
How this works
Step 1: Run factorial calculation on the depth value,
Step 2: Calculate weights of nested moving averages
factorial(nemadepth) / (factorial(nemadepth - k) * factorial(k); where nemadepth is the depth and k is the weight position
Examples of coefficient outputs:
6 Depth: 6 15 20 15 6
7 Depth: 7 21 35 35 21 7
8 Depth: 8 28 56 70 56 28 8
9 Depth: 9 36 34 84 126 126 84 36 9
10 Depth: 10 45 120 210 252 210 120 45 10
11 Depth: 11 55 165 330 462 462 330 165 55 11
12 Depth: 12 66 220 495 792 924 792 495 220 66 12
13 Depth: 13 78 286 715 1287 1716 1716 1287 715 286 78 13
Step 3: Apply coefficient to each moving average
For QEMA, which is 5 depth EMA, the caculation is as follows
ema1 = ta.ema(src, length)
ema2 = ta.ema(ema1, length)
ema3 = ta.ema(ema2, length)
ema4 = ta.ema(ema3, length)
ema5 = ta.ema(ema4, length)
qema = 5 * ema1 - 10 * ema2 + 10 * ema3 - 5 * ema4 + ema5
Included:
Alerts
Loxx's Expanded Source Types
Bar coloring

Tripple EMA Strategy - Dhan HQDear Traders,
Here with presenting the new Indicator (Strategy) which is primarily built based on the the EMA moving Average and Candlestick Pattern.
Idea behind this Indicator: I am sure every trader would have traded using Moving average one day or the other. And Moving average is theoretically they are Lagging and the EMA are used in place of Moving average just to avoid a bit of Lag to take advantage of those accuracy while avoiding the Lag. In order to be successful in trading Money Management and Risk Management is very much crucial and should be part of every trade we place.
What this indicator is providing:
Based on the EMA and candlestick patterns and using the inputs provided for RISK and Money Management options, Indicator continuously scans for trading opportunities and provides alerts for possible trades. I have tried to capture some analytical inputs for one to think and take control over the Reward, Risk and Money management parameters to tweak the indicator accordingly.
Below are the Analytical outputs provided:
1. Total Trades taken (History till present) and its profitability % & appx PNL
2. Current Dates & Yesterday's Trades along with its appx PNL
3. Long Trades performance vs Short Trades performance
4. Retrieve PNL values post specified Date in the Input settings.
5. Last 7 Days PNL
6. Month's PNL
Note: There is known BUG in the calculation where the first date of the month for Monthly PNL value is a trading Holiday then Monthly PNL is being displayed as 0. similarly this Bug is flowed for Last 7 Days PNL. This will be addressed in upcoming version along with planned release.
Alerts & Notifications:
There are basically 2 types of Alerts provided one with General Notification and Other with Dhan HQ notifications to support Algo Trades for Dhan HQ Baskets.
Overview for Dhan HQ Trade Alerts:
1. When the Day Beginning (At Session Start) Hedge Position can be placed and shall be squared off post Closing the session
2. During the course of the Day Buy & Sell Baskets shall be executed
3. Can map the Trade Level SL values
4. Can map Daily Limit for SL to avoid excessive Loss. Upon Loss you could stop trades for the complete day or you may restart the trade post completion of X no of hours.
Enjoy!
DISCLAIMER: No sharing, copying, reselling, modifying, or any other forms of use are authorized for our documents, script / strategy, and the information published with them. This informational planning script / strategy is strictly for individual use and educational purposes only. This is not financial or investment advice. Investments are always made at your own risk and are based on your personal judgement. I am not responsible for any losses you may incur. Please invest wisely.
Happy to receive suggestions and feedback in order to improve the performance of the indicator better.
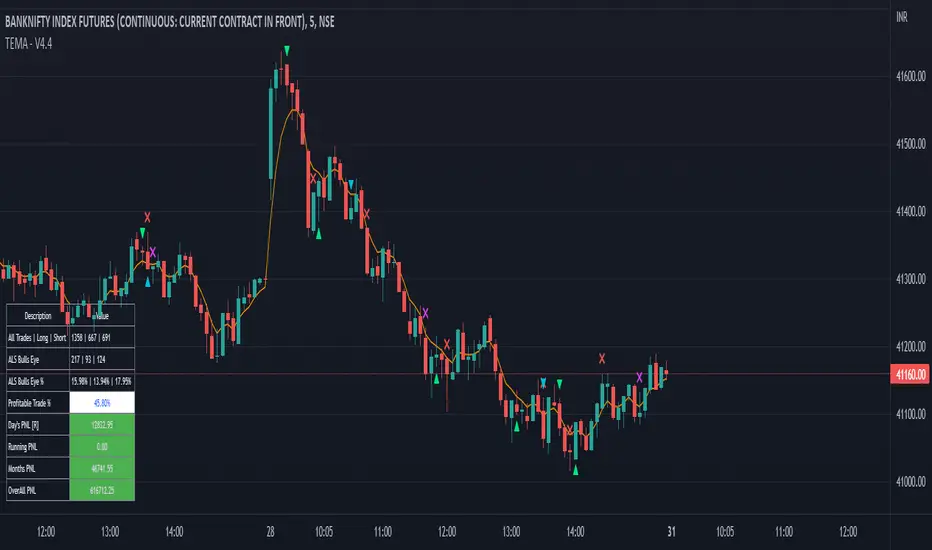
CDC ActionZone BF for ETHUSD-1D © PRoSkYNeT-EE
Based on improvements from "Kitti-Playbook Action Zone V.4.2.0.3 for Stock Market"
Based on improvements from "CDC Action Zone V3 2020 by piriya33"
Based on Triple MACD crossover between 9/15, 21/28, 15/28 for filter error signal (noise) from CDC ActionZone V3
MACDs generated from the execution of millions of times in the "Brute Force Algorithm" to backtest data from the past 5 years. ( 2017-08-21 to 2022-08-01 )
Released 2022-08-01
***** The indicator is used in the ETHUSD 1 Day period ONLY *****
Recommended Stop Loss : -4 % (execute stop Loss after candlestick has been closed)
Backtest Result ( Start $100 )
Winrate 63 % (Win:12, Loss:7, Total:19)
Live Days 1,806 days
B : Buy
S : Sell
SL : Stop Loss
2022-07-19 07 - 1,542 : B 6.971 ETH
2022-04-13 07 - 3,118 : S 8.98 % $10,750 12,7,19 63 %
2022-03-20 07 - 2,861 : B 3.448 ETH
2021-12-03 07 - 4,216 : SL -8.94 % $9,864 11,7,18 61 %
2021-11-30 07 - 4,630 : B 2.340 ETH
2021-11-18 07 - 3,997 : S 13.71 % $10,832 11,6,17 65 %
2021-10-05 07 - 3,515 : B 2.710 ETH
2021-09-20 07 - 2,977 : S 29.38 % $9,526 10,6,16 63 %
2021-07-28 07 - 2,301 : B 3.200 ETH
2021-05-20 07 - 2,769 : S 50.49 % $7,363 9,6,15 60 %
2021-03-30 07 - 1,840 : B 2.659 ETH
2021-03-22 07 - 1,681 : SL -8.29 % $4,893 8,6,14 57 %
2021-03-08 07 - 1,833 : B 2.911 ETH
2021-02-26 07 - 1,445 : S 279.27 % $5,335 8,5,13 62 %
2020-10-13 07 - 381 : B 3.692 ETH
2020-09-05 07 - 335 : S 38.43 % $1,407 7,5,12 58 %
2020-07-06 07 - 242 : B 4.199 ETH
2020-06-27 07 - 221 : S 28.49 % $1,016 6,5,11 55 %
2020-04-16 07 - 172 : B 4.598 ETH
2020-02-29 07 - 217 : S 47.62 % $791 5,5,10 50 %
2020-01-12 07 - 147 : B 3.644 ETH
2019-11-18 07 - 178 : S -2.73 % $536 4,5,9 44 %
2019-11-01 07 - 183 : B 3.010 ETH
2019-09-23 07 - 201 : SL -4.29 % $551 4,4,8 50 %
2019-09-18 07 - 210 : B 2.740 ETH
2019-07-12 07 - 275 : S 63.69 % $575 4,3,7 57 %
2019-05-03 07 - 168 : B 2.093 ETH
2019-04-28 07 - 158 : S 29.51 % $352 3,3,6 50 %
2019-02-15 07 - 122 : B 2.225 ETH
2019-01-10 07 - 125 : SL -6.02 % $271 2,3,5 40 %
2018-12-29 07 - 133 : B 2.172 ETH
2018-05-22 07 - 641 : S 5.95 % $289 2,2,4 50 %
2018-04-21 07 - 605 : B 0.451 ETH
2018-02-02 07 - 922 : S 197.42 % $273 1,2,3 33 %
2017-11-11 07 - 310 : B 0.296 ETH
2017-10-09 07 - 297 : SL -4.50 % $92 0,2,2 0 %
2017-10-07 07 - 311 : B 0.309 ETH
2017-08-22 07 - 310 : SL -4.02 % $96 0,1,1 0 %
2017-08-21 07 - 323 : B 0.310 ETH

Dragon Multi Moving Averages With labelThis script is for a many?! moving average strategy where the user can select from different types of moving averages, price sources, lookback periods and resolutions.
Features:
- 6 Moving Averages with variable MA types, periods, price sources, resolutions and the ability to disable each individually. Tow of moving averages are disable by default. you can enabel it
- Crossovers are plotted on the chart with detailed information regarding the crossover (Ex: 50 EMA crossed over 100 EMA ). there is only between 1-2, 2-3, 3-4, 4-5, 5-6 moving average cross label.
- Ribbons added and on by default. Optional setting to disable the ribbons. 5 ribbons between MA3 and MA4 and another 5 between MA4 and MA5 and another 5 between MA5 and MA6.

3 timeframe EMAThis is a 3 EMA in chart with 3 different time frame. For example you can see 1H timeframe EMA when you are in 15m chart
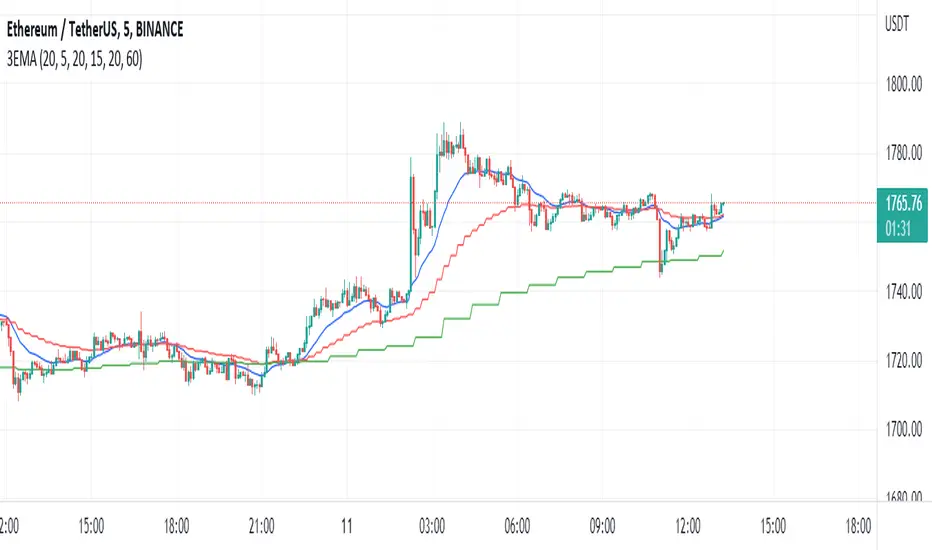
4 Moving Average-By AtropineA moving average is a statistic that captures the average change in a data series over time.
The moving average can be used to identify buying and selling opportunities with its own merit . When the stock price trades above its average price, it means the traders are willing to buy the stock at a price higher than its average price. This means the traders are optimistic about the stock price going higher. Therefore one should look at buying opportunities.
Likewise, when the stock price trades below its average price, it means the traders are willing to sell the stock at a price lesser than its average price. This means the traders are pessimistic about the stock price movement. Therefore one should look at selling opportunities.
We can develop a simple trading system based on these conclusions.
This Indicator Indicates 4 Moving Average of Different Periods.

