AR Peti Kemas Candle Cross EMA8 EMA13 EMA21 EMA55 EMA90 EMA200This is implementation of Peti Kemas. Slighly modified for the selection of EMA period, but user can change the period.
The strategy is if the current candle close is below EMA90 and EMA200, the buy signal is generated when the close crosses up EMA13.
When the close above EMA90 and ENA200, then the buy signal is generated when the close crosses up EMA8
Triple Exponential Moving Average (TEMA)

investor_EMA Three-CrossI produced a strategy using short term ema intersections.
A short-term low capital buy signal creates a yellow background after the red background color. Here, profit should be taken by following the trend.
When the green background is formed, positions can be increased, the price will lead us to a safer market.
Exposures can be turned off in the formation of a red background.
The pink zigzag average always shows the Weekly ma9. Price should be followed above the MA9 weekly average which will allow us to see medium term positive price movements.
As a result, the background colors will present a more understandable graph in price movements up and down movements.
The above strategy will generate signals as long and short.
You can make the coloring you want from the settings section.

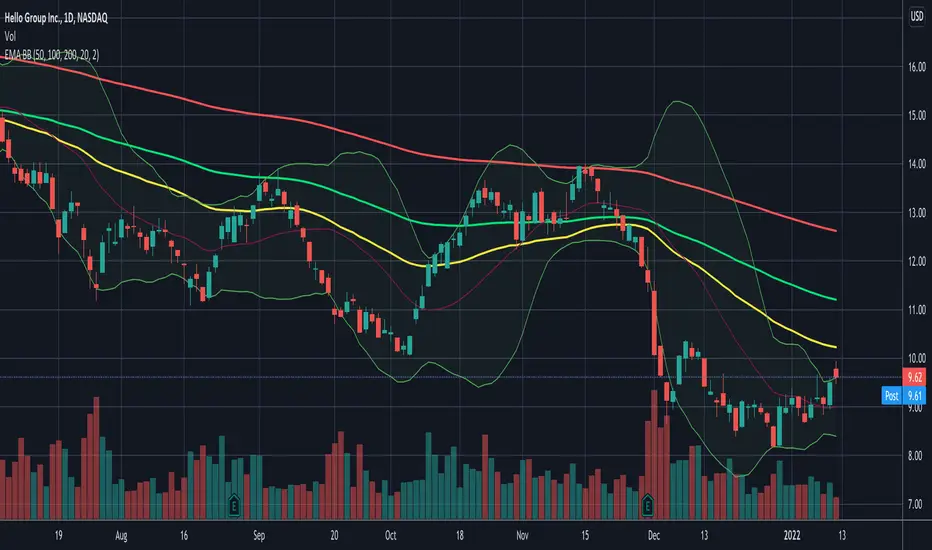
Daily EMA50 100 200 + BBStandard Bollinger Bands (timeframe dependent), period and standard deviation are configurable.
And standard daily triple EMA (timeframe independent). Short, Medium and Long periods are configurable (50/100/200 by default)
10X Moving Average Dingue V510X Moving Averages into 1 indicator - This is the updated V5 for PineScript 5
This moving average indicator lets you quickly visualize what is happening with the price.
Color-coded for easy visualization of all 10 MAs at the same time.
Fill in colors that let you see expansion and contraction between MAs and also if MAs are above or under each other plus if they are rising or falling.
10 Different Moving Averages give you full control over how you trade. You can have many long-term trends, mixed in with short-term MA. You can mix and match MA types to give a better idea of what other traders might see, important levels, etc… You can select from a wide range of MA Type: 'SMA', 'SMMA', 'EMA', 'DEMA', 'TEMA', 'WMA', 'VWMA', 'KAMA', 'FRAMA', 'TRIMA', 'ALMA', 'HMA', 'LSMA', 'ZLEMA', 'ViDYA', 'JMA', 'T3'
You can select different settings for EACH MA ie. Their type, length, line size, fill or not.
You can quickly ‘Override’ all MA's types by selecting an Override Type. That way you can quickly keep your settings and compare them with another type.
In the same way, you can turn ON/OFF all 10xMA at the same time with one button.
You can plot a moving average of all the 10x moving averages and plot just that one.
'Tool tips' explain much of the settings but if you have any questions, feel free to ask. Thank you for the feedback and check all my ‘Dingue’ indicators.

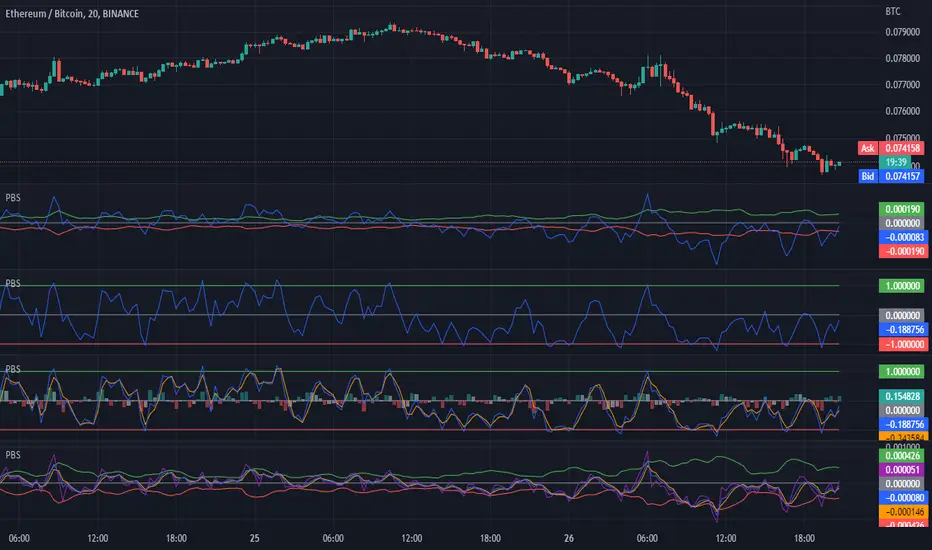
H/L Price Band with Signal Line (PBS)This indicator centers a moving average around the hl2 of the price. This is calculated as the difference of two moving averages. The upper band is a 9 period exponential moving average, the lower band is a 7 period moving average and the center line is the average between the two. The "Fast Line" is our signal line in this oscillator. When the price is hovering around the center of the band this indicates that a trend is pausing or reversing. When the fast line exits the band this could be a buy or sell signal. It could also indicate a very strong trend in that direction. To get the optimal entry and exit you might want to wait for the price to return to the center line. In addition to the basic functionality of this indicator I have added some bonus features. You can enable the "Slow Line" or the "Long Line" to enhance your signals. When the fast line is above the slow/long line you are in an up trend and inversely when the fast line is below the slow/long line you are in a down trend. The crossing of these lines can indicate a reversal. I have also included a "J" style amplification line. This works by enhancing the difference between the Fast and Slow/Long line to make it more visually apparent. You can also configure the "J" line to be calculated between either the slow or long line. Finally I have added the feature to amplify the band width by the standard deviation. This is set to 1 by default but you can also get a more responsive signal by setting this to 0.
This indicator works in most markets. There is a tool tip for every aspect of this indicator explaining how everything works. I hope you are very profitable with this one!
If you find this indicator is useful to you, Star it, Follow, Donate, Like and Share.
Your support is a highly motivation for me.
Keltner Channel With User Selectable Moving AvgKeltner Channel with user options to calculate the moving average basis and envelopes from a variety of different moving averages.
The user selects their choice of moving average, and the envelopes automatically adjust. The user may select a MA that reacts faster to volatility or slower/smoother.
Added additional options to color the envelopes or basis based on the current trend and alternate candle colors for envelope touches. The script has a rainbow gradient by default based on RSI.
Options (generally from slower/smoother to faster/more responsive to volatility):
SMMA,
SMA,
Donchian, (Note: Selecting Donchian will just convert this indicator to a regular Donchian Channel)
Tillson T3,
EMA,
VWMA,
WMA,
EHMA,
ALMA,
LSMA,
HMA,
TEMA
Value Added:
Allows Keltner Channel to be calculated from a variety of moving averages other than EMA/SMA, including ones that are well liked by traders such as Tillson T3, ALMA, Hull MA, and TEMA.
Glossary:
The Hull Moving Average ( HMA ), developed by Alan Hull, is an extremely fast and smooth moving average . In fact, the HMA almost eliminates lag altogether and manages to improve smoothing at the same time.
The Exponential Hull Moving Average is similar to the standard Hull MA, but with superior smoothing. The standard Hull Moving Average is derived from the weighted moving average ( WMA ). As other moving average built from weighted moving averages it has a tendency to exaggerate price movement.
Weighted Moving Average: A Weighted Moving Average ( WMA ) is similar to the simple moving average ( SMA ), except the WMA adds significance to more recent data points.
Arnaud Legoux Moving Average: ALMA removes small price fluctuations and enhances the trend by applying a moving average twice, once from left to right, and once from right to left. At the end of this process the phase shift (price lag) commonly associated with moving averages is significantly reduced. Zero-phase digital filtering reduces noise in the signal. Conventional filtering reduces noise in the signal, but adds a delay.
Least Squares: Based on sum of least squares method to find a straight line that best fits data for the selected period. The end point of the line is plotted and the process is repeated on each succeeding period.
Triple EMA (TEMA) : The triple exponential moving average (TEMA) was designed to smooth price fluctuations, thereby making it easier to identify trends without the lag associated with traditional moving averages (MA). It does this by taking multiple exponential moving averages (EMA) of the original EMA and subtracting out some of the lag.
Running (SMoothed) Moving Average: A Modified Moving Average (MMA) (otherwise known as the Running Moving Average (RMA), or SMoothed Moving Average (SMMA)) is an indicator that shows the average value of a security's price over a period of time. It works very similar to the Exponential Moving Average, they are equivalent but for different periods (e.g., the MMA value for a 14-day period will be the same as EMA-value for a 27-days period).
Volume-Weighted Moving Average: The Volume-weighted Moving Average (VWMA) emphasizes volume by weighing prices based on the amount of trading activity in a given period of time. Users can set the length, the source and an offset. Prices with heavy trading activity get more weight than prices with light trading activity.
Tillson T3: The Tillson moving average a.k.a. the Tillson T3 indicator is one of the smoothest moving averages and is both composite and adaptive.

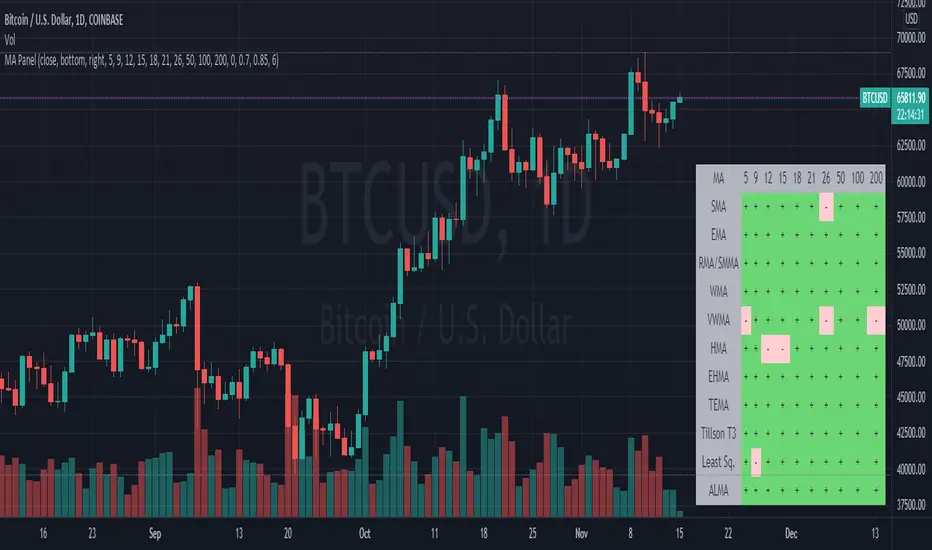
Moving Average PanelThis indicator calculates many different moving averages and displays whether they are increasing or decreasing as a panel/table instead of a plot. Rows/columns can be removed from the table as needed in the options menu, there is also a mobile friendly/compact option as well as a location option.
Note: This script is large and may take a few moments to load.
Note: If there is not enough data, will default to bearish/decreasing.
Value Added
This is the most complete and transparent moving average panel/table indicator. Unlike things such as the Technical Ratings, you can see what components are increasing or decreasing.
There may be some advantage in judging if a trend is likely to reverse or not based on the MA's with less lag.
Good for quick screening of charts.
MACD-EDT "EMA DEMA TEMA" [DM]Greetings to all colleagues
Today I share a MACD with the EMA , DEMA , TEMA variants.
The aim is that they can see how the signals vary from a normal MACD to one with the averages created by Patrick Mulloy (1994)
Variables of this MACD:
EMA = Exponential Moving Average
DEMA = Double Exponential Moving Average
TOPIC = Triple Exponential Moving Average
He also has in the arsenal:
SMA Simple Moving Average
WMA Weighted Moving Average
Plus...:
Volume-weighted variant in all of them
Visual options:
Points at the crossroads
Shadows on the body of the signals
All colors are customizable
Histogram and shadow are gradients at 15 steps
It has switches for:
Shadow
Histogram
Macd and signal
Crosses
Some minor details remain to be incorporated in the next few days.
Pre-cross calculation.
Alerts
Bar color
Enjoy!!! ;-)

MACD Alert [All MA in one] [Smart Crypto Trade (SCT)]This code is a gift from "Smart Crypto Trade (SCT)" group
MACD indicator contains 3 EMA, I think one of the best usage of MACD is trend detection and divergences.
In our indicator, you can select the type of Moving averages that used in macd.
You can using "MACD" based on several types of moving averages including:
Exponential Moving Average ( EMA )
Volume-Weighted Moving Average ( VWMA )
Simple Moving Average ( SMA )
Weighted Moving Average ( WMA )
Exponentially Weighted Moving Average (RMA) that used in RSI
Smoothed Moving Average ( SMMA )
Arnaud Legoux Moving Average ( ALMA )
Double EMA ( DEMA )
Double SMA (DSMA)
Double WMA (DWMA)
Double RMA (DRMA)
Triple EMA ( TEMA )
Triple SMA (TSMA)
Triple WMA (TWMA)
Triple RMA (TRMA)
Linear regression curve Moving Average ( LSMA )
Variable Index Dynamic Average ( VIDYA )
Fractal Adaptive Moving Average ( FRAMA )
In other words we tried to collect all the most popular MAs in our MACD indicator.
In addition, you can use four types of alert or alarm conditions for detection LONG or SHORT positions and trends. For this, you must set an alert in alert tab and set the condition based on four defaults conditions.
Enjoy

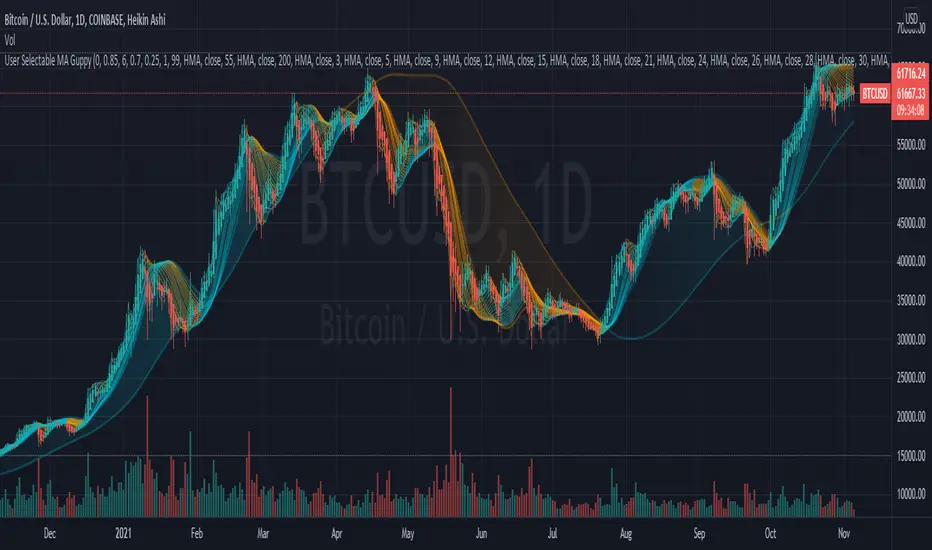
User Selectable Moving Average GuppyA version of the popular "Moving Average Ribbon" or "Guppy" indicators, except nearly everything about it is user selectable. The user can change the source, period, and type of moving average used for every single line on the chart. Note: The visuals are fairly intensive and may take a moment to catch up after adjusting settings.
Credit: This script utilizes the "Color Gradient Framework" tutorial by LucF (PineCoders) to create gradient visuals, which are also customizable for the user.
Moving Average Options:
Running (SMoothed) Moving Average (RMA or SMMA) - Slowest
Simple Moving Average (SMA) - Slow
Exponential Moving Average (EMA) - Responds faster to price than SMA
Weighted Moving Average (WMA)
Volume-Weighted Moving Average (VWMA)
Triple EMA (TEMA)
Exponential Hull Moving Average (EHMA) - Hull with Smoothing (Slower than Hull)
Least Squares Moving Average (LSMA) - Simple Linear Regression
Arnaud Legoux Moving Average (ALMA) - Adjustable, set offset=1 to be current, offset=0.85 for good smoothing (Slower)
Hull Moving Average (HMA) - Normally responds fastest to price of all options
Value Added :
This script is unique in that it allows the user to chart the "Guppy", except nearly everything about it is customizable. The user can change the source, period, and type of moving average used for every single line.
Typically, the Guppy is plotted with simple moving average or exponential moving average, which respond much slower to price than the Hull Moving Average, which this indicator uses as default. (Elimination of lag)
The Hull MA settings for the highest time frame moving averages should work well for assessing the overall macro trend, with a nice visual presentation. Additional labels and alerts for the macro trend are available.
Furthermore, this script provides many more options for type of moving average than is typical for a moving average indicator that provides the user with options, including advanced options such as Hull, TEMA, and ALMA.
The visual presentation is customizable and should provide some entertainment for users who want to create pretty charts.
Bollinger Bands With User Selectable MABollinger Bands with user selection options to calculate the moving average basis and bands from a variety of different moving averages.
The user selects their choice of moving average, and the bands automatically adjust. The user may select a MA that reacts faster to volatility or slower/smoother.
Added additional options to color the bands or basis based on the current trend and alternate candle colors for band touches. Options:
REACT SLOW/SMOOTH TO VOLATILITY
simple moving average (Regular Bollinger Bands)
REACT SMOOTH TO VOLATILITY
exponential moving average (EMA Bollinger Bands)
weighted moving average (Weighted MA Bollinger Bands)
exponential hull moving average (Hull Bollinger Bands with better smoothing)
HIGHLY ADJUSTABLE TO VOLATILITY
Arnaud Legoux Moving average (ALMA Bollinger Bands)
Note: 0.85 ALMA default for more smoothing, set offset=1 to turn off smoothing
REACT HARSH TO VOLATILITY
least squares moving average (Least Squares Bollinger Bands)
REACT VERY FAST TO VOLATILITY
hull moving average (Hull Bollinger Bands or Hullinger Bands)
VALUE ADDED: This script is unique in that no other Bollinger Bands indicator offers a user selection for moving average, and some of the options do not exist yet as Bollinger Bands indicators.
Definitions:
Bollinger Bands: A Bollinger Band® is a technical analysis tool defined by a set of trendlines plotted two standard deviations (positively and negatively) away from a simple moving average (SMA) of a security's price, but which can be adjusted to user preferences.
Exponential Bollinger Bands: The most important characteristics of the Exponential Bollinger Bands indicator are: When the market is flat, the bands will stay much closer to prices. When the volatility is high, the bands move away from prices faster.
Hull Bollinger Bands: Bollinger Bands calculated by Hull moving average, rather than simple moving average or ema. The Hull Moving Average (HMA), developed by Alan Hull, is an extremely fast and smooth moving average. In fact, the HMA almost eliminates lag altogether and manages to improve smoothing at the same time.
Exponential Hull Bollinger Bands: Bollinger Bands calculated by Exponential Hull moving average, rather than simple moving average or ema. The Exponential Hull Moving Average is similar to the standard Hull MA, but with superior smoothing. The standard Hull Moving Average is derived from the weighted moving average (WMA). As other moving average built from weighted moving averages it has a tendency to exaggerate price movement.
Weighted Moving Average Bollinger Bands: A Weighted Moving Average (WMA) is similar to the simple moving average (SMA), except the WMA adds significance to more recent data points.
Arnaud Legoux Moving Average Bollinger Bands: ALMA removes small price fluctuations and enhances the trend by applying a moving average twice, once from left to right, and once from right to left. At the end of this process the phase shift (price lag) commonly associated with moving averages is significantly reduced. Zero-phase digital filtering reduces noise in the signal. Conventional filtering reduces noise in the signal, but adds a delay.
Least Squares Bollinger Bands: The indicator is based on sum of least squares method to find a straight line that best fits data for the selected period. The end point of the line is plotted and the process is repeated on each succeeding period.

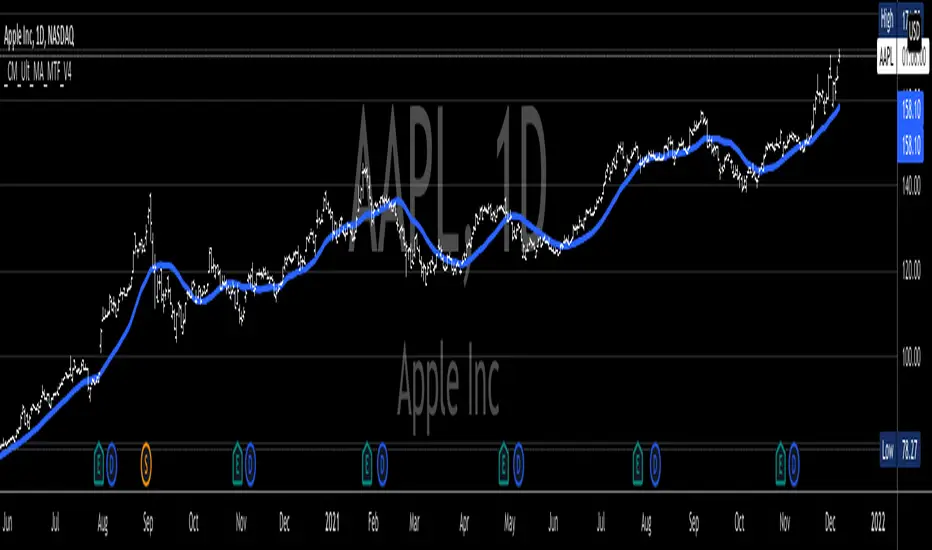
_CM_Ultimate_MA_MTF_V4***For a Detailed Video Overview Showing all of the Settings...
Click HERE to View Video
New _CM_Ultimate_MA_MTF_V4 - Update - 08-24-2021
Thanks to @SKTennis for help with code
Added Ability to Plot 1 or 2 Moving Averages - Fast MA & Slow MA
Added Ability to Plot Fast MA with Multi TimeFrame
Added Ability to Plot Slow MA with Multi TimeFrame
Added Ability to Color Fast MA Based on Slope of MA
Added Ability to Color Fast MA based on being Above/Below Slow MA
Added Ability to Plot 8 Types of Moving Averages
Simple, Exponential, Weighted, Hull, VWMA, RMA, TEMA, & Tilson T3
Added Ability to Set Alerts Based on:
Slope Change in the Fast MA Or Fast MA Crossing Above/Below Slow MA.
Added Ability to Plot "Fill" if Both Moving Averages are Turned ON
Added Ability to control Transparency of Fill
Added Alerts to Settings Pane.
Customized how Alerts work. Must keep Checked in Settings Pane, and When you go to Alerts Panel, Change Symbol to Indicator (_CM_Ultimate_MA_MTF_V4)
Customized Alerts to Show Symbol, TimeFrame, Closing Price, & Moving Average Signal Name in Alert
Alerts are Pre-Set to only Alert on Bar Close
See Video for Detailed Overview
New Updates Coming Soon!!!
***Please Post Feedback and Any Feature Requests in the Comments Section Below***
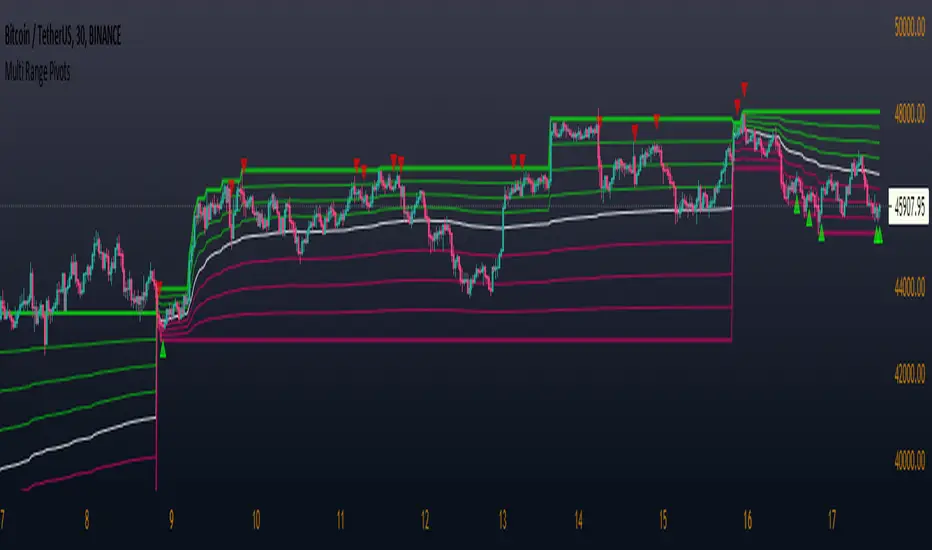
Multi Range Pivots
Multi Range Pivots works by recognizing the high and low of the timeframe selected and plotting range high to MEAN averages and range low to MEAN averages.
This is essentially the VWAP pivots updated to include not only VWAP as a MEAN, but also SMA, EMA, VWMA, DEMA, TEMA, TRIMA, KAMA, MAMA, T3, H/L basis and Donchian basis.
Also, with high and low no longer repainting, I was able to add true reliable signals.
Enjoy
TFi Simple Moving Average Bot V1 - PUBLICThe bot is using 2 moving averages for detecting the trend; the type of moving average is configurable; if the 2 moving averages are crossing it enters a long or short position. A stop-loss and profit-target can be configured; if reaching the profit-target, the bot is closing 50% (configurable) of the position, from this time on it is using a trailing-stop to close the position if the trailing-stop has been crossed.
The following moving-averages can be configured:
DEMA
EMA
HMA
RMA
SMA
TEMA
VWMA
WMA
Overview of features:
Optional stop-loss and profit-target/trailing-stop
Built-in backtesting engine with start balance, position size and pyramiding; each year will be evaluated separately
Inputs for a percentage entry and exit slippage, entry/exit and daily funding fees
Configurable alerts, which follow the exact position of the entry/exit marker
Alert messages contain predefined trading instruction to execute orders via TradeFab's proprietary trading server, which supports Alpaca-Markets, TD Ameritrade, Oanda, CCXT API's, or can be defined by the user
The script renders a performance/status table, which shows the current position status and result of the built-in trading simulation results. The following statistics are shown:
Current position PnL - also background turns green if position is in profit and red if in loss
Average entry price and number of positions
Current percentage distance to the optional stop-loss level
Current Maximum Draw Down
Number of wins and losses and the win/loss ratio per year and overall
Profit and loss amount, paid fees per year and overall
Profit-ratio and Maximum Draw Down per year and overall
Balance and ROI per year and overall

PSAR + EMA + TEMACombined PSAR with EMA and/or TEMA lines, including fast/slow plots, for entry/exit signals. Includes signals for all plots.
Credit to TEMA With Alert by BerkSay and Parabolic SAR by Alex Orekhov (everget).

VWMA / SMA / TEMA DifferenceThis Study try to simulate Weakening and Strengthening trends on Bear(down) or Bull(up) movements.
It looks to VWMA - TEMA trend for Bull / Bear trend and looking for SMA - VWMA trend for Weak / Strong trends.
On default settings Line shows the difference between VWMA - TEMA and Columns show difference between SMA - VWMA. Suggesting to use this script for 5m intervals.
This is a personal work of mine. Using this script and taking decisions regarding to this script is only and only under responsibility of the trader!!!

BTC Health (OHLC and TEMA)The "health" (ie, price trend) of Bitcoin has a major influence on the whole cryptocurrency market. Therefore, it can be useful to check the price and trend of BTC prior to entering a new position. This indicator displays BTC candles plus a fast & slow TEMA below the primary chart, so you can check how BTC is behaving.
BTC quote is from BINANCE, using the timeframe of the main chart. TEMA periods can be customized.

Triple EMA Cross with Pivot PointsYou can change various options from the settings, a few things to bear in mind:
Always make sure the EMA timeframe is larger than the chart timeframe for it to be usable.
The timeframe for Pivot Points is still playing up so I'll be looking into that soon!
This indicator doesn't always work, use it in conjunction with other indicators to manage your risk
Trading Strategy
TEMA 2 & 16 Cross
Long Entry
TEMA cross & Higher Low
Close Long
TEMA cross
Short Entry
TEMA cross and Lower High
Close Short
TEMA cross

Triple Exponential MACDA modification of the classic MACD to use Triple EMAs which tends to have less lag than the standard indicator. (I also have a Double Exp MACD indicator, I tend to use both simultaneously)
Alert conditions are pre-configured for simple line crosses and you can enable/disable the histogram from the indicator options menu.
Enjoy!

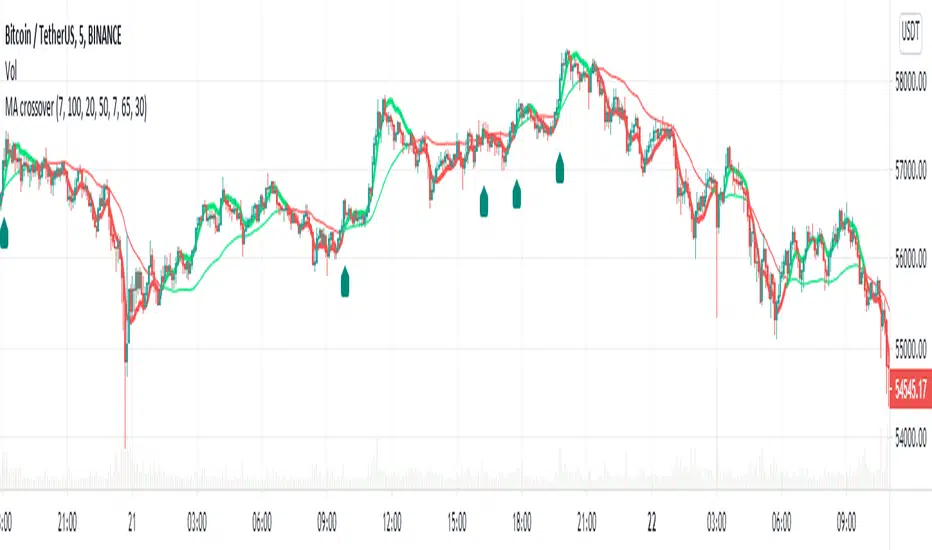
MA Crossover Alerts for Small Quick Profits on 3commas/DCA botDear fellow 3commas users,
This is a the most basic Moving Average crossover technique generating Buy Alerts.
This is especially written for those of you who want to link this basic crossover strategy with your 3commas DCA bot .
Buy Alerts
Moving averages available:
- Simple Moving Average (SMA)
- Exponential Moving Average (EMA)
- Weighted Moving Average (WMA)
- Hull Moving Average (HullMA)
- Volume Weighted Moving Average (VMWA)
- Running Moving Average (RMA)
- Triple Exponential Moving Average (TEMA)
Recommended settings for using with 3commas DCA bot:
Interval:
3m to 15m
3commas bot setup:
- TP/TTP: 0.3%/0.1%,
- Base Order: Your choice ,
- Safety Order: 1.2 * Base order
- Safety Order Volume Scale: 1.2,
- Safety Order Step Scale: 1.5,
- Max Active Deals: Your choice ,
- Price Deviation to Open Safety Order (% from initial order): 0.2%,
- Max Safety Trades Count: 7,
- Simulatenous Deals per Same Pair: 3
> Create Alert with Buy Alert and link it to your bot "Message for deal start signal"
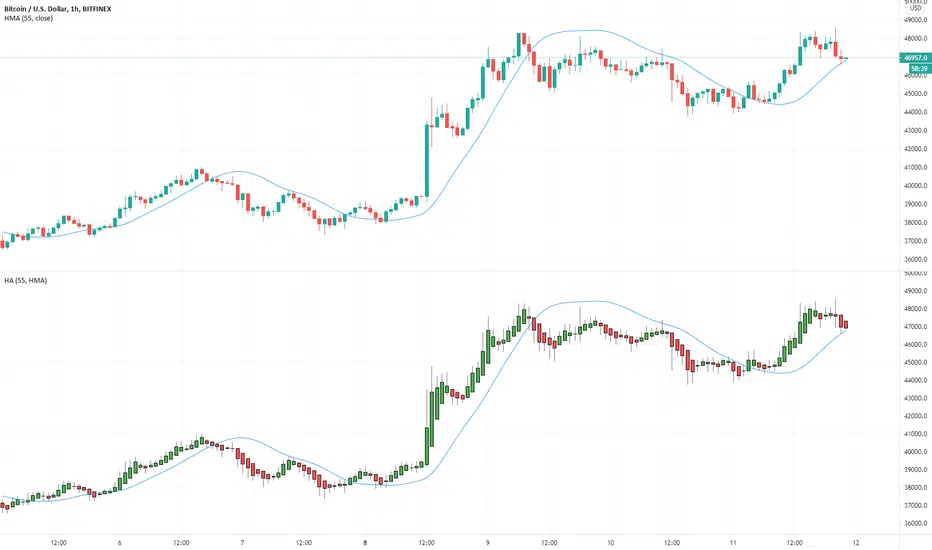
Multiple Moving Averages for Heikin Ashi I want to give credits to @QuantNomad, i got the heikin ashi part of the script from this open script /0iKy7lyG-QuantNomad-Heikin-Ashi-PSAR-Strategy/;
and to the other guy that provided a 17 type of moving average script open source but i forgot his name, if someone remember please tell me.
My idea was to see how the different types of moving averages behaves in a Heinkin Ashi chart, you can change to more than 15 types of Moving Average and use it the way you want it.
For the source of the moving averages i used a simple moving average of 1 period using the high of the heikin ashi candle, low of it and divided by 2 as the source of the different types of moving averages.
Different types of Moving Averages
Moving Average Types
SMA ---> Simple
WMA ---> Weighted
VWMA ---> Volume Weighted
EMA ---> Exponential
DEMA ---> Double EMA
ALMA ---> Arnaud Legoux
HMA ---> Hull MA
SMMA ---> Smoothed
LSMA ---> Least Squares
KAMA ---> Kaufman Adaptive
TEMA ---> Triple EMA
ZLEMA ---> Zero Lag
FRAMA ---> Fractal Adaptive
VIDYA ---> Variable Index Dynamic Average
JMA ---> Jurik Moving Average
T3 ---> Tillson
TRIMA ---> Triangular
The type of moving average you select will appear in a separated chart with Heikin Ashi candles, like in the image above.
[THETA] Tema Hema Evwma Trade ActionTHETA
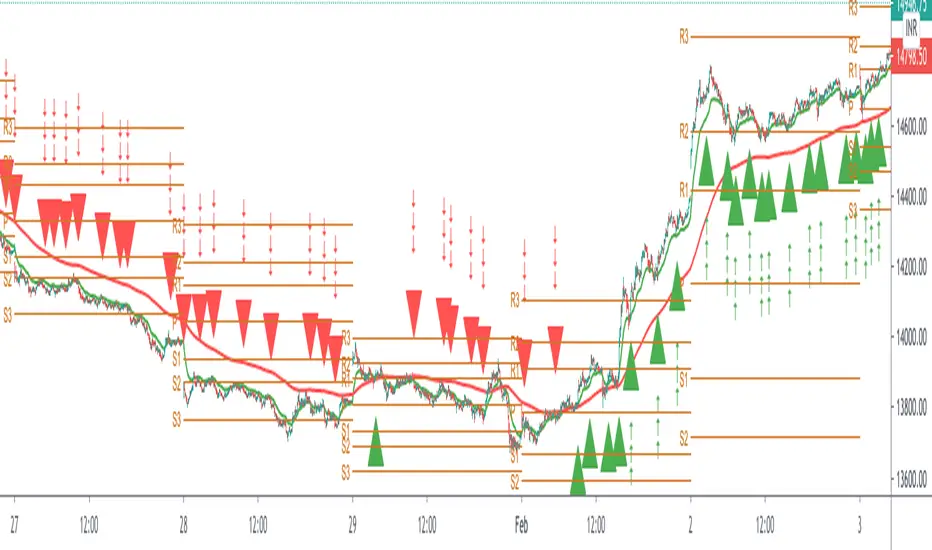
Is an Intraday Strategy Indicator, To be used over 1 minute chart and in conjunction with built in pine indicator Pivot Point Standard, {Fibonacci One}
I came across this Strategy Indicator while reading through the Forex Trading Journals, and thought of sharing you guys
The Indicator Comprises of amalgamation of
TEMA : Triple Exponential Moving Average
HMA : Hulls Moving Average
EVWMA and EMA: Elastic Volume weighted Moving Average and Exponential Moving Average
Filter Action by Rajandran R Supertrend
So
Theta = ( tema(src, length) + hma(src, length) + ema(src, length) + evwma(src, length) )/4
The lengths in use are: 8,21,34,55,89,144,233,610
How to Use
Use on 1 min chart for best results
UsE in Conjuction with Fibonacci Pivot Points, (.which is present in option of built in pine indicator : Pivot Point Standard )
Provision For Alert
Long theta Signal
Short theta Signal
Custom Moving Average (EMA & SMA)This script is a custom visualization tool to plot 4 Moving Averages (MA).
Each MA is customizable; you can:
enable (disable) the plot of MA;
select whether the MA is an EMA or an SMA;
the length;
the source (open, close, ...);
the offset value (default is 0).
Note:
The 1st MA is an EMA with length 50.
The others MAs are SMA with length 9, 30 and 100 respectively.
