Previous Highs + Lows by HAZED📈 Introducing: Previous Highs + Lows by H A Z E D 📉
✨ Overview
Get a clear view of market levels with Previous Highs + Lows v1.0! This indicator lets you track critical previous highs and lows across multiple timeframes, marking them directly on your chart for an intuitive view of support and resistance zones. Whether you’re analyzing breakouts or looking for reversal levels, these indicators provide essential context to refine your trades.
🛠️ Key Features
Multiple Timeframes Supported
Toggle on previous highs and lows for daily, weekly, monthly, 4-hour, and 1-hour charts to match your analysis style.
Customizable Labels
Choose label sizes from “tiny” to “huge,” adjust the opacity to blend seamlessly with your chart, and customize text color for optimal readability.
Label Position Control
Avoid overlap with a flexible label offset feature, allowing for 10 adjustable increments to fit your preference and chart layout.
Clear Visual Cues
Labels use icons to differentiate high (⬆️) and low (⬇️) levels at a glance, providing a straightforward way to interpret key price areas.
Instant Alerts for Key Levels
Receive alerts when the price crosses over previous high levels, keeping you informed about potential breakout zones without constant chart-watching.
🚀 How to Use
Identify Key Levels: Quickly locate significant highs and lows from previous periods to define your support and resistance zones.
Set Alerts: Stay updated on market moves with built-in alerts when prices cross these critical levels.
Customize Your View: Use the various options to make this indicator uniquely yours – adjust label size, color, opacity, and position.
🔔 Why Use Previous Highs + Lows v1.0?
Enhanced visibility of critical levels saves you time by giving you a structured view of price action.
Customization features let you adapt the indicator to your personal style and chart setup.
Flexible alerts mean you can focus on other tasks without missing important price movements.
🔗 License: Mozilla Public License 2.0
© H A Z E D, 11/4/2024
Thestrat

The Strat with TFC & Combo DashIntroduction:
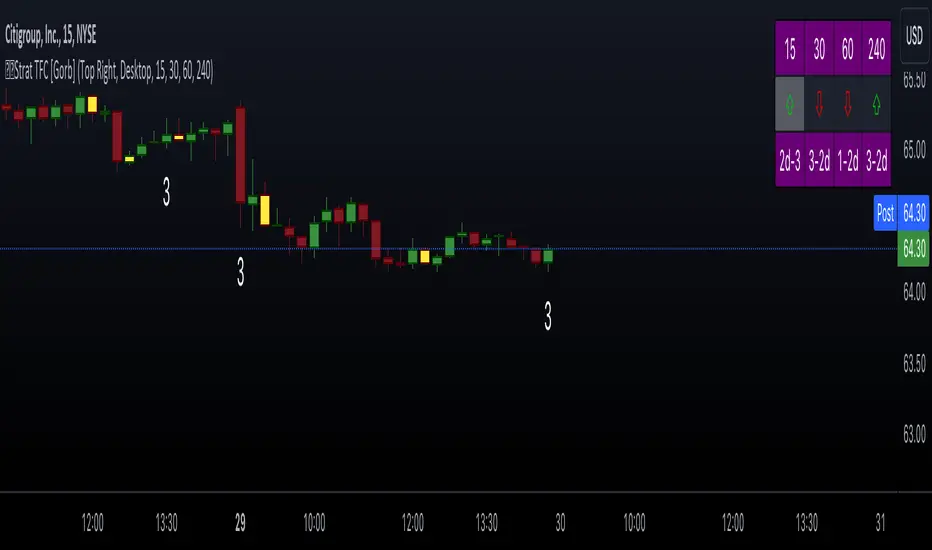
This indicator is designed to implement "The Strat" trading strategy combined with a Timeframe Continuity Dashboard and Combo Dashboard. The Strat is a robust trading methodology that relies on price action and candlestick formations to make trading decisions. This script helps traders to identify specific bar types such as Inside Bars (1), Continuation Up Bars (2u), Continuation Down Bars (2d), and Outside Bars (3) across multiple timeframes. It visually highlights these bar types on the chart and provides a comprehensive dashboard displaying the current state of the selected timeframes.
Key Features:
Timeframe Continuity Dashboard: Displays arrows and bar types for up to four selected timeframes.
Strat Combos Dashboard: Shows the previous and current bar types to easily spot trading setups.
Customizable Colors and Labels: Options to personalize the colors and labels for Inside and Outside bars.
Adjustable Dashboard Position and Size: Allows users to set the location and size of the dashboard for better visual alignment.
Inputs:
TFC & Combo Dash Configuration:
Show TFC & Combo Dashboard: Toggle to display the dashboard.
Show Strat Combos: Toggle to display Strat combo setups.
Location: Dropdown to select the position of the dashboard on the chart.
Size: Dropdown to choose between desktop and mobile view.
Timeframe Selection:
Timeframe 1: Primary timeframe for analysis.
Timeframe 2: Secondary timeframe for analysis.
Timeframe 3: Tertiary timeframe for analysis.
Timeframe 4: Quaternary timeframe for analysis.
Candle Visuals:
Show Inside Bar Label: Option to show label instead of color for Inside bars.
Inside Bar Color: Color picker for Inside bars.
Show Outside Bar Label: Option to show label instead of color for Outside bars.
Outside Bar Color: Color picker for Outside bars.
TFC & Combo DashboardFunctions:
The script fetches values for the selected timeframes and computes the bar types and corresponding visual elements such as arrows and background colors. The dashboard displays this information in a tabular format for easy reference during trading.
The dashboard is dynamically created based on user input for position and size. It shows the selected timeframes, bar types, and combo setups, providing a quick overview of the market conditions across multiple timeframes.
Timeframes: Displays the four user chosen timeframes that the dashboard fetches data from.
Arrow and Color: Functions to set the arrow direction and color based on current bar action. Green and up arrow: price is above it's candle open.
Red and down arrow: price is below it's candles open.
Background Color: Functions to set background color based on the bar type. White for an outside bar(3), yellow for an inside bar(1), no color for a continuation bar(2).
Strat Candle Combos: Functions to determine if the bar is an Inside(1), Continuation Up(2u), Continuation Down(2d), or Outside bar(3). Shows the previous bar and the current bar for the user's chosen timeframes.
Candle Visuals:
The script plots labels and colors for Inside and Outside bars based on user preferences. It helps in quickly identifying potential trading setups on the chart.
Conclusion:
We believe in providing user-friendly tools to help speed up traders technical analysis and implement easy trading strategies. The Strat with TFC & Combo Dashboard is a tool to assist traders in identifying potential trading setups based on The Strat methodology; to suit the users needs and trading style.
RISK DISCLAIMER
All content, tools, scripts & education provided by Gorb Algo LLC are for informational & educational purposes only. Trading is risk and most lose their money, past performance does not guarantee future results.
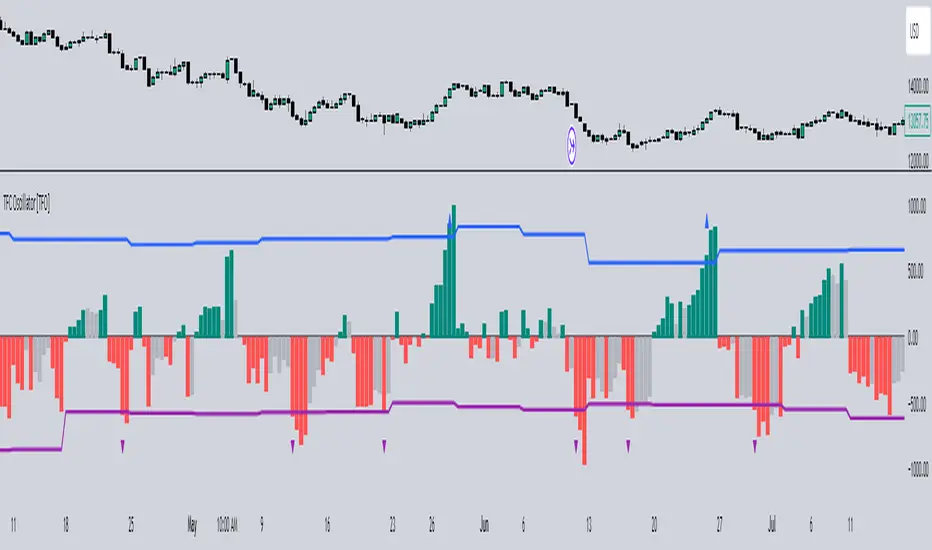
Timeframe Continuity Oscillator [TFO]This indicator is used to visualize timeframe continuity - a core concept of "The Strat" - along with some added logic for potential range limiters.
When discussing timeframe continuity, typically we are evaluating several timeframes to see if price is trading above or below the current open of each respective timeframe. If we are concerned with the 15m, 4h, and 1D for example, and price is trading above the current open of each of those timeframes, we can say that we have full timeframe continuity (FTFC) up. Conversely, if price is trading below the current open of each of those timeframes, we can say that we have FTFC down.
We can visualize this with an oscillator of sorts, where the zero line is anchored to the open price of the highest timeframe that we're concerned with. Using the prior example, this would be the 1D timeframe. As long as price is above the current 1D open, it is impossible to have FTFC down; and as long as price is below the current 1D open, it is impossible to have FTFC up. This is why we base the oscillator's values off of the highest timeframe's open (the values are simply how far price has traded from this open) - any value greater than zero tells us that there is potential to have FTFC up, and any value less than zero tells us that there is potential to have FTFC down.
There are a few ways we chose to visualize this data. First, we can choose the "Binary" option which simply uses one solid bullish color above the zero line, and one solid bearish color below the zero line.
Second, we can choose the "Gradient" option to help describe whether we have FTFC up or down. Values above the zero line will be a mix of the bullish color and mid color, where the mid color indicates no timeframe continuity up and the bullish color indicates FTFC up - sort of like a color spectrum of timeframe continuity to describe how many timeframes are in agreement. Similarly, values below the zero line will be a mix of the bearish color and the mid color, where the mid color again indicates no timeframe continuity down and the bearish color indicates FTFC down.
Lastly, we can choose the "FTFC Only" option which will only color the histogram bars as bullish if there is FTFC up, or bearish if there is FTFC down.
One more feature that we added is these upper and lower bands that aim to help describe the potential upper and lower limits that price may travel, relative to the highest timeframe's open. This is done by taking the standard deviation of some defined lookback period, for example, 2 standard deviations of the previous 10 weeks, assuming 1W is the highest timeframe enabled.
The concept is similar to that of an ADR (average daily range) as it can be used to estimate maximum range extensions for the largest timeframe. The arrows you see are plotted once the value exceeds either band - alerts can be enabled for these events as well through any alert() function call.
The Strat with Continuity [starlord_xrp]This indicator shows entry and exit points for The Strat as well as potential setups. It also has full time frame continuity detection.

The Strat [LuxAlgo]The Strat indicator is a full toolkit regarding most of the concepts within "The Strat" methodology with features such as candle numbering, pivot machine gun (PMG) highlighting, custom combo highlighting, and various statistics included.
Alerts are also included for the detection of specific candle numbers, custom combos, and PMGs.
🔶 SETTINGS
Show Numbers on Chart: Shows candle numbering on the chart.
Style Candles: Style candles based on the detected number. Only effective on non-line charts and if the script is brought to the front.
🔹 Custom Combo Search
Combo: User defined combo to be searched by the script. Combos can be composed of any series of numbers including (1, 2, -2, 3), e.g : 2-21. No spaces or other characters should be used.
🔹 Pivot Machine Gun
Show Labels: Highlight detected PMGs with a label.
Min Sequence Length: Minimum sequence length of consecutive higher lows/lower highs required to detect a PMG.
Min Breaks: Minimum amount of broken previous highs/lows required to detect a PMG.
Show Levels: Show levels of the broken highs/lows.
🔹 Pivot Combos
Pivot Lookback: Lookback period used for detecting pivot points.
Right Bars Scan: Number of bars scanned to the right side of a detected pivot.
Left Bars Scan: Number of bars scanned to the left side of a detected pivot.
🔹 Dashboard
Show Dashboard: Displays statistics dashboard on chart.
Numbers Counter: Displays the numbers counter section on the dashboard.
Pivot Combos: Displays pivots combo section on the dashboard.
%: Display the percentage of detected pivot combos on the dashboard instead of absolute numbers.
Pivot Combos Rows: Number of rows displayed by the "Pivots Combo" dashboard section.
Show MTF: Showa MTF candle numbering on the dashboard.
Location: Location of the dashboard on the chart.
Size: Size of the displayed dashboard.
🔶 USAGE
This script allows users with an understanding of The Strat to quickly highlight elements such as candle numbers, pivot machine guns, and custom combos. The usage for these concepts is given in the sub-sections below.
🔹 Candle Numbers
The Strat assigns a number to individual candles, this number is determined by the current candle position relative to the precedent candle, these include:
Number 1 - Inside bar, occurs when the previous candle range engulfs the current one.
Number 2 Up - Upside Directional Bar, occurs when the current price high breaks the previous high while the current low is lower than the previous high.
Number 2 Down - Downside Directional Bar, occurs when the current price low breaks the previous low while the current high is higher than the previous low.
Number 3 - Outside bar, occurs when the current candle range engulfs the previous one.
The script can highlight the number of a candle by using labels but can also style candles by depending on the candle number. Inside bars (1) only have their candle wick highlighted, directional bars (2) (-2) only have their candle body highlighted. Outside bars have their candle range highlighted.
Note that downside directional bars are highlighted with the number -2.
Users can see the total amount of times a specific candle number is detected on the historical data on the dashboard available within the settings, as well as the number of times a candle number is detected relative to the total amount of detected candle numbers expressed as a percentage.
It is also possible to see the current candle numbers returned by multiple timeframes on the dashboard.
🔹 Searching For Custom Combos
Combos are made of a sequence of two or more candle numbers. These combos can highlight multiple reversals/continuation scenarios. Various common combos are documented by The Strat community.
This script allows users to search for custom combos by entering them on the Combo user setting field.
When a user combo is found, it is highlighted on the chart as a box highlighting the combo range.
🔹 Pivot Combos
It can be of interest to a user to display the combo associated with a pivot high/low. This script will highlight the location of pivot points on the chart and display its associated combo by default. These are based on the Pivot Combo lookback and not displayed in real-time.
Users can see on the dashboard the combos associated with a pivot high/low, these are ranked by frequency.
🔹 Pivot Machine Gun (PMG)
Pivot Machine Guns (PMG)s describe the scenario where a single price variation breaks the value of multiple past successive higher lows/lower highs. This can highlight a self-exciting behavior, where even more past successive higher lows/lower highs get broken.
Users can select the minimum sequence length of successive higher lows/lower highs required for a PMG to be detected, as well the amount of these successive higher lows/lower highs that must be broken.

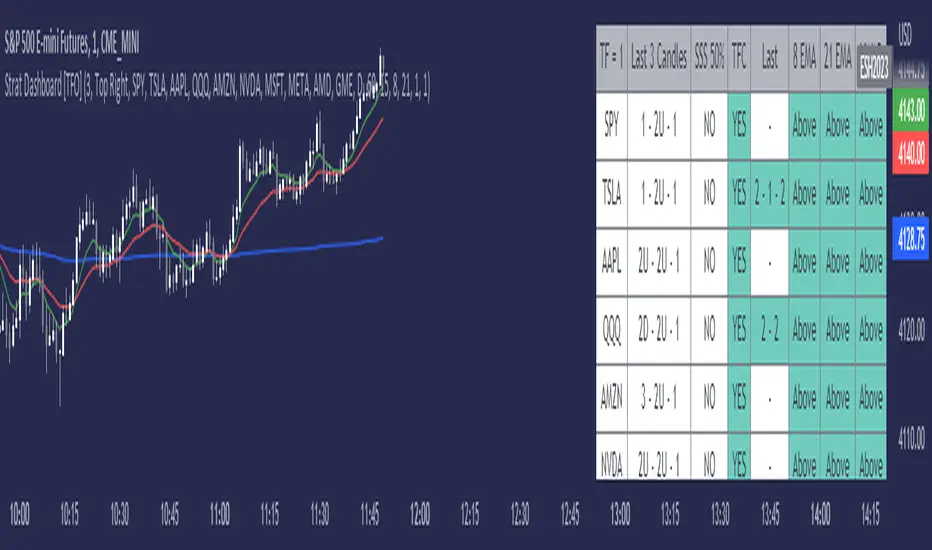
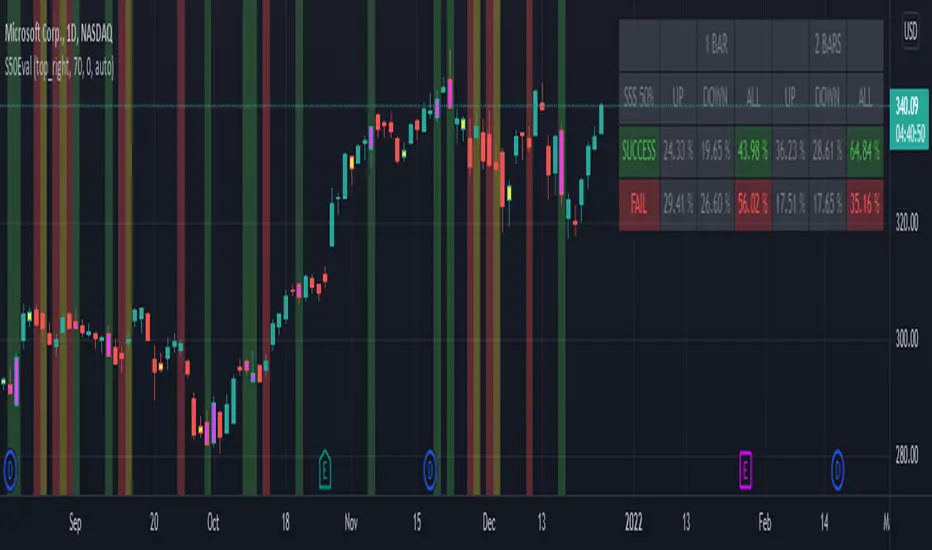
Strat Dashboard [TFO]The Strat Dashboard tracks up to 10 signals while highlighting common strat reversal patterns, the SSS 50% rule, timeframe continuity, and some additional criteria with VWAP and moving averages.
With the strat, all price action bars/candles are simplified into 3 total possibilities: 1 (inside bar), 2 (a bar that takes the previous bar's high OR low), and 3 (outside bar). The first table column for Last X Candles shows the most recent candles according to this notation, for example, 1 - 2D - 2U. This would mean we had an inside bar, followed by a bar that took the previous bar's low, followed then by a bar that took the previous bar's high. Note that the colors in this column are set according to whether the current bar's close exceeds the previous bar's high/low. By default, these colors are green if above the previous bar's highs, or red if below the previous bar's lows. If the current close is in between the previous candle's high and low (even after already taking the prior high or low), no color will be applied.
The SSS 50% column shows a yes or no value for whether the current bar aligns with the SSS 50% rule, where a bar has taken either the previous high or low, and has since reversed to at least the midway point of the previous bar's height - essentially anticipating a 2 that may become a 3 (outside bar).
Timeframe continuity (TFC) shows a yes or no value for when the current candle on multiple timeframes are all green or red (above the open price or below the open price, respectively). For example, if you were looking at the current 15m, 1h, and 1D bars, and they were all above the open price, you could say there's TFC between all three timeframes. As of the initial release, you can select up to 3 different timeframes. The table values will only be true when all selected timeframes are in alignment. When setting alerts, first deselect the timeframes if you don't want TFC logic to impact alerts.
The "Last" column shows the last strat reversal pattern that was confirmed (after the last bar closes). Waiting for a candle close is the safer option since a 2 can turn into a 3; however for higher timeframes, it may be beneficial to make an update to this indicator in which you can have live alerts as well (not waiting for a candle close). You can select which strat reversals you want to be shown from the settings. Various strat reversals may be selected for alerts of type "Any"; for example, if setting up an alert for "Any" strat reversal on Symbol 1, then this alert will go off when any of the *selected* strat reversals occur for that specific symbol. Deselect any strat reversals that you don't want to be included in these alerts.
Lastly, the EMA and VWAP columns simply show whether price is above or below said value. This tracks the current candle close, and may repaint/change several times if the current bar is oscillating above and below these values.
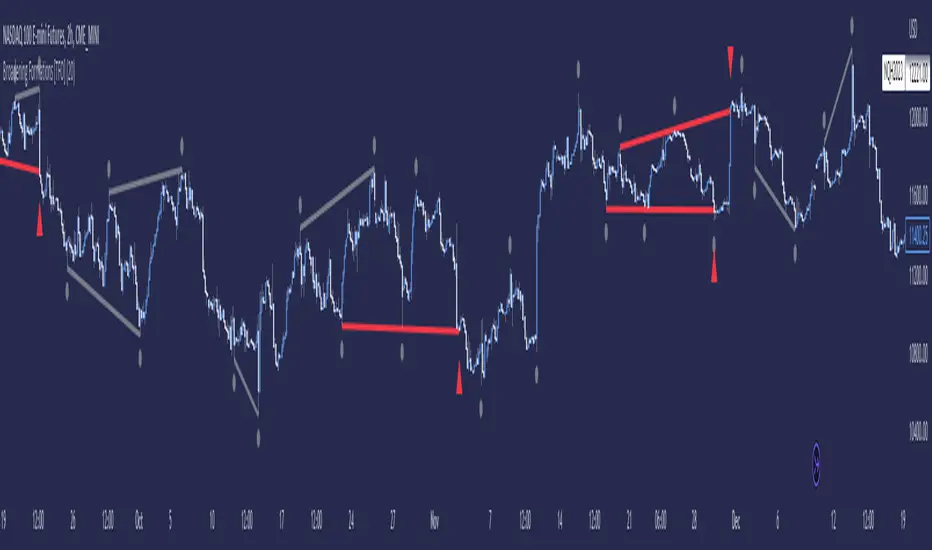
Broadening Formations [TFO]This indicator highlights deviations from broadening formations (or megaphone patterns). Deviations from broadening ranges can often foreshadow reversals, especially in consolidation phases. These deviations are highlighted via trendlines that change color when tested, and also have the option to be alerted.
These broadening formations are heavily used with "The Strat" and can add confluence when looking for reversals within higher timeframe points of interest.
GRIDBOT Scalper by nnamWhat is this Indicator used for?
Made specifically for GRID Bots
note: before continuing... this indicator works on any timeframe, but it WORKS BEST ON THE 15 MINUTE TIMEFRAME
Straters and Forex Master Pattern Value Line Traders use this to help determine when the price could reverse.
This indicator is a scalping indicator that produces signals when a "potential" reversal in price is indicated. When the price moves UP and a Potential Bearish Reversal Signal occurs, traders can use this signal as a potential SHORT entry signal for their Short Grid Bot. The process is the same in reverse. After a sustained move down, a Potential Bullish Signal can be used by the trader as a potential LONG entry signal for their GridBot.
As shown in the screenshot below, lines develop on the chart (either RED or GREEN) indicating that a sustained move in one direction is currently occurring; however, there is no potential reversal signal plotted (this means that price action is currently moving in one direction only).
As shown in the screenshot below, lines can be used as a stop-loss after entering the GRIDbot. (usually, by this time, the Grid Bot is in Profit as it usually moves in the opposite direction first)
What this Indicator Does
The GRIDBOT Scalper provides information regarding potential reversals in the market after a sustained movement in one direction (either Bullish or Bearish).
The indicator is based on PRICE-ACTION ONLY and does not take into account the current state of the market (Bullish or Bearish).
Once the price moves in a particular direction for at least 14 bars , a line appears as shown in a previous screenshot. Once the price stops moving in that direction and begins moving in the opposite direction - and after a sustained run - a "signal" appears alerting the trader that a "potential" reversal could be on the horizon soon.
If price moves in one direction and plots both a line and a signal and then begins moving back in the other direction in a sustained manner, the original signal will remain even when a NEW line begins forming (the original line will disappear). (see below) This line will continue to move as the price continues to move. Not until a signal plots on the chart is the potential reversal forming. THE LINE DOES NOT SIGNAL A REVERSAL . Some traders, however, use this information to "ride the wave UP or DOWN" and exit their positions once the signal prints.
As shown below, optional input settings allow the trader to set the line at CLOSE or HIGH/LOW of the candle preceding the potential reversal.
It is suggested to use Close instead of High or Low but the setting allows one to use either.
As shown in the screenshot below, it is typical on LOWER TIME FRAMES to see the price pass the signal line. The Indicator works best on the 15 minute timeframe, as it gives the trader time to make the decisions required as the volatility is less on the 15 minute chart vs the 1 minute or 5 minute charts.
If you have any questions or suggestions for this indicator, please join our Discord. We offer free training on this Indicator on our Discord Server.

Big Poppa Code Strat & Momentum Strategy IndicatorThis indicator is a combination of a few things in order to work with a unique trading style gleaned from Callme100k, jrgreatness, TrustMyLevels , FaithInTheStrat, Rob Smith and Saty Mahajan.
This Indicator is created to help you day trade using, ATR Fibonacci Levels, Price Action and Momentum.
It displays Fibonacci Levels Based on ATR to indicate when a security is 0.236, 0.382 +- the Days Open, +- the Days Open, 0.618 +- the Days Open and 1.0 +- Days Open.
To understand this script you need to understand
Average True Range (ATR)
1 Bar Inside Bar
2 Bar Outside Bar (Break either the top or bottom)
3 Bar Engulfing Bar
Strat Setups - 212, 322, 312
Fibonacci - 0.236, 0.382, 0.618, 1.0
Moving Averages
A Trend is considered bullish when (green)
Current Price is greater than the Fast EMA Value (8)
Fast EMA is greater than PIVOT EMA Value (21)
Pivot EMA is greater than SLOW EMA Value (34)
OR Hull is trending up and the Price is above the Volume Weighted Moving Average and price is above VWAP
A trend is considered Bearish when (red)
Current Price is less than the Fast EMA Value (8)
Fast EMA is less than PIVOT EMA Value (21)
Pivot EMA is less than SLOW EMA Value (34)
OR Hull is trending down and the Price is below the Volume Weighted Moving Average and price is below VWAP
If these conditions are not met then the Momentum is in Conflict (orange)
The Momentum band will match the color of the current trend
The table that is present can be turned off at any time lets you see
1) If Moving Averages are showing bullish, bearish or in conflict
2) If There us Time Frame Continuity, (if 5 min up, are all the other timeframes up also)
3) How much of the ATR have we moved on the day
4) Are we in Call or Put range for the day based on ATR Fib Levels
The Ideal situation for entering a call
1) Momentum is Green
2) FTFC on Green
3) A Strat Actionable Signal is present
4) You are in the call range, 0.236 - 0.618 ATR + the Price
5) The ATR still has room, I.e only 50% of the ATR has been run already
Ideal situation from entering a put
1) Momentum is red
2) FTFC on Red
3) A Strat Actionable Signal is present
4) You are in the put range, 0.236 - 0.618 ATR - the Price
5) The ATR still has room, I.e only 50% of the ATR has been run already
Exit the trade for these reasons you entered (for profit or loss)
1) ATR has no more room
2) FTFC is now in conflict
3) Momentum has shifted
Take Profit when
1) You reach a new ATR Level 0.618, 1.0 , -0.618, -1, etc
Passive Stop Loss
1) Open Price if you are aggressive
2) Next ATR Level Down or Up
Feel free to take profit and leave runners
This script does not give signals, you should do your own research, I am not a financial advisors, I am simply applying principles of seasoned veterans to code. You make all decisions about how you buy, sell and trade. The creator of this script makes no promises and takes no responsibility for your personal trading.
To research the methods described above look up
Rob Smith : The Strat
Saty Mahajan : ATR Levels
Fibonacci
Using the HULL Moving Average
Exponential Moving Averages
VWAP
VWMA

Timeframe Continuity [TFO]Simple timeframe continuity indicator - see whether the selected timeframes are currently above or below their opening prices. Allows up to 10 different timeframes to be used.

[BM] HTF Candle Evolution█ OVERVIEW
This script shows how a higher timeframe candle evolves over time.
It was created as a visual aid to #TheStrat and provides a new way of looking at Timeframe Continuity.
█ FEATURES
General
HTF: Higher Timeframe selection with dropdown and ability to manually input a timeframe that is not present in the dropdown.
Label: Show a label with the selected higher timeframe.
Marker: Shows a marker symbol at the start of each new higher timeframe.
Align: Aligns the candles around a selected center line.
The Strat
Multi-timeframe analysis is used extensively in #TheStrat (created by Rob Smith), so the ability to add #TheStrat coloring has been made available.
Scenario: Define the colors for the strat scenario's.
Coloring of: Choose which part of the candles you want the selected strat scenario colors to be applied to.
Band: Display a band that shows the active strat scenario color of the selected higher timeframe.
All features are completely customizable.

Previous High/Low LevelsPrevious High/Low Levels
Select 5 Custom Timeframes to display the previous High and Low levels on your chart.
NOTE: For Levels to work correctly and for price labels to be displayed, Right-click chart background -> select Settings -> select Scales -> tick “Indicator Last Value Label".
Once indicator has been added open settings and select timeframe, color, labels, offset parameters and line style as desired then SAVE.
Handy when using The Strat.

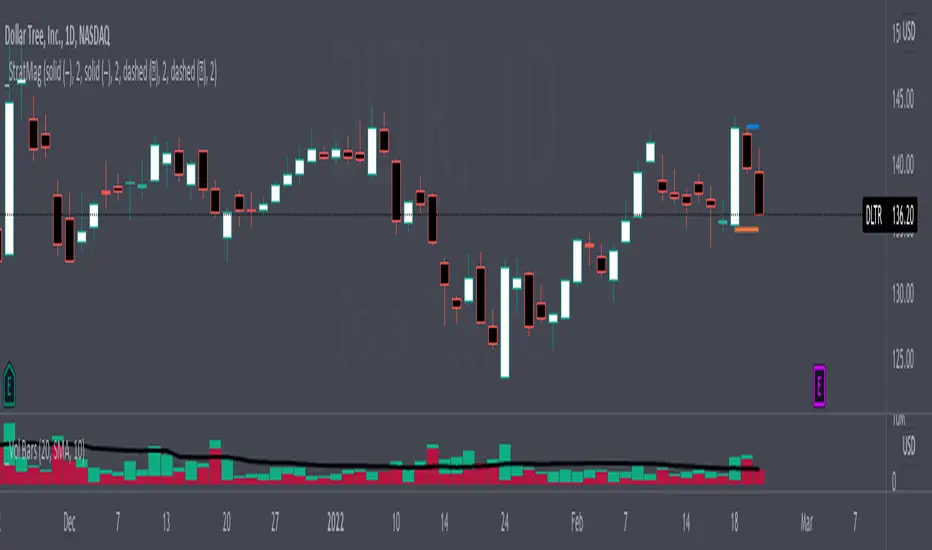
Strat Magnitude LinesHave you ever wished you could easily see the daily magnitude line of a Strat Combo while on a smaller timeframe intraday chart? This indicator allows you to do that and much more!
Description
This indicator does two simple things, but it does them very well. The first thing it does is draw a small horizontal line at the magnitude level of a Strat Setup (a potential Strat Combo before the last candle has formed) on the daily chart. This is intended to help the user easy ascertain how much magnitude distance (distance between trigger line and magnitude line) of a potential Strat Combo the night before when the user is searching for trades to play the next trading day. If the last two candles on a daily chart form the first two bars of a Strat Combo, then this indicator display a horizontal line where the ultimate magnitude would be if the next trading day a Strat Combo was formed. This helps the trader gauge whether there is sufficient magnitude that makes it worth it to even consider trading the next day.
The second and most important thing this indicator does is display the daily magnitude line while the user is in a smaller timeframe managing their trade. This helps the user have an easily identifiable line to show where to take full or partial profit at. There is no need to keep track of manually drawn lines or the hassle of letting your charts get cluttered with lines that the user forgot to delete. This indicator finds potential Strat Combos (aka Strat Setups) and dynamically draws horizontal lines for the user and removes them when they are no longer in use. The user can focus on taking profit and making money and leave the hassle to the indicator.
Inputs & Style
All four lines (two daily lines and two intraday lines) can be independently configured. Each lines color, line style, and width can be adjusted. To turn “off” a line change the opacity to 0%.
Automatic daily magnitude line on intraday chart
The Strat Numbers & CombosThis indicator is an all-in-one " The Strat " script. This script displays the following:
The Strat candle numbers (1's, 2's, & 3's)
The Strat Combo labels along with trigger line
Pivot Machine Gun ( PMG ) dynamic labels
Hammer & Shooter candle labels
The Strat Candle Numbers label each candle, on any timeframe, either a 1, 2, or 3. 1's are inside bars of the previous candles. 2's take out only one side of the previous candle. And 3's go outside both sides of the previous candle.
The Strat Combo labels (which are made of the 1's, 2's, 3's outlined above) display labels when a Strat Combo occurs. The script displays a label, direction arrow, and trigger line for each Strat Combo. This indicator finds the following Strat Combos:
2-1-2 bullish reversal (BLR)
2-1-2 bullish continuation (BLC)
3-1-2 BLR
3-2-2 BLR
1-2-2 rev strat BLR
2-2 BLR
2-1-2 bearish reversal (BRR)
2-1-2 bearish continuation (BRC)
3-1-2 BRR
3-2-2 BRR
1-2-2 rev strat BRR
2-2 BRR
Double inside candles
The Pivot Machine Gun (PMG) labels any 5 or more consecutive candles that make higher lows or 5 or more consecutive candles that make lower highs. A PMG can continue going in its direction or it can reverse and come back through the range. The logic in this indicator dynamically finds each level in a PMG and draws a line for easy identification.
The script also identifies if the candle type is a Hammer, Inverted Hammer, Shooting Star, or Hanging Man. These candle types are highly likely reversal points in price action.The indicator will plot a shape with a color coded icon identifying the candle. The distance between the shape and the candles can be manually adjusted in the inputs section.
This indicator has many style options . The user can independently toggle on/off the Strat numbers, boxes around the Strat Combos, and Hammer and Shooter shapes. Also all of the colors used in this script can be changed from the inputs section, so a user can easily change colors to match their current color scheme.

[BM] SSS 50% Rule EvaluatorSara Strat Sniper 50% Rule Evaluator
█ OVERVIEW
This indicator is based on Sara Strat Sniper's - 50% Rule for trading Outside Bars and helps you to evaluate the historical success rate of that rule.
█ FEATURES
Calculation
• You can choose to evaluate only the current bar to see if it forms an outside bar (success) or not (fail), but you can also choose to include the next bar to see if that one forms a compound outside bar.
• You can enable a start and/or end date to limit the calculation period.
Table
• Show or hide the table with the calculation results.
• Show or hide the calculation details (up/down data).
• Position of the table, opacity, cell width and text size can be customized.
Colors
• Table colors can be customized.
• You can choose to show the inside/outside bars in customizable bar colors.
• You can choose to identify successful/failed/recovered outside bars in customizable background colors.
█ LIMITATIONS
• This script uses a special characteristic of the `security()` function allowing the inspection of intrabars — which is not officially supported by TradingView.
• Intrabar inspection only works on some chart timeframes: 5, 10, 15, 30, 45 and 195 minutes, 1, 2, 3, 4, 5, 6, 7 and 8 hours, 1, 2, 3, 4 and 5 days, 1, 2, 3 and 4 weeks, 1, 2, 3, 4, 5, 6, 7, 8, 9, 10, 11 and 12 months. The script’s code can be modified to run on other resolutions.
• There is a limit to how far back intrabar calculations can be performed, and is dependant on both the intrabar resolution and your subscription (which determines the number of available bars).
RM Timeframe ContinuityThis indicator plots a table off to the right of the chart to help with determining timeframe continuity. Per the Strat, a great edge is only taking trades where full timeframe continuity is in place (i.e. if you are going long, make sure other timeframes are also green).
In this script:
Green candles have green colored boxes, red candles have red colored boxes.
Inside bars are represented by a circle - ⬤
Outside bars are represented by a tall rectangle - ▮
2-up bars are indicated by an up arrow - ▲
2-down bars are indicated by a down arrow - ▼
User defined options:
Pick any timeframe for the 4 boxes
Choose whether to plot the highs/lows of the larger timeframe candles as horizontal rays on your chart (along with the associated colors)

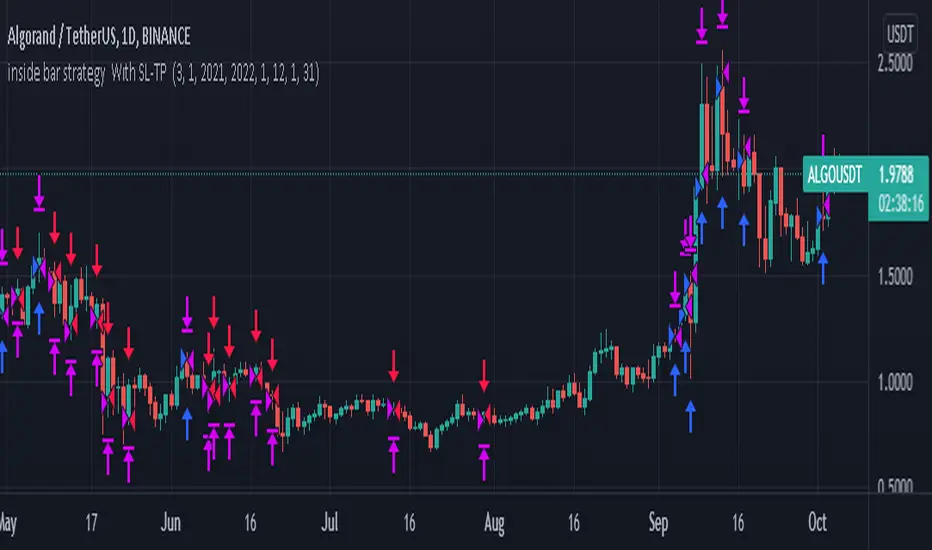
inside bar strategy Wıth SL-TP Based on strat bars to enter trades, you can use it with very low stop loss level and try all coins in daily frequency
The Strat info boxThis indicator is an all in one indicator for the "The strat" method by Rob Smith. This indicator DOES NOT provide trading advice or trade entry signals!
What is included:
* Candle Type 1 - Inside Candle
* Candle Type 2- Up or Down Candle
* Candle Type 3 - Engulfing Candle
* Strat signal:
- 2-1-2 setup
- 3-2-2 setup
* Full Timeframe Continuity:
- from a 5min timeframe to a yearly timeframe. Green gives you an uptrend, Red a downtrend.
* middle of day and week
- this give you a support and resistance level at the middle of the day or week. This is a good indicator if the stock goes up or down
* extra info like:
- ATR of 14 days
- DTR of current day
- Volume info
- Float info
NASDAQ:FB

#TheStrat - Highs and Lows of Candles of 4 Custom Time framesThe bread and butter of strat traders is multi-timeframe analysis. We do MTFA in 2 different ways: 1) By Looking for entries confirmed by Full Timeframe Continuity which is just another way of saying that on multiple timeframes, the candles currently forming are all uniform in direction(ie. all red candles or all green candles), and 2) Looking for Strat reversal on lower timeframes that trigger your higher timeframes reversals.
This script is concerned with the latter piece of multi-timeframe analysis, and its application to the strat
Anyone who has watched Sara's videos teaching the strat can see how she uses the highs and lows of her major time periods, the monthly, weekly, and daily, to find entries from her lower time periods to trigger her higher timeframes. This script performs the process of marking the highs and lows of 4-major time periods automatically so that you do not need to mark every single chart you use manually. I have found this script to be very useful, and convenient. I hope that other stratters find it as useful as I am. Below outlines how to use this, although it is mostly self-explanatory. Special thanks and credit to millerrm, who I used his original code snippets to rework his original script to something more tailored to my personal use cases.
Settings -
You can change the time periods of the candles that you would like to mark to any time frame using the 4 dropdown boxes marked TF#
You can choose to toggle the lines for each given time period on and off, in the settings by checking off each time period.
The default colors are purple, blue, orange, and white, in order respective of time from shortest to highest
The default time periods are 3hr, 6hr, 12hr, and daily

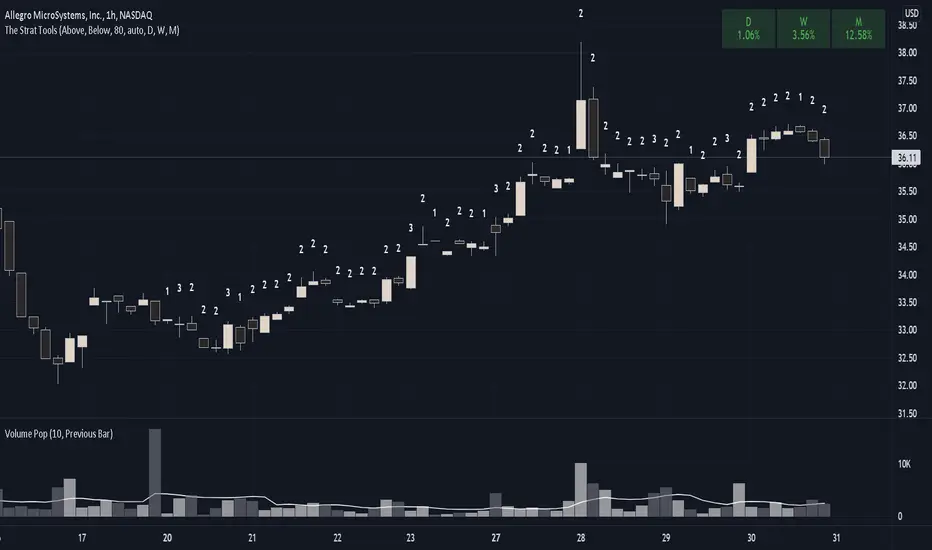
The Strat ToolsThis indicator will be collection of tools for using Rob Smith's The Strat.
Currently only bar numbers is implemented.
Every individual tool can be enabled or disabled and customized.
#TheStrat
RM StratThis is my attempt to code up the rules of "The Strat." I've seen other scripts that do parts of what my script does, but this script combines all of them into one script and allows the user control over how they interact with each other.
What's in this indicator?
Show the Strat Candle Numbers (1 - inside bar, 2 - continuation bar, 3 - outside bar) on the chart.
Show a widget off to the right of the chart for multi-timeframe analysis. This widget tells you whether the D/W/M/Q candles are currently green or red as well as the Candle type (White Circle - (1) Inside Bar, Up Green Arrow - (2U) Continuation Bar, Down Red Arrow - (2D) Continuation Bar, Green/Red Square - (3) Outside Bar)
Integrates the long and short rules into the chart. These can also be turned off if you don't want to see them. Note: this is a simplified version of these rules - if you look at the cheat sheets floating around the internet, you'll notice that all trade initiations occur on a break of the high (for longs) or low (for shorts) of the previous candle as long as that previous candle was not a 2. So that's my only rule for going long or short. I think it matches well with the cheat sheets but is way simpler to code and to think of how it works. The other benefit is it shows you failed trades that the cheat sheet won't catch - where a 2 becomes a 3 in the other direction and stops you out. You'll see that now with this script.
Ability to filter out the long/short rules based on the timeframe continuity of the higher timeframe candles. This is user-configurable so that you can experiment with timeframe continuity and see how strict you want to be with this on your trades.
Show the high/low of the Day, Week, and Month on your chart as horizontal lines that you can use as a reference. This could be used for planning profit targets or seeing how likely a reversal might indicate moving into timeframe continuity.

Candle Type w/2Up + 2Dn v2.0This script builds on Candle Type w/2Up + 2Dn by incorporating signals for inside + up, outside + up, + rev strat set-ups. All of these can be turned off if they compete w/ other indicators or just clutter up the chart.
Briefly, the script works based on #thestrat developed by Rob Smith and the 1-2-3 bar script coded by @Crinklebine. Candle Type w/2Up + 2Dn is a "fork" of @Crinklebine's excellent indicator. I find the visualization of U-D-I-O (up/dn/inside/outside candles) easier to scan through 100's of charts than 1-2-3's. This is just personal preference, but they work based on the exact same principles. Performance is enhanced with a trend filter like @boardriderb's "TC" script or similar timeframe continuity filters based on the #thestrat developed by Rob Smith. I also prefer an ATR-based trailing stop; Rob recommends pSAR for trailing stops.
Together these indicators form a power system, but users are still responsible for their own trade management, entries & exits, risk profiles, stop loss, etc.

Candle State (The Strat)This script identifies the 2 different Candle States for use in #TheStrat.
Candle Up - The close of the current candle is greater than the close of the previous candle.
Candle Down - The close of the current candle is less than the close of the previous candle.
Though this script is extremely simple it is a teaching aid for #TheStrat.
The script also assists in the identification of up and down candles with gaps where the color of candle will not always match the Candle State.
Analysis of the candle types can help you define actionable signals and draw broadening formations.
Disclaimer: All scripts from this account are for informational purposes only and do not produce buy or sell recommendations.
© 2020 Crinklebine
