MTFT Patterns Noob, TheStrat Suite (1of5)Multi Time Frame Tools
Multi Time Frame Tools (MTFT) is a suite of scripts aimed to establish a standard timeframe-based color scheme. This can be utilized to overlay different timeframes calculations/values over a single timeframe. As one example, this would allow to observe the 5-month moving average, 5-week moving average, and 5-day moving average overlaid over each other. This would allow to study a chart, get accustomed to the color scheme and study all these at the same time much easier.
All indicators calculated using the below specific timeframes as input, will always use the color scheme outlined below. This is to get you in habit of recognizing the different timeframes overlaid in top of each other. These can be personalized.
Longer TF analysis.
Yearly - Black
Semi-Annual - Yellow
Quarterly - White
Monthly - Maroon
Weekly - Royal Blue
Daily - Lime
Shorter TF analysis.
4 hour - Fuchsia
1 hour - Orange
30 min - Red
15 min - Brown
10 min - Purple
5 min - Lilac
All color coordination is able to be modified in either the “Inputs” or “Style” section. If you need to make changes, make sure to select “Save as Default” on the bottom right of the settings menu.
Recommended Chart Color Layout
I played around with color coordination a lot. The final product was what worked best for me. I personally use the following chart settings to accent all available TF colors.
-> Click on the settings wheel on your chart. -> Click on “Appearance”.
Background - Solid -> On the top row pick the 6th color from the left.
Vert Grid Lines and Horz Grid Lines -> On the top row pick the 7th color from the left.
You may of course change these and the indicator line colors as you like.
Adding indicator to Chart
-> Open the TradingView “Indicators & Strategies” library, the icon has “ƒx”. -> All premium scripts will be located under “Invite-Only Scripts” -> Click indicator to add to your chart.
MTFT TheStrat Suite (5 Scripts)
Rob Smith is the creator of ‘TheStrat’ trading strategy. For ‘TheStrat’ I have put together a suite of 5 premium scripts that combined will offer people interested in learning ‘TheStrat’ a cleaner learning process. For 2 of the 5 scripts specifically, the MTFT approach of overlaying multiple longer timeframes(TF) over a shorter TF selected as a display cannot be utilized. The other 2 scripts will have full MTFT functionality and they are my personal favorite. I will be providing very basic info to utilize this script; it is up to you to dive deep into learning this strategy. I am not an expert with the tool or a financial advisor. As with all aspects of life, I recommend you research, learn, discern and practice extensively in order to become a master.
*1. MTFT Patterns Pro/Noob
2. MTFT Full Time Frame Continuity Table
3. MTFT Last HML wOpen
4. MTFT Actionable Signal Targets
5. MTFT Reversal Lines
MTFT Patterns Pro/Noob, TheStrat Suite (1of5)
Features includes:
1.) Absolute Truth #. This setting will provide the candlesticks absolute truth # below the CS.
2.) Color bars based on Absolute Truth. This setting will color all inside candlesticks yellow, all Green Outside Candlesticks White and all Red Outside Candlesticks Fuchsia. Scenario 2 candlesticks are left as is and will color based on the color of the original candlestick. This setting is default enabled and needs to be disabled in the “Style” tab under the indicator settings wheel. I found this more practical in getting used to the 3 absolute truth scenarios.
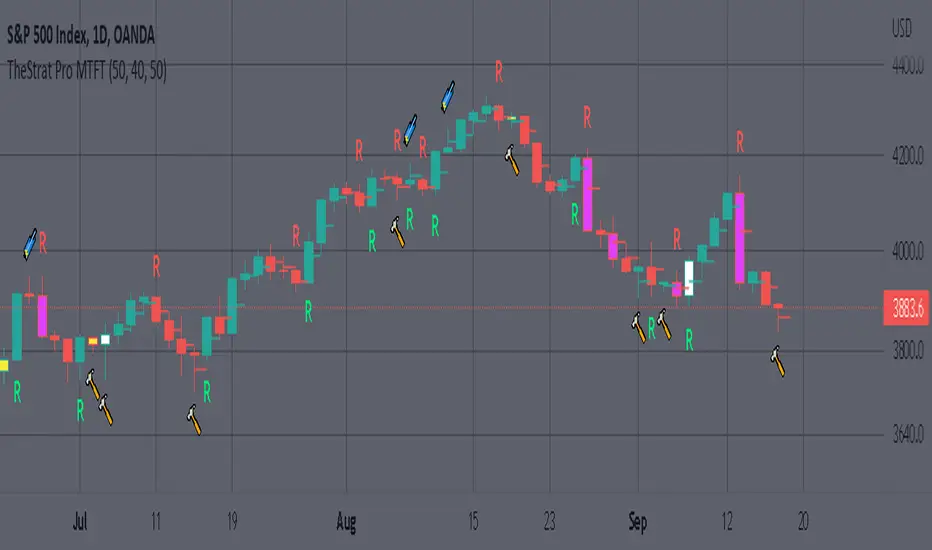
3.) Reversals. This setting will mark when reversal patterns as discussed by Rob are posted. Noob version will also include the description of the reversal pattern, while the Pro version will only plot an ‘R’ without the text description. Note: There should never be back-to-back green Rs or red Rs. I found this issue a lot on many of the other ‘TheStrat’ scripts out there. TradingView development team note: The plotchar function does not allow dynamic text so this is the only reason on why there needs to be two separate versions of the script. ‘Pro’ is important for experienced users that already identify the patterns without the text and ‘Noob’ is important for beginner users that still need the text description of the pattern.
4. Continuations. This setting will mark when continuation patterns as discussed by Rob are posted. Noob version will also include the description of the continuation pattern, while the Pro version will only plot a ‘C’ without the text description.
TradingView Admin note: The plotchar function does not allow dynamic text so this is the only reason why there needs to be two separate versions of the script. ‘Pro’ is important for experienced users that already identify the patterns without the text and ‘Noob’ is important for beginner users that still need the text description of the pattern.
5. Actionable Signals and Complex Actionable Signals (CAS). This has several objective parameters as defined by Rob’s course. ‘Complex Actionable Signals’ is a name I used when speaking of actionable signals that require a combination of 2 or more candlesticks.
Actionable Signals.
• All inside candlesticks(Absolute Truth #1)
• Hammers
• Shooting Stars
Complex Actionable Signals.
• (Absolute Truth Combo 1-3-1 )Inside Outside Inside
• Outside -> Hammer
• Outside -> Shooting Star
• Inside -> Hammer
• Inside -> Shooting Star
• Momentum Inside
• Momentum Hammer
• Momentum Shooting Star
• Hammer -> Shooting Star
• Shooting Star -> Hammer
5a. Example CAS 1-3G-1. I am including only one example of several of the CAS that are included in this script. The star is utilized for all CAS, the color and location designate the direction that the CAS would have you act on. Note the “Entry” and “Target” line were added manually and are not part of the script. This is one successful setup; don’t get excited thinking this is how it always works. I will let you discover and learn for yourself that there is many failed setups and many setups that never trigger the actionable signal. This is where setting alerts is very handy.
6. Alerts. Press on the “Create Alert” Icon for TradingView. When the prompt opens select the preferred script either “TheStrat Pro” or “TheStrat Noob” under “Condition” and then under the sub-menu select any of the following scenarios.
• C ▲/ ▼ = If the active CS shows a continuation up/down pattern, remember this CS is active and can still change direction and trigger a reversal in the other direction.
• R ▲/▼ = If the active CS shows a reversal up/down pattern, remember this CS is active and can still change direction and trigger a continuation in the previous trend direction.
• HM Trigger(Last High Cross) = Alert when the active CS breaks the high of the previous CS. As a new CS opens, it re-adjusts its values and is just constantly waiting for the active CS break through the previous CS high.
• SS Trigger(Last Low Cross) = Alert when the active CS breaks the low of the previous CS. As a new CS opens, it re-adjusts its values and is just constantly waiting for the active CS break through the previous CS low.
• Inside Trigger (Last High/Low Cross) = Alert when the active CS breaks the low or the high of the previous CS. As a new CS opens, it re-adjusts its values and is just constantly waiting for the active CS break through either the previous CS low or the high.
• Last CS Inside
• Last CS H
• Last CS S
• Last CS Actionable Signal (inside, H or S)
• Last CS Complex Actionable Signal
• Last CS Any Actionable Signal
Thestrat

MTFT Patterns Pro, TheStrat Suite (1of5)Multi Time Frame Tools
Multi Time Frame Tools (MTFT) is a suite of scripts aimed to establish a standard timeframe-based color scheme. This can be utilized to overlay different timeframes calculations/values over a single timeframe. As one example, this would allow to observe the 5-month moving average, 5-week moving average, and 5-day moving average overlaid over each other. This would allow to study a chart, get accustomed to the color scheme and study all these at the same time much easier.
All indicators calculated using the below specific timeframes as input, will always use the color scheme outlined below. This is to get you in habit of recognizing the different timeframes overlaid in top of each other. These can be personalized.
Longer TF analysis.
Yearly - Black
Semi-Annual - Yellow
Quarterly - White
Monthly - Maroon
Weekly - Royal Blue
Daily - Lime
Shorter TF analysis.
4 hour - Fuchsia
1 hour - Orange
30 min - Red
15 min - Brown
10 min - Purple
5 min - Lilac
All color coordination is able to be modified in either the “Inputs” or “Style” section. If you need to make changes, make sure to select “Save as Default” on the bottom right of the settings menu.
Recommended Chart Color Layout
I played around with color coordination a lot. The final product was what worked best for me. I personally use the following chart settings to accent all available TF colors.
-> Click on the settings wheel on your chart. -> Click on “Appearance”.
Background - Solid -> On the top row pick the 6th color from the left.
Vert Grid Lines and Horz Grid Lines -> On the top row pick the 7th color from the left.
You may of course change these and the indicator line colors as you like.
Adding indicator to Chart
-> Open the TradingView “Indicators & Strategies” library, the icon has “ƒx”. -> All premium scripts will be located under “Invite-Only Scripts” -> Click indicator to add to your chart.
MTFT TheStrat Suite (5 Scripts)
Rob Smith is the creator of ‘TheStrat’ trading strategy. For ‘TheStrat’ I have put together a suite of 5 premium scripts that combined will offer people interested in learning ‘TheStrat’ a cleaner learning process. For 2 of the 5 scripts specifically, the MTFT approach of overlaying multiple longer timeframes(TF) over a shorter TF selected as a display cannot be utilized. The other 2 scripts will have full MTFT functionality and they are my personal favorite. I will be providing very basic info to utilize this script; it is up to you to dive deep into learning this strategy. I am not an expert with the tool or a financial advisor. As with all aspects of life, I recommend you research, learn, discern and practice extensively in order to become a master.
*1. MTFT Patterns Pro/Noob
2. MTFT Full Time Frame Continuity Table
3. MTFT Last HML wOpen
4. MTFT Actionable Signal Targets
5. MTFT Reversal Lines
MTFT Patterns Pro/Noob, TheStrat Suite (1of5)
Features includes:
1.) Absolute Truth #. This setting will provide the candlesticks absolute truth # below the CS.
2.) Color bars based on Absolute Truth. This setting will color all inside candlesticks yellow, all Green Outside Candlesticks White and all Red Outside Candlesticks Fuchsia. Scenario 2 candlesticks are left as is and will color based on the color of the original candlestick. This setting is default enabled and needs to be disabled in the “Style” tab under the indicator settings wheel. I found this more practical in getting used to the 3 absolute truth scenarios.
3.) Reversals. This setting will mark when reversal patterns as discussed by Rob are posted. Noob version will also include the description of the reversal pattern, while the Pro version will only plot an ‘R’ without the text description. Note: There should never be back-to-back green Rs or red Rs. I found this issue a lot on many of the other ‘TheStrat’ scripts out there. TradingView development team note: The plotchar function does not allow dynamic text so this is the only reason on why there needs to be two separate versions of the script. ‘Pro’ is important for experienced users that already identify the patterns without the text and ‘Noob’ is important for beginner users that still need the text description of the pattern.
4. Continuations. This setting will mark when continuation patterns as discussed by Rob are posted. Noob version will also include the description of the continuation pattern, while the Pro version will only plot a ‘C’ without the text description.
TradingView Admin note: The plotchar function does not allow dynamic text so this is the only reason why there needs to be two separate versions of the script. ‘Pro’ is important for experienced users that already identify the patterns without the text and ‘Noob’ is important for beginner users that still need the text description of the pattern.
5. Actionable Signals and Complex Actionable Signals (CAS). This has several objective parameters as defined by Rob’s course. ‘Complex Actionable Signals’ is a name I used when speaking of actionable signals that require a combination of 2 or more candlesticks.
Actionable Signals.
• All inside candlesticks(Absolute Truth #1)
• Hammers
• Shooting Stars
Complex Actionable Signals.
• (Absolute Truth Combo 1-3-1 )Inside Outside Inside
• Outside -> Hammer
• Outside -> Shooting Star
• Inside -> Hammer
• Inside -> Shooting Star
• Momentum Inside
• Momentum Hammer
• Momentum Shooting Star
• Hammer -> Shooting Star
• Shooting Star -> Hammer
5a. Example CAS 1-3G-1. I am including only one example of several of the CAS that are included in this script. The star is utilized for all CAS, the color and location designate the direction that the CAS would have you act on. Note the “Entry” and “Target” line were added manually and are not part of the script. This is one successful setup; don’t get excited thinking this is how it always works. I will let you discover and learn for yourself that there is many failed setups and many setups that never trigger the actionable signal. This is where setting alerts is very handy.
6. Alerts. Press on the “Create Alert” Icon for TradingView. When the prompt opens select the preferred script either “TheStrat Pro” or “TheStrat Noob” under “Condition” and then under the sub-menu select any of the following scenarios.
• C ▲/ ▼ = If the active CS shows a continuation up/down pattern, remember this CS is active and can still change direction and trigger a reversal in the other direction.
• R ▲/▼ = If the active CS shows a reversal up/down pattern, remember this CS is active and can still change direction and trigger a continuation in the previous trend direction.
• HM Trigger(Last High Cross) = Alert when the active CS breaks the high of the previous CS. As a new CS opens, it re-adjusts its values and is just constantly waiting for the active CS break through the previous CS high.
• SS Trigger(Last Low Cross) = Alert when the active CS breaks the low of the previous CS. As a new CS opens, it re-adjusts its values and is just constantly waiting for the active CS break through the previous CS low.
• Inside Trigger (Last High/Low Cross) = Alert when the active CS breaks the low or the high of the previous CS. As a new CS opens, it re-adjusts its values and is just constantly waiting for the active CS break through either the previous CS low or the high.
• Last CS Inside
• Last CS H
• Last CS S
• Last CS Actionable Signal (inside, H or S)
• Last CS Complex Actionable Signal
• Last CS Any Actionable Signal
The $trat | by Octopu$1️⃣2️⃣3️⃣ The $trat | by Octopu$
The $trat: The Strat by Octopu$
Absolute Solution for The Strat Traders!
The Strat is a Strategy created by Rob Smith's and is well known by being an innovative trading system.
Continues to grow in popularity as more traders discover this method.
It is a simplified way to understand Price Action. It is based on three principles: Types of candles, 1, 2, and 3.
Other things to be known about The Strat are Actionable Signals and Time Frame Continuity.
The $trat has it all.
This Indicator includes Bar Types (1, 2 and 3) also known as Inside Bars, Twos (Up or Down) and Outside Bars.
It is also well crafted with a built-in Time Frame Continuity (TFC) which shows Price Movement at a glimpse.
On top of that, in the best of both worlds, also comes with information about the Bars Status for other TFs as well.
It means that you can know how another TF of you preference is performing. Right there.
Works in Any Time Frame.
On Any Ticker.
(Using SPY 5m just as an example:)
www.tradingview.com
SPY
Features:
• Candle Types (1, 2 and 3) IB, 2U & 2D and OB.
• Time Frame Continuity (TFC) for Price Movement/Trend Check
• Bar Status shortcut. So you can know Price Action/Direction fast.
• Reversal indicators for Action-taking and Situational Awareness
• Combos Labels. So nothing ever goes unnoticed.
Options:
• Absolutely fully Customizable: Colors, Sizes, Numbers. Everything.
• On/Off Switches for most of the Information and Optionable Selections
• Hammer/Shooter Indicator automatically inserted to Chart
• Candle/Bars Coloring for ease of reading.
• Highlight options for specific setups
Notes:
v1.0
$trat Indicator release
Changes and updates can come in the future for additional functionalities or per requests.
Did you like it? Boost it. Shoot a message! I'd appreciate if you dropped by to say thanks.
- Octopu$
🐙

SSS50 StatusSSS50 Status Box with Auto Chart Levels and Labels
I made this indicator due to receiving a lot of messages on how to use my other SSS50% indicators. This indicator helps you learn and understand the Sara Strat Snipers 50 Percent Rule. Remember this indicator does not tell you when to buy or sell this is a guide on the setup ONLY.
You Must Use Rob Smith's The Strat Principles and Remember we need TIME in our favour. Ideally we want to see setups go In-Force early on during the candles lifespan (Timeframe).
Using the indicator logic, the SSS50% Rule has FOUR Conditions:
1. SSS50 INVALID = No Trade = The Candle is currently an Inside Bar OR a Green 2UP OR a Red 2DOWN.
2. SSS50 STANDBY = Failed 2* = The Candle is currently a Failed 2UP (Red 2UP) OR a Failed 2DOWN (Green 2DOWN).
3. SSS50 ACTIVE = Outside Bar Possible = The Candle is currently a Failed 2 and has crossed over the Previous Candles 50% level.
4. SSS50 COMPLETE = Outside Bar Complete = The Candle is now an Outside Bar.
How to Use this Indicator?
Add Indicator to your chart and open up the Indicator's Settings.
1. Select Indicators Timeframe.
- Chart = SSS50% rules will be applied to whichever timeframe chart you open.
- Single Timeframe = SSS50% rules will be only applied to one fixed timeframe when viewing on other timeframe charts. For Example: if you select Weekly. The Indicator's Status and Levels/Labels will only be displayed on your chart if the Weekly Candle has a SSS50 Standby, Active or Complete condition.
2. Select Status Box On/Off. If ON - Select View Type.
- Normal View = Detailed View with Price Targets.
- Compact View = Condensed View to reduce chart clutter.
3. Select AUTO or MANUAL Chart Levels/Labels. Select ONE type only or leave both off for no level/label display.
- AUTO = When an SSS50 STANDBY, ACTIVE or COMPLETE Condition occurs the related High, Low and 50% Levels will be displayed.
- MANUAL = When AUTO is OFF, MANUAL will display High, Low and 50% Levels always regardless of SSS50 Conditions.
4. Select AUTO Features.
- Display High/Low and/or 50% Price Labels when using AUTO Chart Mode.
4.1 Select AUTO Colors if required. Default to Traffic Light System.
- INVALID = Red
- STANDBY = Orange
- ACTIVE or COMPLETE = GREEN
5. Select MANUAL Features if AUTO Chart Mode is OFF.
- Display High/Low and/or 50% Price Labels when using MANUAL Chart Mode.
5.1 Select MANUAL Colors if required.
6. Additional Features. Title OR Timeframe available is Normal View. Title AND Timeframe BOTH available in Compact View.
- Show SSS50 Title next to Status Box.
- Show the indicators selected Timeframe next to Status Box. Timeframe will be displayed next to Status Box Only when ONE Individual Timeframe is selected.
7. Color Settings.
- Match your chart's current Background Color to this color.
8. Additional Settings
- Customise Label Offset Locations, Line Types and Line Types.
- Any issues let me know.
- Note I removed the price tags (used in my previous SSS50 indicators) from the right of the line to avoid clutter. Now you can see the current price move through the High, Low and 50% level lines.
- No alerts setup within script, just manually click the plus sign on each level if you wish to add alerts.

[BM] HTF Candle Evolution█ OVERVIEW
This script shows how a higher timeframe candle evolves over time.
It was created as a visual aid to #TheStrat and provides a new way of looking at Timeframe Continuity.
█ FEATURES
General
HTF: Higher Timeframe selection with dropdown and ability to manually input a timeframe that is not present in the dropdown.
Label: Show a label with the selected higher timeframe.
Marker: Shows a marker symbol at the start of each new higher timeframe.
Align: Aligns the candles around a selected center line.
The Strat
Multi-timeframe analysis is used extensively in #TheStrat (created by Rob Smith), so the ability to add #TheStrat coloring has been made available.
Scenario: Define the colors for the strat scenario's.
Coloring of: Choose which part of the candles you want the selected strat scenario colors to be applied to.
Band: Display a band that shows the active strat scenario color of the selected higher timeframe.
All features are completely customizable.

Honest Algo PremiumThis toolkit is a collection of innovative indicators, carefully designed to be as user friendly as possible. Get access to a collection of all the best we can offer in one indicator.
Providing Multiple Trading Styles
Our toolkit works in any market but has been specifically designed for Bitcoin and Forex.
Detect the direction of the trend using an algorithm based on our bounce manager ATR consolidation filtering
Find bounces from a handful of different pre-determined lines, the include a 20 period EMA, a supertrend, a T3 moving average and kijun-sen
Detect Rob Smith #thestrat entries
Filter out noise with our environment filters
and much more. (Check the changelog below for future additions)
If you want more information on how the price action entries of Rob Smith #thestrat work, there are many tutorials on the internet.
When using Rob Smith #thestrat entries the indicator uses bounce manager with a 200 period EMA for trend based bar coloring.
A quick explanation how it finds bounces from these lines:
Filter signals based on timeframe continuity
Timeframe continuity is a method of market analysis where you look if multiple different timeframe charts are in the same direction.
For example:
default settings we are in bull territory when the yearly, the quarterly, the monthly and the weekly candle all are green.
default settings we are in bear territory when the yearly, the quarterly, the monthly and the weekly candle all are red.
We provided multiple presets but it is recommended to use the standard preset, timeframe continuity is the strongest when using higher timeframes.
Filter signals based on market environment
We realised that trading long or short in an environment with no resistances increased our algorithms success rate.
How the algorithm does this:
1: See which timeframes the user has selected as a filter, on default these are:
Needs to be outside timeframe 1 (yearly), false
Needs to be outside timeframe 2 (quarterly), false
Needs to be outside timeframe 3 (monthly), true
2: Check if our closing price is above those timeframes previous candle high or below previous candle low.
This in combination with timeframe continuity gives a great tool to find the sentiment of the market and trade in the direction of the market.
Turn on autopilot using our signals
This tool is not made to do all decisions for you and requires a manager (you). The basic strategy using the #thestrat preset is to scale into positions on the 4H or higher timeframe, whenever a signal is fired you add to your position and as trend keeps developing the tool will keep adding to your positions.
A good manager knows risk management and does not use a very large position size per entry and builds a position over time.
We recommend you use a timeframe of 4H or higher and diversify over multiple assets. The indicator works best on assets that overtime have created long lasting trends.
Examples of perfect coins to use this on.
We know traders love clean looking charts
This is wy we added some popular indicators to our toolkit, these you can find on tradingview for free but we added them into our toolkit using our color theme, you can find these in the settings under (extra tools).
We also added an option to display bounce source, this is the source line some of our signal presets use to find bounces from using preset bounce manager parameter.

TheStrat Reversal IndicatorThis indicator shows TheStrat 2-2 and 2-1-2 reversal setups.
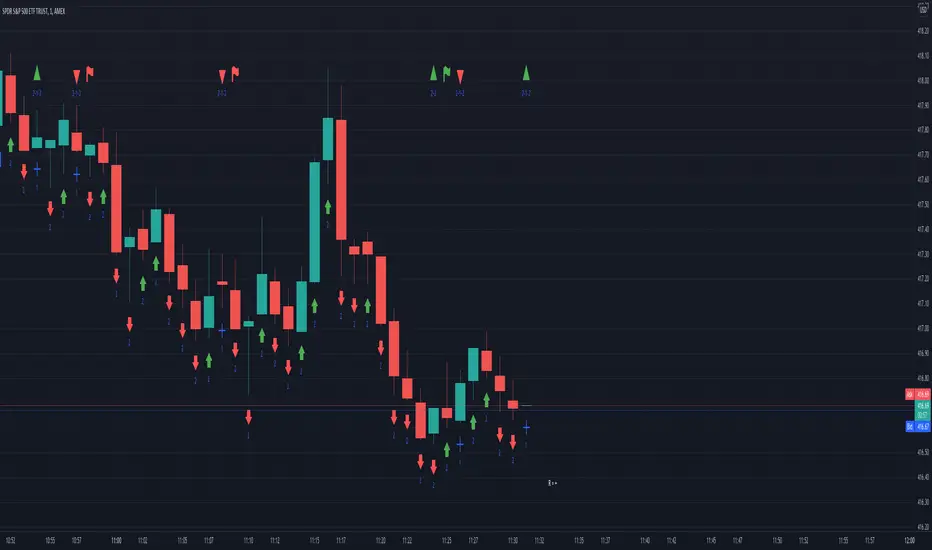
2-2 Setups: Identifies specific 2-2 reversal setups. Long 2-2 reversals are shown when there is a 2d-2d-2d green candle sequence. Short 2-2 reversals are shown when there is a 2u-2u-2u red candle sequence. Setups are marked with "2-2" and a green up triangle for long setups or a red down triangle for short setups.
2-1-2 Setups: Identifies any 2-1-2 reversal setup. Setups are marked with "2-1-2" and a green up triangle for long setups or a red down triangle for short setups.
Both setups will then show a flag indicator on the next live candle if they actually trigger.
An alert can be set that will trigger on any live setup. This alert will trigger as soon as the setup candle shows, and will not wait till that setup candle closes. This is to allow you to watch the setup complete live and then watch the trigger condition live as well. Alerts must be set for each time frame you wish to alert on.
All candles are marked with labels underneath to identify the candle type.
When there is a live setup forming there is also a R-multiple calculation shown to the right of the current candle. This R-multiple is calculated from the setup candle's high or low to the 1st target previous candle.
This indicator works on any time frame.
Previous High/Low LevelsPrevious High/Low Levels
Select 5 Custom Timeframes to display the previous High and Low levels on your chart.
NOTE: For Levels to work correctly and for price labels to be displayed, Right-click chart background -> select Settings -> select Scales -> tick “Indicator Last Value Label".
Once indicator has been added open settings and select timeframe, color, labels, offset parameters and line style as desired then SAVE.
Handy when using The Strat.

Tweak Strat FTFCThis script allows traders to view timeframe continuity on 7 timeframes at the top of the chart.
The trader selects 7 different timeframes, and the script will reflect whether the current candle for each timeframe is bullish or bearish (current price > the open OR current price < the open).
If a timeframe is currently bearish, the box will be purple.
If a timeframe is currently bullish, the box will be orange.
A circle in the middle of the box indicates that that timeframe is currently an inside bar (1).
An upward arrow indicates that that timeframe is currently a directional up bar (2u).
A downward arrow indicates that that timeframe is currently a directional down bar (2d).
A rectangle indicates that that timeframe is currently an outside bar (3).
NOTE: The color of the boxes is fixed. Traders MUST select a timeframe for EACH OF THE 7 FIELDS.
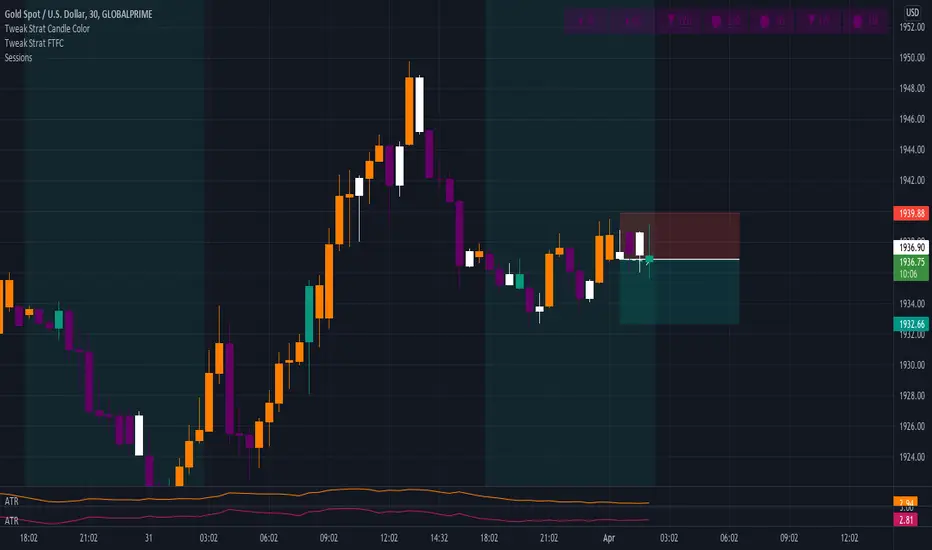
Tweak Strat Candle ColorThis script allows traders to customize candlestick colors based on The Strat trading system developed by Rob Smith.
The script determines if the current candle is an inside bar (1), outside bar (3), directional up (2u) , or directional down (2d).
An inside bar is a candle that trades fully within the previous candle.
An outside bar breaks both the high and the low of the previous candle.
A directional up bar breaks the high of the previous candle but NOT the low of the previous candle.
A directional down bar breaks the low of the previous candle but NOT the high of the previous candle.
The trader can modify the colors they wish to use in the settings menu.
NOTE: You must select "Visual order - Bring to front"
If you do not, the custom colors will disappear when you click the chart window.

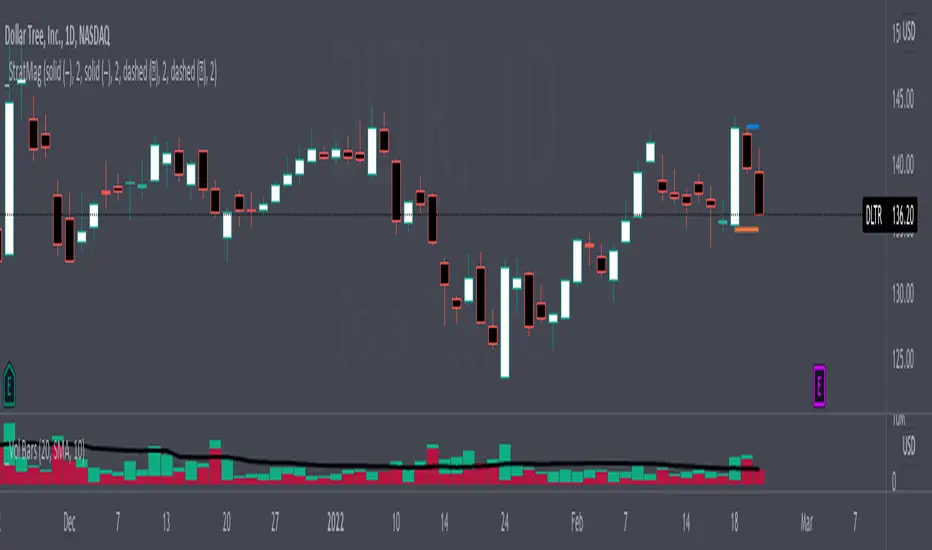
Strat Magnitude LinesHave you ever wished you could easily see the daily magnitude line of a Strat Combo while on a smaller timeframe intraday chart? This indicator allows you to do that and much more!
Description
This indicator does two simple things, but it does them very well. The first thing it does is draw a small horizontal line at the magnitude level of a Strat Setup (a potential Strat Combo before the last candle has formed) on the daily chart. This is intended to help the user easy ascertain how much magnitude distance (distance between trigger line and magnitude line) of a potential Strat Combo the night before when the user is searching for trades to play the next trading day. If the last two candles on a daily chart form the first two bars of a Strat Combo, then this indicator display a horizontal line where the ultimate magnitude would be if the next trading day a Strat Combo was formed. This helps the trader gauge whether there is sufficient magnitude that makes it worth it to even consider trading the next day.
The second and most important thing this indicator does is display the daily magnitude line while the user is in a smaller timeframe managing their trade. This helps the user have an easily identifiable line to show where to take full or partial profit at. There is no need to keep track of manually drawn lines or the hassle of letting your charts get cluttered with lines that the user forgot to delete. This indicator finds potential Strat Combos (aka Strat Setups) and dynamically draws horizontal lines for the user and removes them when they are no longer in use. The user can focus on taking profit and making money and leave the hassle to the indicator.
Inputs & Style
All four lines (two daily lines and two intraday lines) can be independently configured. Each lines color, line style, and width can be adjusted. To turn “off” a line change the opacity to 0%.
Automatic daily magnitude line on intraday chart
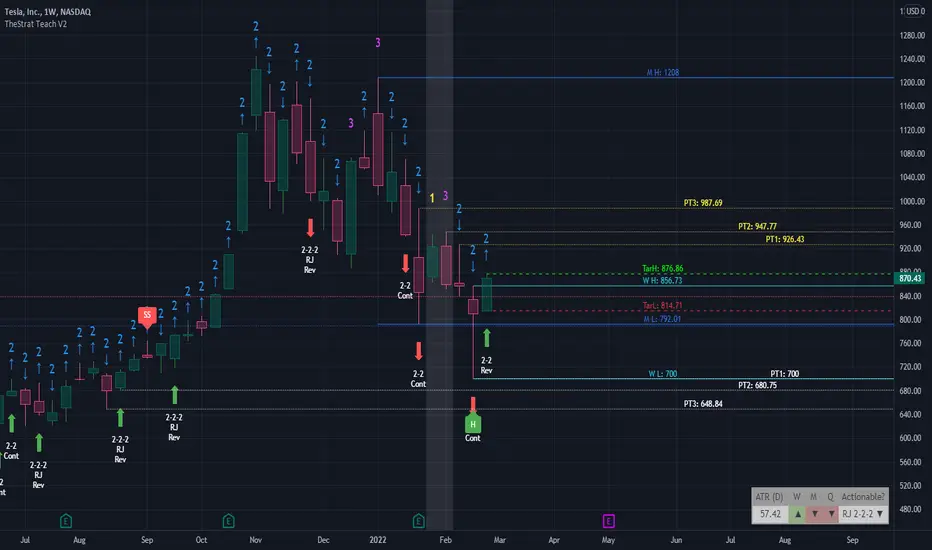
TheStrat Teach V2This indicator was coded to help me see, learn and trade TheStrat. Please share with the wider community and good luck trading. See my profile signature for contact details or questions.
// BAR NUMBERS
Using the 1, 2, 3 numbering system on the chart allows you to quickly see various combinations.
- Possibility to up/down ARROWS or the “U/D” text
- Decide which number to show and the colour
- Position and colouring are editable of numbers and bars (1, 2, 3)
- Limited to the last 100 candles for performance.
// TARGET LINES
Add target HIGH and LOW lines with custom timeframe option (default D and previous candle) to identify the target lines for long and short move.
- Possible to reposition target candle focus to previous or current candle
- Added the 50% line for visual reference or use in 0.5 retracement
- Also, possible to show both bull/bears 0.618 lines
- Ability to change all line colours and style
//HIGHER TIME FRAME
Four custom time frames can be selected to show their timeframe HIGH/LOW on lower timeframes which allows you to keep track of important price ranges on higher timeframes.
- Default to M, W, D, 1 hour including pricing labels on each HIGH/LOW line
- Able to change all line colours and styles
// TheSTRAT patterns
Once enabled it shows the various patterns historically for learning purposes to help identify the various #TheSTRAT combo or for to back test patterns.
- Patterns: 2-1-2/1-2-2/3-2-2/3-1-2/2-2-2 Randy Jackson/3-2/2-2/1-3/3-1/Pivot MG
- Added Hammers and Shooters labels
//ALERTS
Added alert conditions to setup alerts on target H/L lines and all four custom H/L lines.
- Triggers when price movement crosses above the HIGH line
- Triggers when price movement crosses below the LOW line
// INFO PANEL
The info panel is a summary information area to show Full Time Frame Continuity (FTFC) and suggests possible actionable setup on the current chart. It is possible to disable sections.
ATR(D) : shows the daily movement potential of the stock over the last 14 days
Num # : Take the percentage drawdown of portfolio size amount divided by the current stock price (15% of 5000 = 750 drawdown max)
Risk $lg : Stop loss risk amount long - shows price difference between the current candle low and previous candle low, assuming you use this for your stop loss x Num #
Risk $lg : Stop loss risk amount short - shows price difference between the current candle low and previous candle low, assuming you use this for your stop loss x Num #
H/4H/D/W/M : Full Time Continuity (FTC) to see if open is above (green) or below (red) close of current candle in that time frame
Actionable? : Suggest if current view have a possible #TheStrat actionable combo
Strat Radar_vtStrat Radar is a visual tool to trade "TheStrat" methodology.
TheStrat is a simple yet powerful model to view the market. From one bar to the next, there are only three possible scenarios or three types of candles:
type 1 - an inside bar. Market is in consolidation.
type 2 - a directional bar (2 up or 2 down). Market is trending.
type 3 - an outside bar. This is a broadening formation and market is taking liquidity from both upside and downside.
So by looking at candle type and combination, one can visualize what price is doing in the market.
Strat Radar makes it possible for user to see candle type and sequence for all major time frames – from a 5m bar to a yearly bar - all in one chart! And even better, it allows user to see not just one bar but last three bars!
Certain candle combination creates high probability trade setups, for example 2-1-2 or 2-2 reversals, so by looking at Strat Radar, user can quickly determine whether there are any good trading opportunities. The simple and visual layout makes it easy to go through a watch list and use Strat Radar as a scanner. There is no need to flip through multiple time frame charts.
Features:
Show candle type and color for twelve time frames from 5m to yearly bar
Show candle type and color for last three bars of each time frame
Location of candle number and candle color have specific meaning:
For non-directional bars ( 1 and 3):
Below candle means close > open
Above candle means close < open
For directional bar 2:
Below candle means: 2 up
Above candle means: 2 down
Candle color: green - close>open, red – close < open
A built-in trend strength system that can be turned on or off
A reversal marker that can be turned on or off. It is based on a combination of Strat candle sequence and trend strength
Since candle type and combination are clearly shown for each time frame, it is easy to determine whether is Full Time Frame Continuity (FTFC).
Strat Radar_vt is a light version of the full indicator and covers:
- most futures market
- 30 stocks in Dow Index
- Index and sector ETFs : SPY , QQQ , DIA, IWM , XLE , XLF , XLU , GDX , XLK , XLV , XLY , XLB , ITB , XRT , SMH , IBB , KRE , XLC , GDXJ , KBE
- Some key stocks: AAPL , AMZN , FB , GOOGL , TSLA , NVDA , NFLX
- Forex pairs: DXY , AUDCAD , AUDJPY , AUDNZD , AUDUSD , EURCAD , EURGBP , EURJPY , EURUSD , GBPJPY , GBPUSD , NZDUSD , USDCAD , USDJPY
Full version works on all stocks and assets. If you like this indicator and require the full version, please contact the author.

The Strat Numbers & CombosThis indicator is an all-in-one " The Strat " script. This script displays the following:
The Strat candle numbers (1's, 2's, & 3's)
The Strat Combo labels along with trigger line
Pivot Machine Gun ( PMG ) dynamic labels
Hammer & Shooter candle labels
The Strat Candle Numbers label each candle, on any timeframe, either a 1, 2, or 3. 1's are inside bars of the previous candles. 2's take out only one side of the previous candle. And 3's go outside both sides of the previous candle.
The Strat Combo labels (which are made of the 1's, 2's, 3's outlined above) display labels when a Strat Combo occurs. The script displays a label, direction arrow, and trigger line for each Strat Combo. This indicator finds the following Strat Combos:
2-1-2 bullish reversal (BLR)
2-1-2 bullish continuation (BLC)
3-1-2 BLR
3-2-2 BLR
1-2-2 rev strat BLR
2-2 BLR
2-1-2 bearish reversal (BRR)
2-1-2 bearish continuation (BRC)
3-1-2 BRR
3-2-2 BRR
1-2-2 rev strat BRR
2-2 BRR
Double inside candles
The Pivot Machine Gun (PMG) labels any 5 or more consecutive candles that make higher lows or 5 or more consecutive candles that make lower highs. A PMG can continue going in its direction or it can reverse and come back through the range. The logic in this indicator dynamically finds each level in a PMG and draws a line for easy identification.
The script also identifies if the candle type is a Hammer, Inverted Hammer, Shooting Star, or Hanging Man. These candle types are highly likely reversal points in price action.The indicator will plot a shape with a color coded icon identifying the candle. The distance between the shape and the candles can be manually adjusted in the inputs section.
This indicator has many style options . The user can independently toggle on/off the Strat numbers, boxes around the Strat Combos, and Hammer and Shooter shapes. Also all of the colors used in this script can be changed from the inputs section, so a user can easily change colors to match their current color scheme.

*SSS 50% [4/8/D/W]** SSS 50% - 4HR, 8HR, Day and Week Timeframe Edition **
This indicator is based on Sara Strat Sniper's - 50% Rule for trading Outside Bars and helps you visual the method quickly.
As per user request this indicator allows you to select: Outside 4HR, 8HR, Daily and Weekly 50% Levels with Previous High and Low Levels, available within the indicators settings.
Please note - Daily 50% warning and high/low levels are set to the indicators default. Feel free to change and save as required. Any issues let me know.
** Indicator Setup Requirements **
For Indicator to correctly display the 50% price level you need to setup your chart correctly. Right-click your chart background, select Settings, select Scales and Tick “Indicator Last Value Label". Now your 50% Price level will be displayed.

*SSS 50% [Intra]SSS 50% Rule Indicator - Intraday 5/15/30/60 Version
This indicator is based on Sara Strat Sniper's - 50% Rule for trading Outside Bars and helps you visual the method quickly.
This indicator allows you to select: Outside 5/15/30/60 minute Warning Levels with Previous High and Low Levels all available within the indicators settings.
Please note - 60 minute warning and high/low levels are set to the indicators default. Feel free to change and save as required. Any issues let me know.
** Indicator Setup Requirements **
For Indicator to correctly display the 50% price level you need to setup your chart correctly. Right-click your chart background, select Settings, select Scales and Tick “Indicator Last Value Label". Now your 50% Price level will be displayed.
Nov 30, 2021
Custom functions added as requested by users to produce cleaner charts.
H Line added for 50% level
Ability to change color for H/L Levels and Labels.
Adjust Line Width and Line Style
Adjust 50% and High/Low Label Offsets
Basic Alert Function added for 50% Level. Add Alert and Select Condition: SSS 50%, followed by your desired Outside Day Warning.
Please note alert functions have been tested and work once the current close price crosses the 50% level. Any issues please let me know and I will update when required.

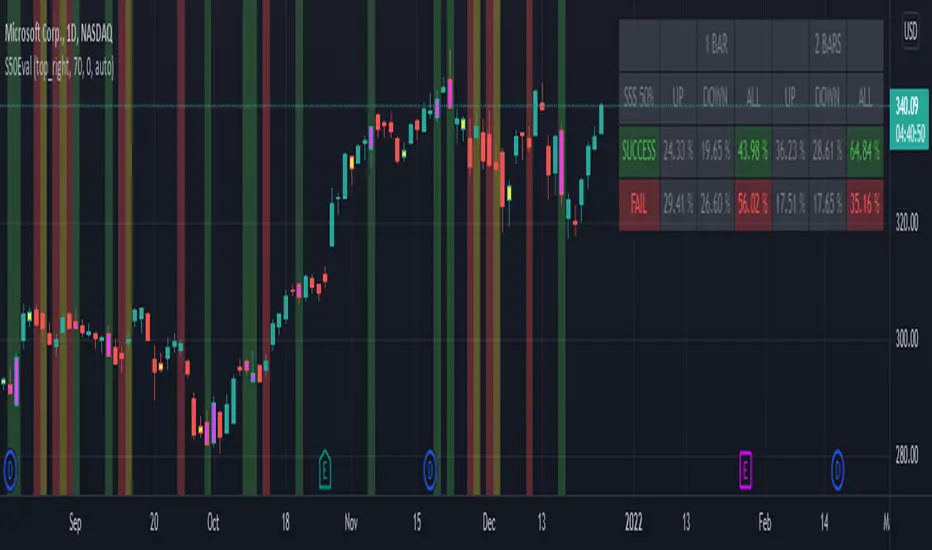
[BM] SSS 50% Rule EvaluatorSara Strat Sniper 50% Rule Evaluator
█ OVERVIEW
This indicator is based on Sara Strat Sniper's - 50% Rule for trading Outside Bars and helps you to evaluate the historical success rate of that rule.
█ FEATURES
Calculation
• You can choose to evaluate only the current bar to see if it forms an outside bar (success) or not (fail), but you can also choose to include the next bar to see if that one forms a compound outside bar.
• You can enable a start and/or end date to limit the calculation period.
Table
• Show or hide the table with the calculation results.
• Show or hide the calculation details (up/down data).
• Position of the table, opacity, cell width and text size can be customized.
Colors
• Table colors can be customized.
• You can choose to show the inside/outside bars in customizable bar colors.
• You can choose to identify successful/failed/recovered outside bars in customizable background colors.
█ LIMITATIONS
• This script uses a special characteristic of the `security()` function allowing the inspection of intrabars — which is not officially supported by TradingView.
• Intrabar inspection only works on some chart timeframes: 5, 10, 15, 30, 45 and 195 minutes, 1, 2, 3, 4, 5, 6, 7 and 8 hours, 1, 2, 3, 4 and 5 days, 1, 2, 3 and 4 weeks, 1, 2, 3, 4, 5, 6, 7, 8, 9, 10, 11 and 12 months. The script’s code can be modified to run on other resolutions.
• There is a limit to how far back intrabar calculations can be performed, and is dependant on both the intrabar resolution and your subscription (which determines the number of available bars).
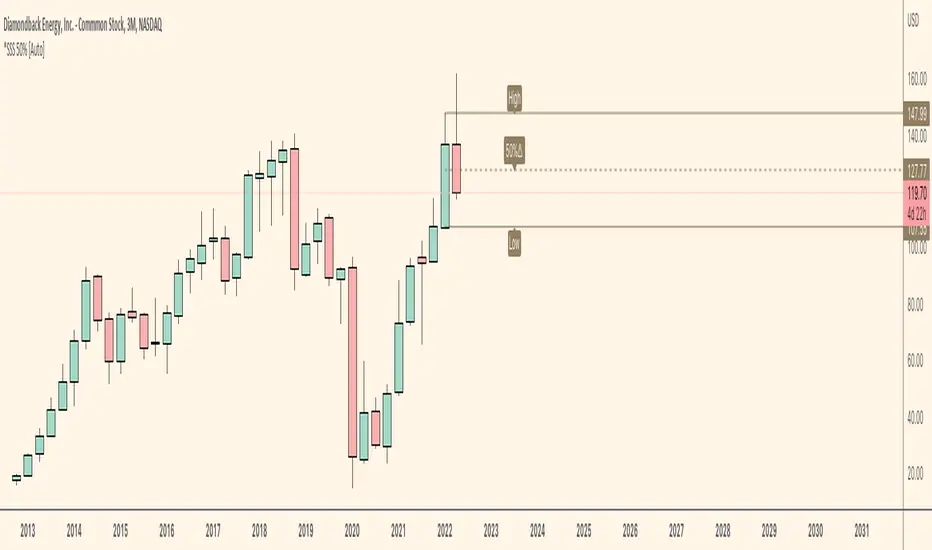
*SSS 50% [Auto]** SSS 50% - Displays Outside Warning and Previous High/Low on Current chart timeframe or Custom Timeframe Selection **
Outside Warning and Previous high/low levels default is set to the current charts timeframe.
For all Custom Timeframes, select within Indicator settings. Note this indicator is a simple version of my previous SSS Rule Indicator and HTF as this is allows for ONE Timeframe only!
This indicator is based on Sara Strat Sniper's - 50% Rule for trading Outside Bars and helps you visual the method quickly.
** Indicator Setup Requirements **
For Indicator to correctly display the 50% price level you need to setup your chart correctly. Right-click your chart background, select Settings, select Scales and Tick “Indicator Last Value Label". Now your 50% Price level will be displayed.
Known Issues:
This indicator does not work when you try to view a lower timeframes levels on a higher timeframe chart.
Example 1: Selecting Daily Warning, High and Low Levels will not be displayed correctly on a Weekly timeframe and above etc. The Daily selection however will be displayed correctly on all lower timeframes from the 1 minute chart to the Daily.
Example 2: Selecting Weekly Warning, High and Low Levels will not be displayed correctly on a Monthly timeframe and above etc. The Weekly selection however will be displayed correctly on all lower timeframes from the 1 minute chart to the Weekly. Please apply these same rules for all other timeframe indicator selections.
Monthly Warning, High and Low levels will not work correctly on a Weekly chart when the current Weekly candlestick is forming between the end of a previous Month and start of new Month. Once the first Weekly candle of a new Month closes the Monthly levels will now be displayed correctly. Please note, selecting the Monthly levels when viewing a Monthly chart will work as normal and Monthly levels displayed on a Weekly chart will be corrected once the first Weeks candle has closed. I believe this error is caused by a pine script repainting issue when assessing historical price data which is out of my limited scripting brains control.
*SSS 50% HTF** SSS 50% - HTF (Higher Timeframe) -D/W/M/Q Edition **
This indicator is based on Sara Strat Sniper's - 50% Rule for trading Outside Bars and helps you visual the method quickly.
This indicator allows you to select: Outside: Day/Week/Month/Quarter Warning Levels with Previous High and Low Levels available within the indicators settings.
Please note - Daily warning and high/low levels are set to the indicators default. Feel free to change and save as required. Any issues let me know. See known issues below.
** Indicator Setup Requirements **
For Indicator to correctly display the 50% price level you need to setup your chart correctly. Right-click your chart background, select Settings, select Scales and Tick “Indicator Last Value Label". Now your 50% Price level will be displayed.
Known Issues:
This indicator does not work when you try to view a lower timeframes levels on a higher timeframe chart.
Example 1: Selecting Daily Warning, High and Low Levels will not be displayed correctly on a Weekly timeframe and above etc. The Daily selection however will be displayed correctly on all lower timeframes from the 1 minute chart to the Daily.
Example 2: Selecting Weekly Warning, High and Low Levels will not be displayed correctly on a Monthly timeframe and above etc. The Weekly selection however will be displayed correctly on all lower timeframes from the 1 minute chart to the Weekly. Please apply these same rules for all other timeframe indicator selections.
Monthly Warning, High and Low levels will not work correctly on a Weekly chart when the current Weekly candlestick is forming between the end of a previous Month and start of new Month. Once the first Weekly candle of a new Month closes the Monthly levels will now be displayed correctly. Please note, selecting the Monthly levels when viewing a Monthly chart will work as normal and Monthly levels displayed on a Weekly chart will be corrected once the first Weeks candle has closed. I believe this error is caused by a pine script repainting issue when assessing historical price data which is out of my limited scripting brains control.

*SSS 50% Rule IndicatorThis indicator is based on Sara Strat Sniper's - 50% Rule for trading Outside Bars and helps you visual the method quickly.
This indicator allows you to select: Outside Day/Week/Month Warning Levels with Previous High and Low Levels all available within the indicators settings.
Please note - Daily warning and high/low levels are set to the indicators default. Feel free to change and save as required. Any issues let me know.
** Indicator Setup Requirements **
For Indicator to correctly display the 50% price level you need to setup your chart correctly. Right-click your chart background, select Settings, select Scales and Tick “Indicator Last Value Label". Now your 50% Price level will be displayed.

RM Timeframe ContinuityThis indicator plots a table off to the right of the chart to help with determining timeframe continuity. Per the Strat, a great edge is only taking trades where full timeframe continuity is in place (i.e. if you are going long, make sure other timeframes are also green).
In this script:
Green candles have green colored boxes, red candles have red colored boxes.
Inside bars are represented by a circle - ⬤
Outside bars are represented by a tall rectangle - ▮
2-up bars are indicated by an up arrow - ▲
2-down bars are indicated by a down arrow - ▼
User defined options:
Pick any timeframe for the 4 boxes
Choose whether to plot the highs/lows of the larger timeframe candles as horizontal rays on your chart (along with the associated colors)

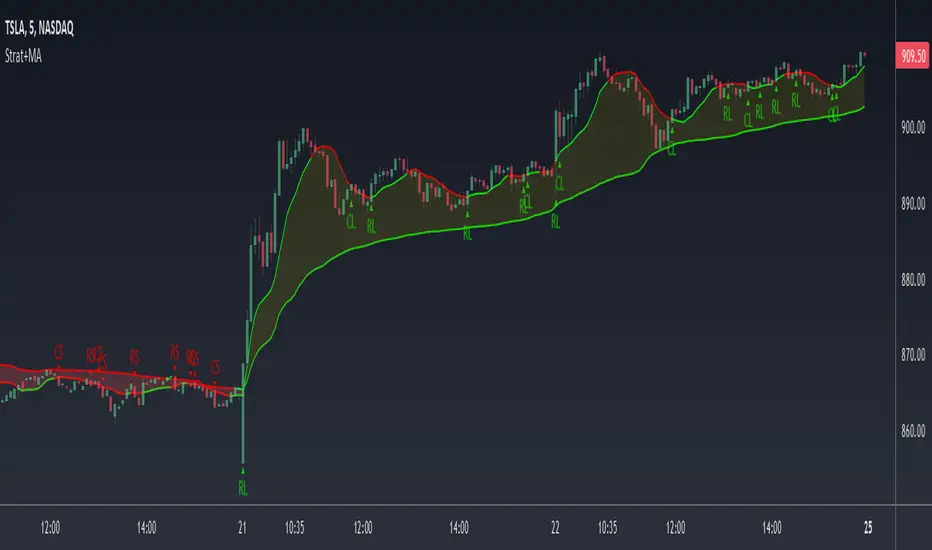
Strat+MA1= Inside Candle
2= One side, high or low of the previous candle is taken out
3= Engulfing Candle/Outside Candle. i.e. both sides of the previous candle are taken out
Enter any 2 moving averages.
Shows Strat setups(reversals/continuations) or when candles are above MA 1 and crosses MA 2
Choose between SMA, EMA or VWMA
Strat Setups: 22, 212, 312, etc.
RL = Reversal Long
CL = Continuation Long
RS = Reversal Short
CL = Continuation Short
L = Candle is above MA1 and has crossed above MA2
S = Candle is below MA1 and has crossed below MA2
Reversals Long(RL):
22 = last candle 2 down. current candle 2 up
212 = 3rd candle 2 down, last candle inside and current candle 2 up
312 = 3rd candle outside candle, last candle inside and current 2 up
Continuations Long(CL):
22 = last candle 2 up, current candle 2 up
212 = 3rd candle 2 up, last candle inside and current candle 2 up
312 = 3rd candle outside candle, last candle inside and current 2 up
Reversals Short(RS):
22 = last candle 2 up. current candle 2 down
212 = 3rd candle 2 up, last candle inside and current candle 2 down
312 = 3rd candle outside candle, last candle inside and current 2 down
Continuations ShortCS):
22 = last candle 2 down, current candle 2 down
212 = 3rd candle 2 down, last candle inside and current candle 2 down
312 = 3rd candle outside candle, last candle inside and current 2 down
You can choose to have the strat setups shown or just when the candles are above MA1 and cross MA2
When MA2 is above MA1, the fill is green and red when MA2 is below MA1
TheStratFTFCBased on Rob Smith's TheStrat, indicates full time frame continuity
Will plot an indicator for all timeframes from 1 min up to 1 year with triangles to signify if the current price is above or below the open of that timeframe.
When all timeframes are above their respective opens, the FTFC will indicate a green up triangle
When all timeframes are below their respective opens, the FTFC will indicate a red down triangle
There are also indicators for Intraday, Swing, and Long Term FTFC
Intraday timeframes include 1 min to 1 hour
Swing timeframes include 1 hour to 1 month, on by default
Long Term time frames include 1 week to 1 year
There is an option to plot horizontal lines or show prices where the above 3 will become FTFC either red or green
Option to flip the order of the indicators and move them horizontally on the screen
On the settings > style tab, you can deselect timeframes you wish to hide
Limitations of script (due to pinescript):
Only the timeframes higher than or equal to the one shown on the chart will be included in the indicators. Pinescript does not allow indicators to use timeframes below the current chart's timeframe.
eg. the Intraday Timeframe FTFC indicator will show FTFC (green up triangle) if the chart is on the 1 hour timeframe and the close is above the hourly open EVEN IF the 15 minute price is below the 15 min open
- essentially, if you want to exclude timeframes, pick the lowest timeframe where you want the FTFC indicator to work
Any questions, let me know!
gkjch
