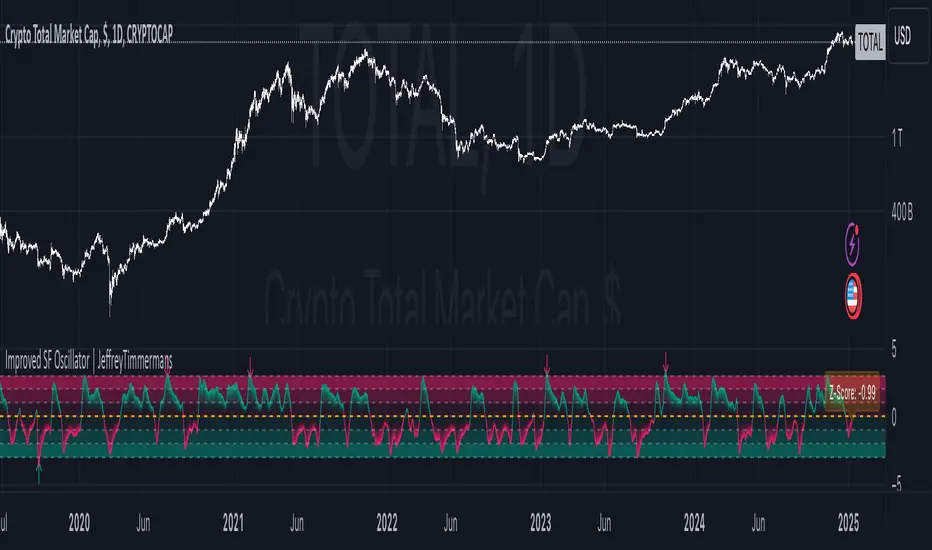
Improved SF Oscillator | JeffreyTimmermansImproved SF Oscillator
The "Improved SF Oscillator" is an advanced and versatile technical indicator designed to transform any moving average (MA) into a dynamic oscillator. This cutting-edge tool incorporates up to 13 different moving average types, including specialized indicators like Kaufman’s Adaptive Moving Average (KAMA), Tillson's Exponential Moving Average (T3), and the Arnaud Legoux Moving Average (ALMA). The oscillator offers traders a powerful tool for both trend-following and mean reversion strategies, significantly enhancing their ability to analyze market movements, identify potential entry and exit points, and make informed trading decisions.
This script is inspired by "EliCobra" . However, it is more advanced and includes additional features and options.
Core Functionality and Methodology
The Improved SF Oscillator leverages user-defined parameters to calculate the selected moving average type. Key inputs, such as the length of the MA and smoothing factors, offer traders extensive customization. Additionally, the indicator utilizes a unique process of deriving both the mean and standard deviation of the moving average over a defined normalization period. This method is crucial for normalizing the moving average and standardizing its behavior. The final step in this calculation involves deriving the Z-Score, which is computed by subtracting the moving average's mean from its current value and then dividing the result by the standard deviation.
This normalization allows the oscillator to display a standardized value that highlights the relative position of the moving average, offering a clear view of market volatility and potential trend shifts. By incorporating this statistical approach, the Improved SF Oscillator helps traders assess price behavior in relation to its typical fluctuations, providing vital insight into whether the price is overbought, oversold, or near a turning point.
The Moving Average Types
One of the standout features of the Improved SF Oscillator is its support for a wide variety of moving average types. Each MA type has its own unique methodology and behavior, allowing traders to choose the best fit for their trading strategy:
KAMA (Kaufman’s Adaptive Moving Average):
KAMA is designed to adapt its smoothing period dynamically based on market volatility. When market conditions are more volatile, KAMA responds quickly, while during calmer periods, it smooths price action more effectively. This characteristic allows KAMA to capture trends with minimal noise, providing traders with a smoother and more adaptive moving average.
T3 (Tillson's Exponential Moving Average):
The T3 MA is a refined version of the traditional EMA. By applying additional smoothing to the moving average, it significantly reduces lag and increases responsiveness. This allows traders to capture trends more accurately while maintaining the benefit of smooth price tracking.
ALMA (Arnaud Legoux Moving Average):
ALMA combines both linear regression and exponential smoothing techniques. Its unique formula allows for reduced lag and noise, providing a smoother representation of price trends. ALMA is particularly useful in detecting trend changes and is highly favored for its precision and ability to identify entry and exit points with minimal delay.
Z-Score and Normalization
The Z-Score is central to the functionality of the Improved SF Oscillator. By calculating the standard deviation and mean of the moving average over a defined period, the Z-Score standardizes the values of the MA. This transformation allows traders to assess the relative position of price in terms of how far it deviates from its mean, taking market volatility into account.
The Z-Score provides the following key benefits:
Overbought/Oversold Conditions: By assessing the Z-Score, traders can identify whether the price is approaching overbought or oversold conditions. Extreme positive or negative Z-Score values indicate potential reversals.
Volatility Adjustments: The Z-Score allows traders to understand market volatility in a normalized way, facilitating more accurate readings of price movements in relation to their typical behavior.
Enhanced Utility and Features
The Improved SF Oscillator is built for use in both trend-following and mean-reversion strategies. Traders can analyze the position of the oscillator relative to its midline to confirm trends. The oscillator’s deviation from the midline can indicate potential reversals, while extreme values can serve as signals for mean-reversion trades.
Additional features include:
Custom Alerts: The Improved SF Oscillator comes with real-time alerts for significant events such as trend reversals or when the oscillator crosses important thresholds. Traders can set alerts for when the oscillator exceeds a specified Z-Score, signaling overbought or oversold conditions.
Reversal Bubbles: To further aid in identifying turning points, the oscillator provides visually distinctive bubbles on the chart that highlight potential reversal points. These bubbles mark instances when the oscillator reaches an extreme value and then begins to reverse, offering valuable signals for potential entry or exit points.
Bar Coloring Options: The oscillator features a variety of bar coloring options, including:
Trend (Midline Cross): Bar colors change when the oscillator crosses its midline, signaling potential shifts in market momentum.
Extremities: Bars are colored based on extreme values, helping traders quickly identify periods of high volatility or potential trend reversals.
Reversions: Bar colors change when reversal conditions are met, such as when the oscillator shows signs of turning from overbought to oversold or vice versa.
Slope: Bars are colored based on the slope of the oscillator, providing insights into the underlying momentum of the market.
Recent Improvements and Features
After its initial release, the Improved SF Oscillator underwent several significant updates aimed at enhancing its usability and providing traders with more advanced tools:
Reversal Point Alerts: The addition of alerts for potential reversal points adds a crucial layer of functionality. These alerts notify traders in real time when the oscillator signals an overbought or oversold condition, or when it reaches a reversal point that could mark a shift in market direction.
Dashboard Integration: A dashboard feature was introduced to provide an overview of the oscillator’s readings. This allows traders to quickly assess the market conditions and oscillator behavior across multiple timeframes or instruments, ensuring that they are always aware of potential opportunities or risks.
Visual Enhancements: Several visual improvements were made to the bar coloring system, making it easier for traders to quickly interpret market conditions at a glance. The addition of customized bar color schemes for trends, extremes, and slopes helps traders make faster decisions based on clear visual cues.
Revised Inputs and Customization: The user interface was improved to offer more flexibility in customizing the indicator’s inputs. Traders can now fine-tune the oscillator's behavior to match their trading style, adjusting factors such as the length of the moving average, the type of smoothing, and the threshold values for overbought and oversold conditions.
Use Cases and Practical Application
The Improved SF Oscillator is ideal for a wide range of trading strategies, from long-term trend-following techniques to short-term mean-reversion approaches. Here are some practical use cases:
Trend Confirmation: Traders can use the oscillator to confirm existing trends. When the oscillator is above the midline and moving upward, it may confirm a bullish trend. Similarly, a downward slope below the midline may indicate a bearish trend.
Mean Reversion Trading: By observing the oscillator’s movement beyond certain Z-Score thresholds, traders can identify potential mean-reversion opportunities. Extreme readings above or below the midline signal that price may be ready to revert to its average.
Reversal Detection: The reversal bubbles and alerts provide early warnings of potential trend reversals, making the Improved SF Oscillator an effective tool for spotting turning points before they fully manifest.
Volatility Assessment: The Z-Score and different MA types allow traders to assess market volatility, adjusting their trading approach based on the current market conditions. For instance, during periods of low volatility, slower MAs like KAMA may be more suitable, while during high volatility, faster MAs like T3 or ALMA can offer more responsiveness.
Key Features Recap
13 moving average types to suit different market conditions and trading strategies.
Z-Score normalization for accurate assessments of market volatility and overbought/oversold conditions.
Alerts for reversal points, extreme Z-Score values, and trend changes.
Dashboard to monitor oscillator values and conditions across timeframes and instruments.
Reversal point bubbles to visually highlight potential turning points.
Customizable bar coloring for trend, extremity, reversal, and slope visualization.
The Improved SF Oscillator offers a comprehensive, flexible, and user-friendly tool for traders looking to enhance their analysis and make better-informed decisions in a constantly evolving market. Whether used for trend-following, mean-reversion, or volatility analysis, this indicator is designed to provide valuable insights that can help traders navigate even the most challenging market conditions.
-Jeffrey
Tillson
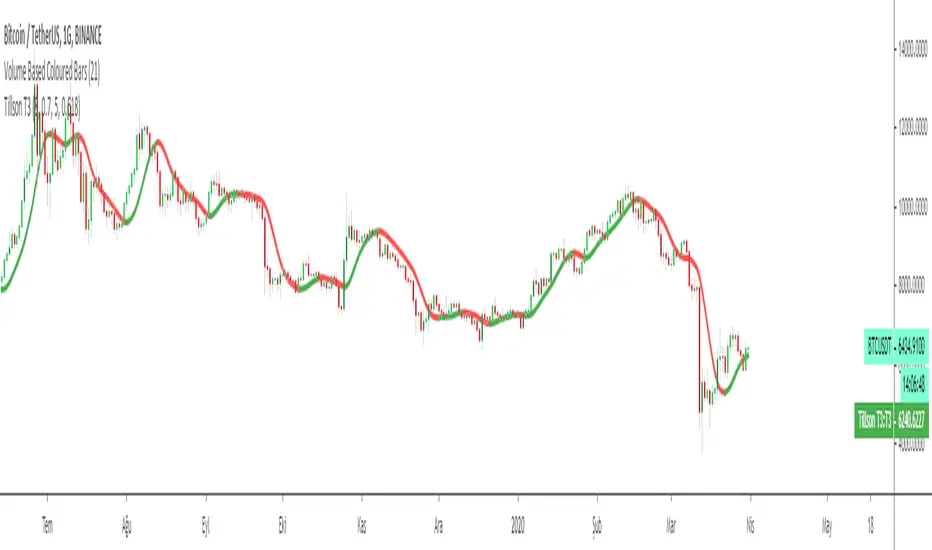
Tillson T3 Moving Average - ScreenerScreener version of Tillson T3 Moving Average:
The T3 Moving Average generally produces entry signals similar to other moving averages and, thus, is mainly traded in the same manner. Here are several assumptions:
Suppose the price action is above the T3 Moving Average, and the indicator is upward. In that case, we have a bullish trend and should only enter long trades (advisable for novice/intermediate traders). If the price is below the T3 Moving Average and edging lower, we have a bearish trend and should limit entries to short.
About Screener Panel:
Users can explore 20 different and user-defined tickers, which can be changed from the SETTINGS (shares, crypto, commodities...) on this screener version.
The screener panel shows up right after the bars on the right side of the chart.
Tickers seen in green are the ones that are in an uptrend, according to T3.
The ones that appear in red are those in the SELL signal, in a downtrend.
The numbers in front of each Ticker indicate how many bars passed after the last BUY or SELL signal of T3.
For example, according to the indicator, when BTCUSDT appears (3) in GREEN, Bitcoin switched to a BUY signal 3 bars ago.
-In this screener version of Tillson T3 Moving Average, users can define the number of demanded tickers (symbols) from 1 to 20 by checking the relevant boxes on the settings tab.
-All selected tickers can be screened in different timeframes.
-Also, different timeframes of the same Ticker can be screened.
IMPORTANT NOTICE:
Screener shows the results in 2 different logic:
-Screener shows the information about the color changes of the T3 Moving Average with default settings.
-Users can check the "Change Screener to show T3 & Price Flips" button to activate the screener giving information about price flips.
If this option is preferred, users are advised to enlarge the length to have better signals.

AIR Supertrend (Average Interpercentile Range)Supertrend (ST) is a popular stop loss and trend identification script. The simplicity of seeing a clean trend on a chart makes it attractive, yet it is restricted by only allowing the source, length and multiplier to be adjusted, & these tend to have a limited effect on the properties of the identified trend.
There is a wide variety of interesting ST scripts on TradingView that give the user more control, but none to my knowledge, based on measuring the statistical dispersion of Average Interpercentile Range (AIR).
Two more levels of control:
Normally, ATR Average True Range is used to calculate the range in ST. ATR is initially calculated using RMA to smooth out True Range. This script gives the user the option of changing the MA to some more interesting varieties & modifying their parameters.
The default range setting when you load the indicator on a chart will be AIR.
The real strength of the indicator, however, and the reason I am publishing it, is to release AIR. Play round with the percentile range setting. Lowering it will allow you to stay longer in a trade in a volatile market. Raising it will make it tighter.
For comparison, you can switch back the range setting to ATR and load up RMA to see how the original, classic ST plots.
Alerts are included in this version. Alway use a stop loss.
DISCLAIMER: None of this is financial advice.
Credits to these authors, whose hard work inspired parts of this script:
@ KivancOzbilgic - SuperTrend
@ KioseffTrading - Tillson T3 MA
@ cheatcountry - Hann Window Smoothing
@ mutantdog - Interquartile Range function in his 'Blaze' script

Ichimoku VariationsThe Ichimoku cloud is traditionally constructed from the highest high and lowest low for a number of periods. This script allows for it to be transformed and calculated like more traditional moving averages (e.g. simple moving average, exponential moving average). Since the Ichimoku is normally a system of moving average-like lines, maybe someone out there will learn something from being able to switch to sma, ema, etc etc.
In general, I think no TA indicator is a magic bullet, and you should just use what you like!
Credit: This script utilizes the "Color Gradient Framework" tutorial by LucF (PineCoders) to create gradient visuals, which are also customizable for the user.
Recommended modes:
default
SMA
EMA
SMMA
WMA
VWMA
Tillson T3
Not Recommended (These moving averages are too fast, and probably will require adjusting settings to something like the 20-60-120-30 to make more sense):
HMA
EHMA
TEMA
ALMA
LSMA

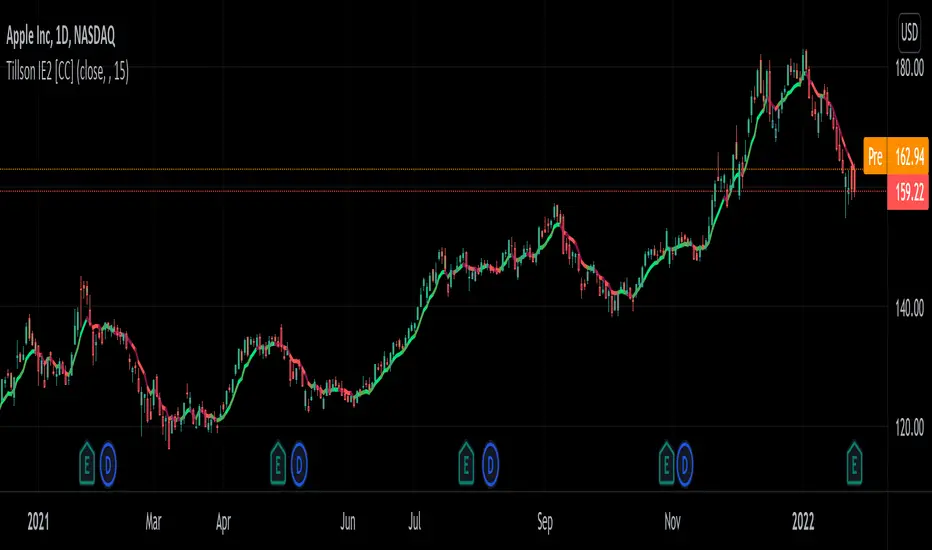
Tillson IE/2 [CC]The IE/2 was created by Tim Tillson (Stocks and Commodities Jan 1998) and this is a practically undiscovered gem because in that same article he goes on to to create the popular T3 moving average and the GDEma but practically no one seemed to notice the IE2 or maybe it is just my imagination. Anyway this indicator name is short for Integral of Linear Regression Slope + Endpoint Moving Average / 2 so you can why it was shortened to IE/2. Like the name implies this takes two variations of smoothing that complement each other and averages them together to in theory get the benefits of each. The EPMA is much noiser but follows the data more closely and the complete opposite for the ILRS so you can see the idea in action. Like all of my indicators I include strong buy and sell signals in addition to normal ones so strong signals are darker in color and normal signals are lighter in color. Buy when the line turns green and sell when it turns red.
Let me know if there are any other indicators or scripts you would like to see me publish!
Bollinger Bands With User Selectable MABollinger Bands with user selection options to calculate the moving average basis and bands from a variety of different moving averages.
The user selects their choice of moving average, and the bands automatically adjust. The user may select a MA that reacts faster to volatility or slower/smoother.
Added additional options to color the bands or basis based on the current trend and alternate candle colors for band touches. Options:
REACT SLOW/SMOOTH TO VOLATILITY
simple moving average (Regular Bollinger Bands)
REACT SMOOTH TO VOLATILITY
exponential moving average (EMA Bollinger Bands)
weighted moving average (Weighted MA Bollinger Bands)
exponential hull moving average (Hull Bollinger Bands with better smoothing)
HIGHLY ADJUSTABLE TO VOLATILITY
Arnaud Legoux Moving average (ALMA Bollinger Bands)
Note: 0.85 ALMA default for more smoothing, set offset=1 to turn off smoothing
REACT HARSH TO VOLATILITY
least squares moving average (Least Squares Bollinger Bands)
REACT VERY FAST TO VOLATILITY
hull moving average (Hull Bollinger Bands or Hullinger Bands)
VALUE ADDED: This script is unique in that no other Bollinger Bands indicator offers a user selection for moving average, and some of the options do not exist yet as Bollinger Bands indicators.
Definitions:
Bollinger Bands: A Bollinger Band® is a technical analysis tool defined by a set of trendlines plotted two standard deviations (positively and negatively) away from a simple moving average (SMA) of a security's price, but which can be adjusted to user preferences.
Exponential Bollinger Bands: The most important characteristics of the Exponential Bollinger Bands indicator are: When the market is flat, the bands will stay much closer to prices. When the volatility is high, the bands move away from prices faster.
Hull Bollinger Bands: Bollinger Bands calculated by Hull moving average, rather than simple moving average or ema. The Hull Moving Average (HMA), developed by Alan Hull, is an extremely fast and smooth moving average. In fact, the HMA almost eliminates lag altogether and manages to improve smoothing at the same time.
Exponential Hull Bollinger Bands: Bollinger Bands calculated by Exponential Hull moving average, rather than simple moving average or ema. The Exponential Hull Moving Average is similar to the standard Hull MA, but with superior smoothing. The standard Hull Moving Average is derived from the weighted moving average (WMA). As other moving average built from weighted moving averages it has a tendency to exaggerate price movement.
Weighted Moving Average Bollinger Bands: A Weighted Moving Average (WMA) is similar to the simple moving average (SMA), except the WMA adds significance to more recent data points.
Arnaud Legoux Moving Average Bollinger Bands: ALMA removes small price fluctuations and enhances the trend by applying a moving average twice, once from left to right, and once from right to left. At the end of this process the phase shift (price lag) commonly associated with moving averages is significantly reduced. Zero-phase digital filtering reduces noise in the signal. Conventional filtering reduces noise in the signal, but adds a delay.
Least Squares Bollinger Bands: The indicator is based on sum of least squares method to find a straight line that best fits data for the selected period. The end point of the line is plotted and the process is repeated on each succeeding period.

MAVC: Moving Averages Combo by Mehmet YildizliMAVC: Moving Averages Combo by Mehmet Yildizli
==========================================
You can use this indicator to add more than one moving average on the same chart. At the beginning of the indicator settings, the "Volume For Tillson" parameter is used only when you select the Tillson moving average.
When you check the "Use (high + low + 2 * close) / 4" checkbox, this value is used as the source data to be included in the calculations of all moving averages. When you clear this check box, calculations are made according to the selection you make in the SOURCE section.
You can add 4 moving averages at the same time to the chart.
You can choose a different period and a different calculation method for each moving average.
In this way, you can make a buying / selling decision by considering the relative positions of more than one moving average.
The risks you may be exposed to as a result of your transactions will be entirely at your own risk, as the buy / sell signals you will receive through this indicator will be revealed by your interpretation of the curves that will emerge according to the parameters and calculation methods you choose.
Moving Average Calculation Methods:
1. "S: Simple": Simple Moving Average (SMA)
2. "E: Exponential": Exponential Moving Average (EMA)
3. "DE: Double Exponential": Double Exponential Moving Average (DEMA)
4. "W: Weighted": Weighted Moving Average (WMA)
5. "VIDYA 1: VIDYA via St Dev": Variable Index Dynamic Average - by standard deviation (VIDYA)
6. "VIDYA 2: VIDYA via CMO": Variable Index Dynamic Average - via CMO (VIDYA)
7. "T: Tillson": Tillson - T3
8. "RMA: Running Mov Av": Running Moving Average (RMA)
Hope you will benefit from the indicator.
TÜRKÇE AÇIKLAMA
=================
MAVC: Moving Averages Combo by Mehmet Yildizli
==========================================
Bu indikatör ile birden fazla hareketli ortalamayı aynı grafik üzerine ekleyebilirsiniz. İndikatör ayarlarının başında, "Volume For Tillson" parametresi sadece Tillson hareketli ortalama seçimi yaptığınız zaman kullanılmaktadır.
"Use (high+low+2*close)/4" onay kutusunu onayladığınızda ise, bütün hareketli ortalamaların hesaplamalarına dahil edilecek kaynak veri olarak bu değer kullanılır. Bu onay kutusundaki onayı kaldırdığınızda ise KAYNAK kısmında yapacağınız seçime göre hesaplamalar yapılır.
Aynı anda 4 hareketli ortalamayı grafiğe ekleyebilirsiniz.
Her hareketli ortalama için farklı bir periyot ve farklı bir hesaplama yöntemi seçimi yapabilirsiniz.
Bu şekilde birden fazla hareketli ortalamanın birbirine göre durumlarını dikkate alarak alış/satış kararı verebilirsiniz.
Bu indikatör yoluyla alacağınız alış/satış sinyalleri, tamamen sizin belirleyeceğiniz parametre ve seçtiğiniz hesaplama yöntemlerine göre ortaya çıkacak eğrilerin sizin tarafınızdan yorumlanarak ortaya çıkacağı için işlemleriniz sonucunda maruz kalabileceğiniz riskler tamamen size ait olacaktır.
Hareketli Ortalama Hesaplama Yöntemleri:
1. "S:Simple" : Basit Hareketli Ortalama (SMA)
2. "E:Exponential" :Üstel Hareketli Ortalama (EMA)
3. "DE:Double Exponential": İkili Üstel Hareketli Ortalama (DEMA)
4. "W:Weighted": Ağırlıklı Hareketli Ortalama (WMA)
5. "VIDYA 1: VIDYA via St Dev": Değişken Hareketli Ortalama - standart sapma yoluyla (VIDYA)
6. "VIDYA 2: VIDYA via CMO": Değişken Hareketli Ortalama - CMO yoluyla (VIDYA)
7. "T:Tillson": Tillson - T3
8. "RMA:Running Mov Av": Running Moving Average (RMA)
İndikatörden faydalanmanız dileğiyle.

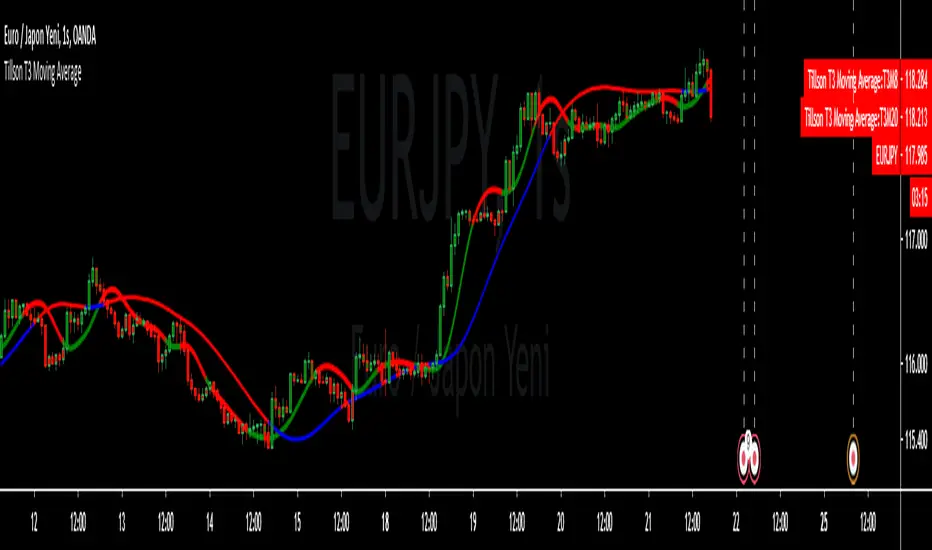
Tillson T3 Moving Average MTFMULTIPLE TIME FRAME version of Tillson T3 Moving Average Indicator
Developed by Tim Tillson, the T3 Moving Average is considered superior -1.60% to traditional moving averages as it is smoother, more responsive and thus performs better in ranging market conditions as well. However, it bears the disadvantage of overshooting the price as it attempts to realign itself to current market conditions.
It incorporates a smoothing technique which allows it to plot curves more gradual than ordinary moving averages and with a smaller lag. Its smoothness is derived from the fact that it is a weighted sum of a single EMA , double EMA , triple EMA and so on. When a trend is formed, the price action will stay above or below the trend during most of its progression and will hardly be touched by any swings. Thus, a confirmed penetration of the T3 MA and the lack of a following reversal often indicates the end of a trend.
The T3 Moving Average generally produces entry signals similar to other moving averages and thus is traded largely in the same manner. Here are several assumptions:
If the price action is above the T3 Moving Average and the indicator is headed upward, then we have a bullish trend and should only enter long trades (advisable for novice/intermediate traders). If the price is below the T3 Moving Average and it is edging lower, then we have a bearish trend and should limit entries to short. Below you can see it visualized in a trading platform.
Although the T3 MA is considered as one of the best swing following indicators that can be used on all time frames and in any market, it is still not advisable for novice/intermediate traders to increase their risk level and enter the market during trading ranges (especially tight ones). Thus, for the purposes of this article we will limit our entry signals only to such in trending conditions.
Once the market is displaying trending behavior, we can place with-trend entry orders as soon as the price pulls back to the moving average (undershooting or overshooting it will also work). As we know, moving averages are strong resistance/support levels, thus the price is more likely to rebound from them and resume its with-trend direction instead of penetrating it and reversing the trend.
And so, in a bull trend, if the market pulls back to the moving average, we can fairly safely assume that it will bounce off the T3 MA and resume upward momentum, thus we can go long. The same logic is in force during a bearish trend .
And last but not least, the T3 Moving Average can be used to generate entry signals upon crossing with another T3 MA with a longer trackback period (just like any other moving average crossover). When the fast T3 crosses the slower one from below and edges higher, this is called a Golden Cross and produces a bullish entry signal. When the faster T3 crosses the slower one from above and declines further, the scenario is called a Death Cross and signifies bearish conditions.
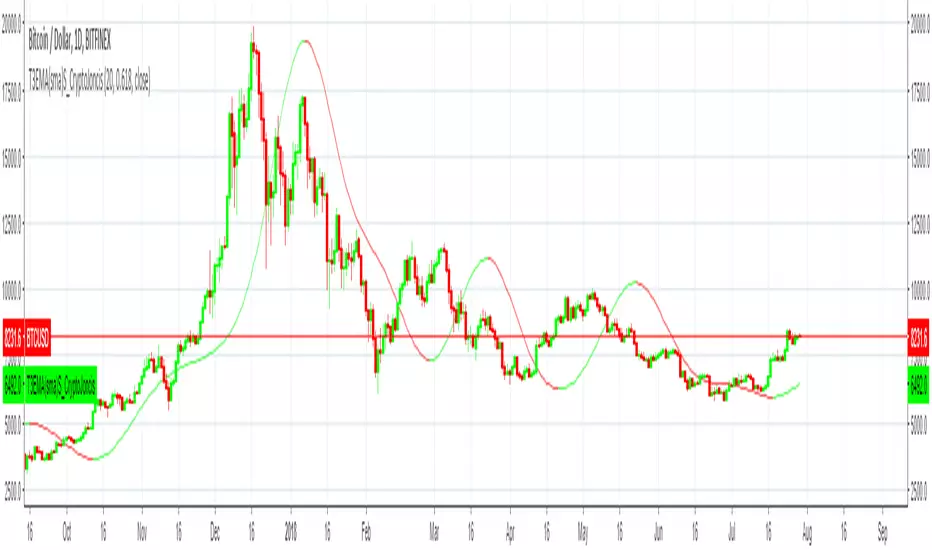
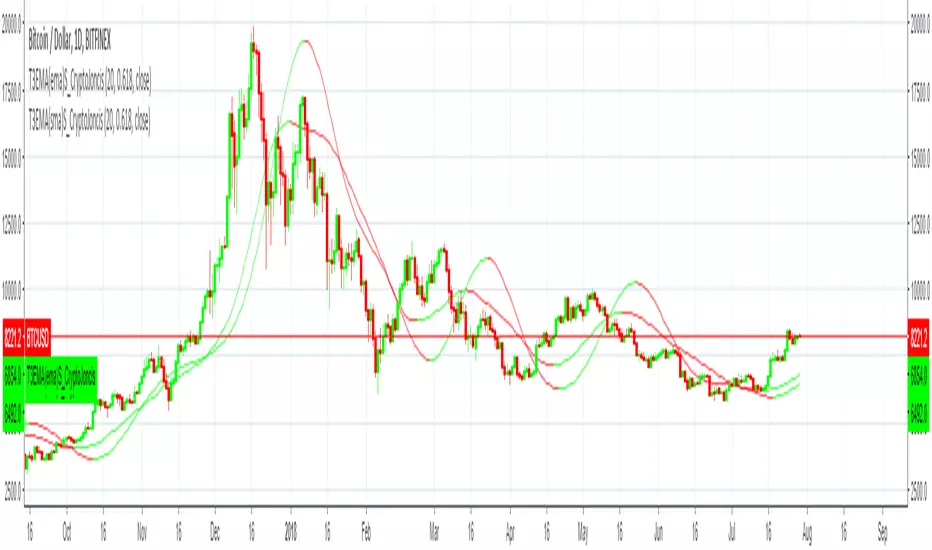
I Personally added a second T3 line with a volume factor of 0.618 (Fibonacci Ratio) and length of 3 (fibonacci number) which can be added by selecting the box in the input section. traders can combine the two lines to have Buy/Sell signals from the crosses.
Developed by Tim Tillson

Tillson Moving Average(sma) TENT3 Moving Average indicator was originally developed by Tim Tillson in 1998/99.
T3 Moving Average is considered as improved and better to traditional moving averages as it is smoother and performs better in trending market conditions.
It offers multiple opportunities when the price is in the state of retracement and therefore allows to minimize your exposed risk and allowing your profits run.
This version provides T3 MA
Source options - all standard + HA
T3 based on 6x sma
Adds up to 10 T3 MA with sma on chart
Consider a tip in ETH to
0xac290B4A721f5ef75b0971F1102e01E1942A4578
Thank you and have a nice day
CryptoJoncis

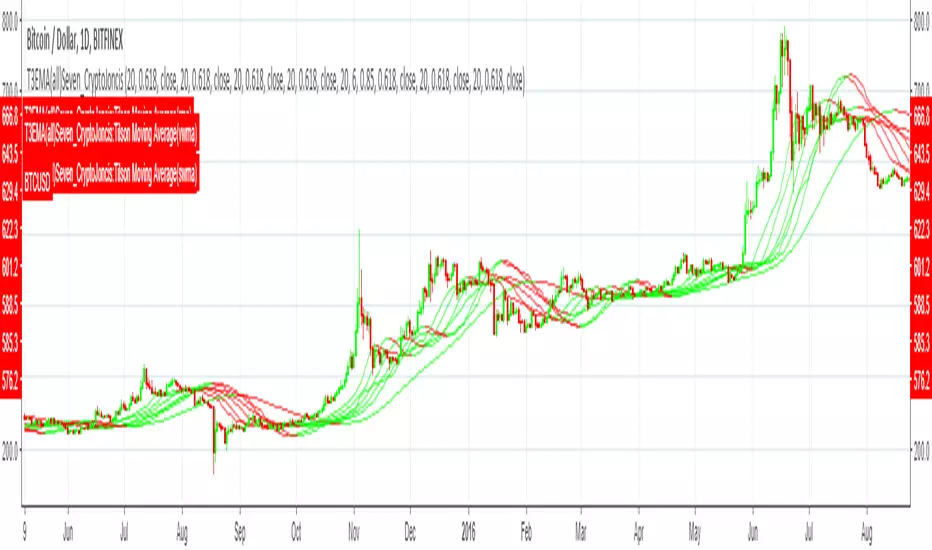
Tillson Moving Average(all_basic) SevenT3 Moving Average indicator was originally developed by Tim Tillson in 1998/99.
T3 Moving Average is considered as improved and better to traditional moving averages as it is smoother and performs better in trending market conditions.
It offers multiple opportunities when the price is in the state of retracement and therefore allows to minimize your exposed risk and allowing your profits run.
This version provides T3 MA
Source options - all standard + HA
T3 based on 6x ema, sma, rma, wma, alma, swma, vwma
Adds up to 7 different T3 on chart
Consider a tip in ETH to
0xac290B4A721f5ef75b0971F1102e01E1942A4578
Thank you and have a nice day
CryptoJoncis
Tillson Moving Average(ema) TENT3 Moving Average indicator was originally developed by Tim Tillson in 1998/99.
T3 Moving Average is considered as improved and better to traditional moving averages as it is smoother and performs better in trending market conditions.
It offers multiple opportunities when the price is in the state of retracement and therefore allows to minimize your exposed risk and allowing your profits run.
This version provides simple T3 MA
Source options - all standard + HA
T3 based on 6x ema
Can add up to 10 T3 MA on chart
Consider a tip in ETH to
0xac290B4A721f5ef75b0971F1102e01E1942A4578
Thank you and have a nice day
CryptoJoncis

Tillson Moving Average(vwma) singleT3 Moving Average indicator was originally developed by Tim Tillson in 1998/99.
T3 Moving Average is considered as improved and better to traditional moving averages as it is smoother and performs better in trending market conditions.
It offers multiple opportunities when the price is in the state of retracement and therefore allows to minimize your exposed risk and allowing your profits run.
This version provides simple T3 MA
Source options - all standard + HA
T3 based on 6x vwma
Only adds 1 T3 MA on chart
Consider a tip in ETH to
0xac290B4A721f5ef75b0971F1102e01E1942A4578
Thank you and have a nice day
CryptoJoncis

Tillson Moving Average(swma) singleT3 Moving Average indicator was originally developed by Tim Tillson in 1998/99.
T3 Moving Average is considered as improved and better to traditional moving averages as it is smoother and performs better in trending market conditions.
It offers multiple opportunities when the price is in the state of retracement and therefore allows to minimize your exposed risk and allowing your profits run.
This version provides simple T3 MA
Source options - all standard + HA
T3 based on 6x swma
Only adds 1 T3 MA on chart
Consider a tip in ETH to
0xac290B4A721f5ef75b0971F1102e01E1942A4578
Thank you and have a nice day
CryptoJoncis

Tillson Moving Average(alma) singleT3 Moving Average indicator was originally developed by Tim Tillson in 1998/99.
T3 Moving Average is considered as improved and better to traditional moving averages as it is smoother and performs better in trending market conditions.
It offers multiple opportunities when the price is in the state of retracement and therefore allows to minimize your exposed risk and allowing your profits run.
This version provides simple T3 MA
Source options - all standard + HA
T3 based on 6x alma
Only adds 1 T3 MA on chart
Consider a tip in ETH to
0xac290B4A721f5ef75b0971F1102e01E1942A4578
Thank you and have a nice day
CryptoJoncis

Tillson Moving Average(wma) singleT3 Moving Average indicator was originally developed by Tim Tillson in 1998/99.
T3 Moving Average is considered as improved and better to traditional moving averages as it is smoother and performs better in trending market conditions.
It offers multiple opportunities when the price is in the state of retracement and therefore allows to minimize your exposed risk and allowing your profits run.
This version provides simple T3 MA
Source options - all standard + HA
T3 based on 6x wma
Only adds 1 T3 MA on chart
Consider a tip in ETH to
0xac290B4A721f5ef75b0971F1102e01E1942A4578
Thank you and have a nice day
CryptoJoncis

Tillson Moving Average(rma) singleT3 Moving Average indicator was originally developed by Tim Tillson in 1998/99.
T3 Moving Average is considered as improved and better to traditional moving averages as it is smoother and performs better in trending market conditions.
It offers multiple opportunities when the price is in the state of retracement and therefore allows to minimize your exposed risk and allowing your profits run.
This version provides simple T3 MA
Source options - all standard + HA
T3 based on 6x rma
Only adds 1 T3 MA on chart
Consider a tip in ETH to
0xac290B4A721f5ef75b0971F1102e01E1942A4578
Thank you and have a nice day
CryptoJoncis

Tillson Moving Average(sma) singleT3 Moving Average indicator was originally developed by Tim Tillson in 1998/99.
T3 Moving Average is considered as improved and better to traditional moving averages as it is smoother and performs better in trending market conditions.
It offers multiple opportunities when the price is in the state of retracement and therefore allows to minimize your exposed risk and allowing your profits run.
This version provides simple T3 MA
Source options - all standard + HA
T3 based on 6x sma
Only adds 1 T3 MA on chart
Consider a tip in ETH to
0xac290B4A721f5ef75b0971F1102e01E1942A4578
Thank you and have a nice day
CryptoJoncis
Tillson Moving Average(ema) singleT3 Moving Average indicator was originally developed by Tim Tillson in 1998/99.
T3 Moving Average is considered as improved and better to traditional moving averages as it is smoother and performs better in trending market conditions.
It offers multiple opportunities when the price is in the state of retracement and therefore allows to minimize your exposed risk and allowing your profits run.
This version provides simple T3 MA
Source options - all standard + HA
T3 based on 6x ema
Only adds 1 T3 MA on chart
Consider a tip in ETH to
0xac290B4A721f5ef75b0971F1102e01E1942A4578
Thank you and have a nice day
CryptoJoncis
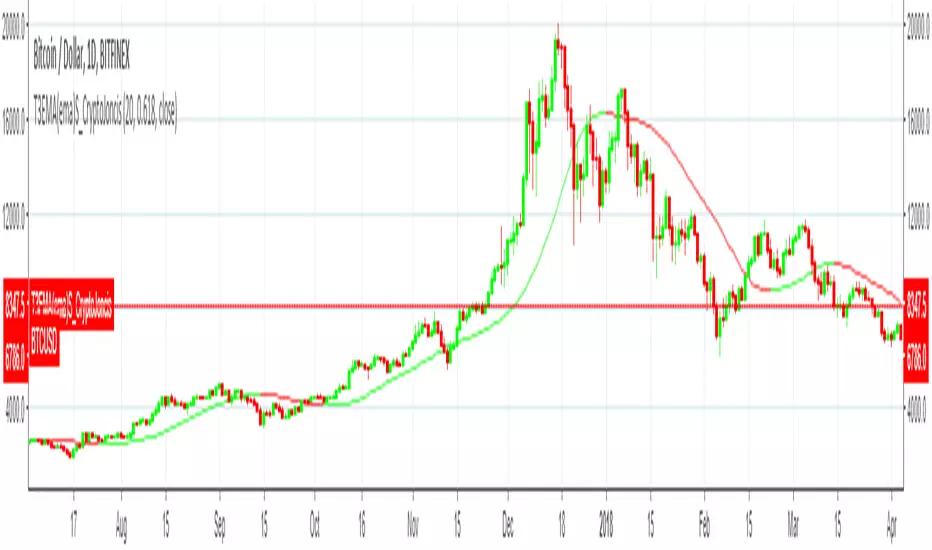

Tillson T3 Moving Average by KIVANÇ fr3762Developed by Tim Tillson, the T3 Moving Average is considered superior to traditional moving averages as it is smoother, more responsive and thus performs better in ranging market conditions as well. However, it bears the disadvantage of overshooting the price as it attempts to realign itself to current market conditions.
It incorporates a smoothing technique which allows it to plot curves more gradual than ordinary moving averages and with a smaller lag. Its smoothness is derived from the fact that it is a weighted sum of a single EMA , double EMA , triple EMA and so on. When a trend is formed, the price action will stay above or below the trend during most of its progression and will hardly be touched by any swings. Thus, a confirmed penetration of the T3 MA and the lack of a following reversal often indicates the end of a trend.
The T3 Moving Average generally produces entry signals similar to other moving averages and thus is traded largely in the same manner. Here are several assumptions:
If the price action is above the T3 Moving Average and the indicator is headed upward, then we have a bullish trend and should only enter long trades (advisable for novice/intermediate traders). If the price is below the T3 Moving Average and it is edging lower, then we have a bearish trend and should limit entries to short. Below you can see it visualized in a trading platform.
Although the T3 MA is considered as one of the best swing following indicators that can be used on all time frames and in any market, it is still not advisable for novice/intermediate traders to increase their risk level and enter the market during trading ranges (especially tight ones). Thus, for the purposes of this article we will limit our entry signals only to such in trending conditions.
Once the market is displaying trending behavior, we can place with-trend entry orders as soon as the price pulls back to the moving average (undershooting or overshooting it will also work). As we know, moving averages are strong resistance/support levels, thus the price is more likely to rebound from them and resume its with-trend direction instead of penetrating it and reversing the trend.
And so, in a bull trend, if the market pulls back to the moving average, we can fairly safely assume that it will bounce off the T3 MA and resume upward momentum, thus we can go long. The same logic is in force during a bearish trend .
And last but not least, the T3 Moving Average can be used to generate entry signals upon crossing with another T3 MA with a longer trackback period (just like any other moving average crossover). When the fast T3 crosses the slower one from below and edges higher, this is called a Golden Cross and produces a bullish entry signal. When the faster T3 crosses the slower one from above and declines further, the scenario is called a Death Cross and signifies bearish conditions.
I Personally added a second T3 line with a volume factor of 0.618 (Fibonacci Ratio) and length of 3 (fibonacci number) which can be added by selecting the box in the input section. traders can combine the two lines to have Buy/Sell signals from the crosses.
Developed by Tim Tillson
T3 Moving AverageT3 Moving Average indicator script based on the article `Smoothing Techniques For More Accurate Signals` by Tim Tillson (Stocks & Commodities V16:1 (33-37))
