Market Sessions V2🔄 MAJOR UPDATE v2.0
✨ NEW FEATURES:
- Live Info Panel with session status, timer, range & change%
- Average range statistics (based on history period)
- Weekend mode highlighting (Fri US Close → Mon Asia Open)
- Pre-market & Post-market tracking for US session (table only)
- Auto/Manual session times with validation
🔧 IMPROVEMENTS:
- Accurate official exchange hours (TSE 09:00-15:30, LSE 08:00-16:30, NYSE 09:30-16:00, ASX 10:00-16:00)
- Automatic DST handling via native timezones
- Tokyo Lunch Break indicator (11:30-12:30 JST)
- Works on all timeframes with smart adaptation (boxes ≤4H, table always)
- Bar Replay compatible
🛡️ RELIABILITY:
- Input validation for manual time entries
- Graceful handling of higher timeframes
- Optimized memory management
📖 For Forex/Crypto traders: Sessions show continuous trading hours.
Tokyo lunch (11:30-12:30 JST) is indicated in table only.
Timezone

V-Max: Tactical Clock & Price (Master Fit)Overview
The V-Max Tactical Clock & Price is a high-visibility utility dashboard engineered for precision execution in global financial markets. It serves as a "Physical Timezone Navigator," providing real-time price tracking and synchronized local time display directly on the chart. This ensures traders can align their execution with specific market openings and closing volatility regardless of the exchange's default timezone.
Core Technical Logic & Features
This script focuses on the physics of time-alignment and visual stability:
Physical Time Calibration Engine: Unlike standard UI clocks, this script employs a millisecond-level compensation engine using the formula: $timenow + (tz\_offset \times 60 \times 60 \times 1000)$. This allows for precise synchronization with any global market (e.g., London, New York, or Asia sessions).
Momentum-Driven Price Rendering: The price display utilizes conditional coloring logic ($close \ge open ? up\_col : dn\_col$) to provide immediate visual feedback on the current bar's momentum.
High-Identifiability UI (Master Fit): Leverages the table.new titan rendering engine with size.huge font specifications for the price. This ensures critical data remains readable even on small mobile screens or high-density multi-chart layouts.
Anti-Flicker Monospaced Formatting: Employs font.family_monospace to ensure strict numerical alignment, preventing visual flickering or "jumping" during periods of extreme market volatility.
How to Use
Timezone Setup: Enter your local GMT offset (e.g., +8 for Taiwan/Singapore, -5 for New York) in the settings.
Visual Customization: Adjust the dashboard position (default: Bottom Left) and background aesthetics to fit your professional trading workspace.
產品概述
V-Max 戰術時鐘與價格顯示器是一款為全球市場設計的高辨識度工具。它作為一個實時的「全球時區導航儀」,在圖表上直接提供實時價格追蹤與同步化的本地時間顯示,確保交易者能精確對齊各國市場開盤瞬間的波動。
核心技術邏輯與功能物理時間校準引擎:採用毫秒級時間補償運算,公式為:$timenow + (tz\_offset \times 60 \times 60 \times 1000)$。這讓交易者能精確校準全球任一交易所的本地時間。
動能價格渲染:價格顯示具備即時漲跌變色邏輯,提供直觀的即時盤感反饋。
特大字體 UI (Master Fit):採用 size.huge 字體規格顯示價格,確保在移動端或複雜多圖表布局下依然清晰易讀。
防閃爍等寬格式:使用等寬字體確保數字在劇烈波動時不會產生視覺跳動,維持高度的讀數穩定性。
Access & Support
This script is published as a Free Public Utility in the TradingView Library. Disclaimer: For educational purposes only. Past performance does not guarantee future results.
Disclaimer: This script is for technical analysis and educational purposes only. It does not provide financial advice.

Forex Session TrackerForex Session Tracker - Professional Trading Session Indicator
The Forex Session Tracker is a comprehensive and visually intuitive indicator designed specifically for forex traders who need precise tracking of major global trading sessions. This powerful tool helps traders identify active market sessions, monitor session-specific price ranges, and capitalize on volatility patterns unique to each trading period.
Understanding when major financial centers are active is crucial for forex trading success. This indicator provides real-time visualization of the Tokyo, London, New York, and Sydney trading sessions, allowing traders to align their strategies with peak liquidity periods and avoid low-volatility trading windows.
---
Key Features
📊 Four Major Global Trading Sessions
The indicator tracks all four primary forex trading sessions with precision:
- Tokyo Session (Asian Market) - Captures the Asian trading hours, ideal for JPY, AUD, and NZD pairs
- London Session (European Market) - Monitors the most liquid trading period, perfect for EUR, GBP pairs
- New York Session (American Market) - Tracks US market hours, essential for USD-based currency pairs
- Sydney Session (Pacific Market) - Identifies the opening of the trading week and AUD/NZD activity
Each session is fully customizable with individual color schemes, making it easy to distinguish between different market periods at a glance.
🎯 Session Range Visualization
For each active trading session, the indicator automatically:
- Draws rectangular boxes that highlight the session's time period
- Tracks and displays session HIGH and LOW price levels in real-time
- Creates horizontal lines at session extremes for easy reference
- Positions session labels at the center of each trading period
- Updates dynamically as new highs or lows are formed within the session
This visual approach helps traders quickly identify:
- Session breakout opportunities
- Support and resistance zones formed during specific sessions
- Range-bound vs. trending session behavior
- Key price levels that institutional traders are watching
📱 Live Information Dashboard
A sleek, professional information panel displays:
- Real-time session status - Instantly see which sessions are currently active
- Color-coded indicators - Green dots for active sessions, gray for closed sessions
- Timezone information - Confirms your current timezone settings
- Customizable positioning - Place the dashboard anywhere on your chart (Top Left, Top Right, Bottom Left, Bottom Right)
- Adjustable size - Choose from Tiny, Small, Normal, or Large text sizes for optimal visibility
The dashboard provides at-a-glance awareness of market conditions without cluttering your chart analysis.
⚙️ Extensive Customization Options
Every aspect of the indicator can be tailored to your trading preferences:
Session-Specific Controls:
- Enable/disable individual sessions
- Customize colors for each trading period
- Adjust session times to match your broker's server time
- Toggle background highlighting on/off
- Show/hide session high/low lines independently
General Settings:
- UTC Offset Control - Adjust timezone from UTC-12 to UTC+14
- Exchange Timezone Option - Automatically use your chart's exchange timezone
- Background Transparency - Fine-tune the opacity of session highlighting (0-100%)
- Session Labels - Show or hide session name labels
- Information Panel - Toggle the live status dashboard on/off
Style Settings:
- Turn session backgrounds ON/OFF directly from the Style tab
- Maintain clean charts while keeping all analytical features active
🔔 Built-in Alert System
Stay informed about session openings with customizable alerts:
- Tokyo Session Started
- London Session Started
- New York Session Started
- Sydney Session Started
Set up notifications to never miss important market opening periods, even when you're away from your charts.
---
How to Use This Indicator
For Day Traders:
1. Identify High-Volatility Periods - Focus your trading during London and New York session overlaps for maximum liquidity
2. Monitor Session Breakouts - Watch for price breaks above/below session highs and lows
3. Avoid Low-Volume Periods - Recognize when major sessions are closed to avoid false signals
For Swing Traders:
1. Mark Key Levels - Use session highs and lows as support/resistance zones
2. Track Multi-Session Patterns - Observe how price behaves across different trading sessions
3. Plan Entry/Exit Points - Time your trades around session openings for better execution
For Currency-Specific Traders:
1. JPY Pairs - Focus on Tokyo session movements
2. EUR/GBP Pairs - Monitor London session activity
3. USD Pairs - Track New York session volatility
4. AUD/NZD Pairs - Watch Sydney and Tokyo sessions
---
Technical Specifications
- Pine Script Version: 5
- Overlay Indicator: Yes (displays directly on price chart)
- Maximum Bars Back: 500
- Drawing Objects: Up to 500 lines, boxes, and labels
- Performance: Optimized for real-time data processing
- Compatibility: Works on all timeframes (recommended: 5m to 1H for session tracking)
---
Installation & Setup
1. Add to Chart - Click "Add to Chart" after copying the script to Pine Editor
2. Configure Timezone - Set your UTC offset or enable "Use Exchange Timezone"
3. Customize Colors - Choose your preferred color scheme for each session
4. Adjust Display - Enable/disable features based on your trading style
5. Set Alerts - Create alert notifications for session starts
---
Best Practices
✅ Combine with Price Action - Use session ranges alongside candlestick patterns for confirmation
✅ Watch Session Overlaps - The London-New York overlap (1300-1600 UTC) typically shows highest volatility
✅ Respect Session Highs/Lows - These levels often act as intraday support and resistance
✅ Adjust for Your Broker - Verify session times match your broker's server clock
✅ Use Multiple Timeframes - View sessions on both lower (15m) and higher (1H) timeframes for context
---
Why Choose Forex Session Tracker Pro?
✨ Professional Grade Tool - Built with clean, efficient code following TradingView best practices
✨ Beginner Friendly - Intuitive design with clear visual cues
✨ Highly Customizable - Adapt every feature to match your trading style
✨ Performance Optimized - Lightweight code that won't slow down your charts
✨ Actively Maintained - Regular updates and improvements
✨ No Repainting - All visual elements are fixed once the session completes
---
Support & Updates
This indicator is designed to provide reliable, accurate session tracking for forex traders of all experience levels. Whether you're a scalper looking for high-volatility windows or a position trader marking key institutional levels, the Forex Session Tracker Pro delivers the insights you need to make informed trading decisions.
Happy Trading! 📈
---
Disclaimer
This indicator is a tool for technical analysis and should be used as part of a comprehensive trading strategy. Past performance does not guarantee future results. Always practice proper risk management and never risk more than you can afford to lose. Trading forex carries a high level of risk and may not be suitable for all investors.

Market SessionsMarket Sessions (Asian, London, NY, Pacific)
Summary
This indicator plots the main global market sessions (Asian, European, American, Pacific) as boxes on your chart, complete with dynamic high/low tracking.
It's an essential tool for intraday traders to track session-based volatility patterns and visualize key support/resistance levels (like the Asian Range) that often define price action for the rest of the day.
Who it’s for
Intraday traders, scalpers, and day traders who need to visualize market hours and session-based ranges. If your strategy depends on the London open, the New York close, or the Asian range, this script will map it out for you.
What it shows
Customizable Session Boxes: Four fully configurable boxes for the Asian, European (London), American (New York), and Pacific (Sydney) sessions.
Session High & Low: The script tracks and boxes the highest high and lowest low of each session, dynamically updating as the session progresses.
Session Labels: Clear labels (e.g., "AS", "EU") mark each session, anchored to the start time.
Key Features
Powerful Timezone Control: This is the core feature.
Use Exchange Timezone (Default): Simply enter session times (e.g., 8:00 for London) relative to the exchange's timezone (e.g., "NASDAQ" or "BINANCE").
Use UTC Offset: Uncheck the box and enter a UTC offset (e.g., +3 or -5). Now, all session times you enter are relative to that specific UTC offset. This gives you full control regardless of the chart you're on.
Fully Customizable: Toggle any session on/off.
Style Control: Change the fill color, border color, transparency, border width, and line style (Solid, Dashed, Dotted) for each session individually.
Smart Labels: Labels stay anchored to the start of the session (no "sliding") and float just above the session high.
Why this helps
Track Volatility & Market Behavior: Visually identify the "personality" of each session. Some sessions might consistently produce powerful pumps or dumps, while others are prone to sideways "chop" or accumulation. This indicator helps you see these repeating patterns.
Find Key Support/Resistance Levels: The High and Low of a session (e.g., the Asian Range) often become critical support and resistance levels for the next session (e.g., London). This script makes it easy to spot these "session-to-session" S/R flips and reactions.
Aid Statistical Analysis: The script provides the core visual data for your statistical research. You can easily track how often the London session breaks the Asian high, or which session is most likely to reverse the trend, helping you build a robust trading plan.
Context is King: Instantly see which market is active, which are overlapping (like the high-volume London-NY overlap), and which have closed.
Quick setup
Go to Timezone Settings.
Decide how you want to enter times:
Easy (Default): Leave Use Exchange Timezone checked. Enter session times based on the chart's native exchange (e.g., for BTC/USDT on Binance, use UTC+0 times).
Manual (Pro): Uncheck Use Exchange Timezone. Enter your UTC Offset (e.g., +2 for Berlin). Now, enter all session times as they appear on the clock in Berlin.
Go to each session tab (Asian, European...) to enable/disable it and set the correct start/end hours and minutes.
Style the colors to match your chart theme.
Disclaimer
For educational/informational purposes only; not financial advice. Trading involves risk—manage it responsibly.

Smart Weekly Lines — Clean & Scroll-Proof (Pine v6)Because your chart deserves structure. Elegant weekly dividers that stay aligned, scroll smoothly, and project future weeks using your wished UTC offset.
Smart Weekly Lines draws precise, full-height vertical lines marking each new week — perfectly aligned to your local UTC offset. It stays clean, smooth, and consistent no matter how far you scroll.
Features
• Accurate weekly boundaries based on your local UTC offset (supports half-hour zones like India +5.5)
• Clean, full-height lines that never cut off with zoom or scroll
• Adjustable color, opacity, width, and style (solid, dashed, dotted)
• Future week projection for planning and alignment
• Optional visibility: show only on Daily and Intraday charts
Works with any market — stocks, crypto, forex, or futures.
Built for traders who value clarity, structure, and precision.
Developed collaboratively with the assistance of ChatGPT under my direction and testing.

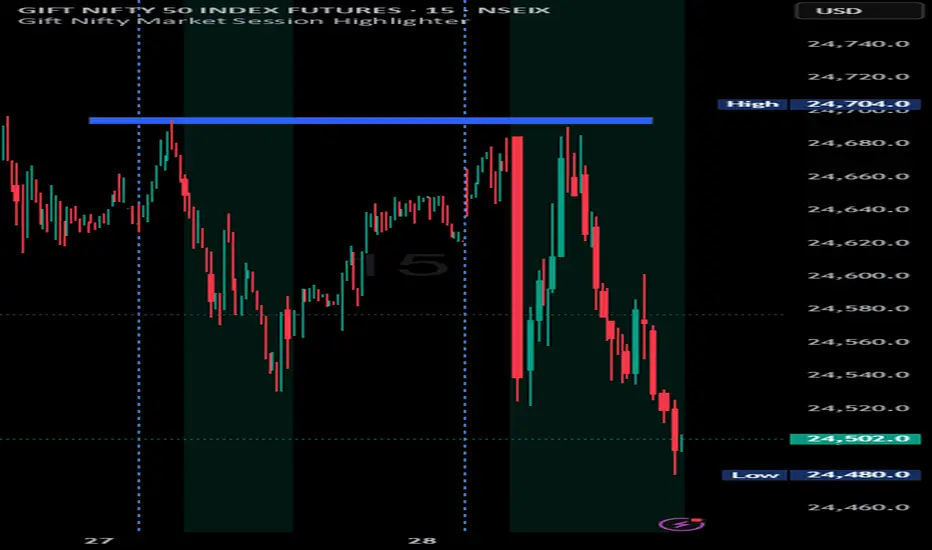
Indian market session on Gift Nifty chartsGift Nifty Market Session Highlighter
This indicator highlights the official Indian market session on Gift Nifty charts — from 9:15 AM to 3:30 PM IST. It shades the background during this time window so traders can instantly identify when the local market is open.
Features:
Marks 9:15 AM to 3:30 PM (IST) session on intraday charts.
Adjustable highlight color and transparency.
Works seamlessly across lower timeframes (1m, 5m, 15m, etc.).
Helps traders align Gift Nifty activity with NSE market hours.
Use Cases:
Quickly distinguish active market hours from overnight or global sessions.
Backtest trading strategies specific to Indian session volatility.
Improv
e focus on expiry-day setups and intraday opportunities.
Disclaimer:
This tool is provided for educational and informational purposes only. It is not financial advice, nor does it guarantee trading success. Always do your own research and consult a licensed financial professional before making investment decisions.
Sessions [New_ProfitEfex]This script is use for displaying session in a very attractive an clarity way
You can give it a try for free

Time Range Marker By BCB ElevateThe Time Range Marker is a simple yet powerful visual tool for traders who want to focus on specific time intervals within the trading day. This indicator highlights a custom time range on your chart using a background color, helping you visually isolate key trading sessions or event windows such as:
Market open/close hours
News release periods
High-volatility trading zones
Personal strategy testing windows
⚙️ Key Features:
Customizable start and end time (hour & minute)
Works across all intraday timeframes
Adjustable highlight color to match your chart theme
Built using Pine Script v5 for speed and flexibility
🔧 Settings:
Start Hour / Minute – Set the beginning of the time range (in 24-hour format)
End Hour / Minute – Define when the range ends
Highlight Color – Choose the background color for better visibility
🕒 Timezone Note:
The indicator uses UTC time by default to ensure accuracy across markets. If your broker uses a different timezone (like EST, IST, etc.), the script can be adjusted to reflect your local market hours.
✅ How to Use the Time Range Marker Indicator
This indicator is used to visually highlight a specific time window each trading day, such as:
Market open or close sessions (e.g., NYSE, London, Tokyo)
High-impact news release periods
Custom time slots for strategy testing or scalping
🛠️ Installation Steps
Open TradingView and go to any chart.
Click on Pine Editor at the bottom of the screen.
Copy and paste the full Pine Script (shared above) into the editor.
Click the “Add to Chart” ▶️ button.
The indicator will appear on the chart with a highlighted background during the time range you set.
⚙️ How to Customize the Time Range
After adding the indicator:
Click the gear icon ⚙️ next to the indicator’s name on the chart.
Adjust the following settings:
Start Hour / Start Minute: The beginning of your time range (in 24-hour format).
End Hour / End Minute: When the highlight should stop.
Highlight Color: Pick a color and transparency for visual clarity.
Click OK to apply changes.
🕒 Timezone Consideration
By default, the indicator uses UTC (Coordinated Universal Time).
To match your broker’s timezone (e.g., EST, IST, etc.), you'll need to adjust the script by changing:
sessStart = timestamp("Etc/UTC", ...)
sessEnd = timestamp("Etc/UTC", ...)
to your correct timezone, like "Asia/Kolkata" for IST or "America/New_York" for EST.
Let me know your broker or local timezone, and I’ll update it for you.
📈 Tips for Traders
Combine this with volume, price action, or breakout indicators to focus your strategy on high-probability time windows.
Use multiple versions of this script if you want to highlight more than one time range in a day.

TimezoneFormatIANAUTCLibrary "TimezoneFormatIANAUTC"
Provides either the full IANA timezone identifier or the corresponding UTC offset for TradingView’s built-in variables and functions.
tz(_tzname, _format)
Parameters:
_tzname (string) : "London", "New York", "Istanbul", "+1:00", "-03:00" etc.
_format (string) : "IANA" or "UTC"
Returns: "Europe/London", "America/New York", "UTC+1:00"
Example Code
import ARrowofTime/TimezoneFormatIANAUTC/1 as libtz
sesTZInput = input.string(defval = "Singapore", title = "Timezone")
example1 = libtz.tz("London", "IANA") // Return Europe/London
example2 = libtz.tz("London", "UTC") // Return UTC+1:00
example3 = libtz.tz("UTC+5", "IANA") // Return UTC+5:00
example4 = libtz.tz("UTC+4:30", "UTC") // Return UTC+4:30
example5 = libtz.tz(sesTZInput, "IANA") // Return Asia/Singapore
example6 = libtz.tz(sesTZInput, "UTC") // Return UTC+8:00
sesTime1 = time("","1300-1700", example1) // returns the UNIX time of the current bar in session time or na
sesTime2 = time("","1300-1700", example2) // returns the UNIX time of the current bar in session time or na
sesTime3 = time("","1300-1700", example3) // returns the UNIX time of the current bar in session time or na
sesTime4 = time("","1300-1700", example4) // returns the UNIX time of the current bar in session time or na
sesTime5 = time("","1300-1700", example5) // returns the UNIX time of the current bar in session time or na
sesTime6 = time("","1300-1700", example6) // returns the UNIX time of the current bar in session time or na
Parameter Format Guide
This section explains how to properly format the parameters for the tz(_tzname, _format) function.
_tzname (string) must be either;
A valid timezone name exactly as it appears in the chart’s lower-right corner (e.g. New York, London).
A valid UTC offset in ±H:MM or ±HH:MM format. Hours: 0–14 (zero-padded or not, e.g. +1:30, +01:30, -0:00). Minutes: Must be 00, 15, 30, or 45
examples;
"New York" → ✅ Valid chart label
"London" → ✅ Valid chart label
"Berlin" → ✅ Valid chart label
"America/New York" → ❌ Invalid chart label. (Use "New York" instead)
"+1:30" → ✅ Valid offset with single-digit hour
"+01:30" → ✅ Valid offset with zero-padded hour
"-05:00" → ✅ Valid negative offset
"-0:00" → ✅ Valid zero offset
"+1:1" → ❌ Invalid (minute must be 00, 15, 30, or 45)
"+2:50" → ❌ Invalid (minute must be 00, 15, 30, or 45)
"+15:00" → ❌ Invalid (hour must be 14 or below)
_tztype (string) must be either;
"IANA" → returns full IANA timezone identifier (e.g. "Europe/London"). When a time function call uses an IANA time zone identifier for its timezone argument, its calculations adjust automatically for historical and future changes to the specified region’s observed time, such as daylight saving time (DST) and updates to time zone boundaries, instead of using a fixed offset from UTC.
"UTC" → returns UTC offset string (e.g. "UTC+01:00")

Hourly Volatility Explorer📊 Hourly Volatility Explorer: Master The Market's Pulse
Unlock the hidden rhythms of price action with this sophisticated volatility analysis tool. The Hourly Volatility Explorer reveals the most potent trading hours across multiple time zones, giving you a strategic edge in timing your trades.
🌟 Key Features:
⏰ Multi-Timezone Analysis
• GMT (UTC+0)
• EST (UTC-5) - New York
• BST (UTC+1) - London
• JST (UTC+9) - Tokyo
• AEST (UTC+10) - Sydney
Perfect for tracking major market sessions and their overlaps!
📈 Dynamic Visualization
• Color-gradient hourly bars for instant pattern recognition
• Real-time volatility comparison
• Interactive data table with comprehensive statistics
• Automatic highlighting of peak volatility periods
🎯 Strategic Applications:
Day Trading:
• Identify optimal trading windows
• Avoid low-liquidity periods
• Capitalize on session overlaps
• Fine-tune entry/exit timing
Risk Management:
• Set appropriate stop losses based on hourly volatility
• Adjust position sizes for different market hours
• Optimize risk-reward ratios
• Plan around high-impact hours
Global Market Analysis:
• Track volatility across all major sessions
• Spot institutional trading patterns
• Identify quiet vs. active periods
• Monitor 24/7 market dynamics
💡 Perfect For:
• Forex traders navigating global sessions
• Crypto traders in 24/7 markets
• Day traders optimizing execution times
• Algorithmic traders fine-tuning strategies
• Risk managers calibrating exposure
📊 Advanced Features:
• Rolling 3-month analysis for reliable patterns
• Precise pip movement calculations
• Sample size tracking for statistical validity
• Real-time current hour comparison
• Color-coded visual system for instant insights
⚡ Pro Trading Tips:
• Use during major session overlaps for maximum opportunity
• Compare patterns across different instruments
• Combine with volume analysis for deeper insights
• Track seasonal variations in hourly patterns
• Build trading schedules around peak hours
🎓 Educational Value:
• Understand market microstructure
• Learn global market dynamics
• Master timezone relationships
• Develop timing intuition
🛠️ Customization:
• Adjustable lookback period
• Flexible pip multiplier
• Multiple timezone options
• Visual preference settings
Whether you're scalping the 1-minute chart or managing longer-term positions, the Hourly Volatility Explorer provides the precise timing intelligence needed for today's global markets.
Transform your trading schedule from guesswork to science. Know exactly when markets move, why they move, and how to position yourself for maximum opportunity.
#TechnicalAnalysis #Trading #Volatility #MarketTiming #DayTrading #Forex #Crypto #TradingView #PineScript #MarketAnalysis #TradingStrategy #RiskManagement #GlobalMarkets #FinancialMarkets #TradingTools #MarketStructure #PriceAction #Scalping #SwingTrading #AlgoTrading

Personal Time Zone: Days of WeekThis is probably the simplest indicator I have ever made.
It just gives you a the days of weeks in your specified time zone and puts the day on the first bar in your time zone.
You can use UTC time format or named time zones like the default.
Just for fun I tried to give it symbols that sort of relate the old gods that the days of week were named after and even colors that one could argue match, but it was all in fun because it was so simple I felt I had to add something.
Enjoy.

TimezoneLibrary with pre-defined timezone enums that can be used to request a timezone input from the user. The library provides a `tostring()` function to convert enum values to a valid string that can be used as a `timezone` parameter in pine script built-in functions. The library also includes a bonus function to get a formatted UTC offset from a UNIX timestamp.
The timezone enums in this library were compiled by referencing the available timezone options from TradingView chart settings as well as multiple Wikipedia articles relating to lists of time zones.
Some enums from this library are used to retrieve an IANA time zone identifier, while other enums only use UTC/GMT offset notation. It is important to note that the Pine Script User Manual recommends using IANA notation in most cases.
HOW TO USE
This library is intended to be used by Pine Coders who wish to provide their users with a simple way to input a timezone. Using this library is as easy as 1, 2, 3:
Step 1
Import the library into your script. Replace with the latest available version number for this library.
//@version=6
indicator("Example")
import n00btraders/Timezone/ as tz
Step 2
Select one of the available enums from the library and use it as an input. Tip: view the library source code and scroll through the enums at the top to find the best choice for your script.
timezoneInput = input.enum(tz.TimezoneID.EXCHANGE, "Timezone")
Step 3
Convert the user-selected input into a valid string that can be used in one of the pine script built-in functions that have a `timezone` parameter.
string timezone = tz.tostring(timezoneInput)
EXPORTED FUNCTIONS
There are multiple 𝚝𝚘𝚜𝚝𝚛𝚒𝚗𝚐() functions in this library: one for each timezone enum. The function takes a single parameter: any enum field from one of the available timezone enums that are exported by this library. Depending on the selected enum, the function will return a time zone string in either UTC/GMT notation or IANA notation.
Note: to avoid confusion with the built-in `str.tostring()` function, it is recommended to use this library's `tostring()` as a method rather than a function:
string timezone = timezoneInput.tostring()
offset(timestamp, format, timezone, prefix, colon)
Formats the time offset from a UNIX timestamp represented in a specified timezone.
Namespace types: series OffsetFormat
Parameters:
timestamp (int) : (series int) A UNIX time.
format (series OffsetFormat) : (series OffsetFormat) A time offset format.
timezone (string) : (series string) A UTC/GMT offset or IANA time zone identifier.
prefix (string) : (series string) Optional 'UTC' or 'GMT' prefix for the result.
colon (bool) : (series bool) Optional usage of colon separator.
Returns: Time zone offset using the selected format.
The 𝚘𝚏𝚏𝚜𝚎𝚝() function is provided as a convenient alternative to manually using `str.format_time()` and then manipulating the result.
The OffsetFormat enum is used to decide the format of the result from the `offset()` function. The library source code contains comments above this enum declaration that describe how each enum field will modify a time offset.
Tip: hover over the `offset()` function call in the Pine Editor to display a pop-up containing:
Function description
Detailed parameter list, including default values
Example function calls
Example outputs for different OffsetFormat.* enum values
NOTES
At the time of this publication, Pine cannot be used to access a chart's selected time zone. Therefore, the main benefit of this library is to provide a quick and easy way to create a pine script input for a time zone (most commonly, the same time zone selected in the user's chart settings).
At the time of the creation of this library, there are 95 Time Zones made available in the TradingView chart settings. If any changes are made to the time zone settings, this library will be updated to match the new changes.
All time zone enums (and their individual fields) in this library were manually verified and tested to ensure correctness.
An example usage of this library is included at the bottom of the source code.
Credits to HoanGhetti for providing a nice Markdown resource which I referenced to be able to create a formatted informational pop-up for this library's `offset()` function.

Globex Trap ZoneGlobex Trap Indicator
A powerful tool designed to identify potential trading opportunities by analyzing the relationship between Globex session ranges and Supply & Demand zones during regular trading hours.
Key Features
Tracks and visualizes Globex session price ranges
Identifies key Supply & Demand zones during regular trading hours
Highlights potential trap areas where price might experience significant reactions
Fully customizable time ranges and visual settings
Clear labeling of Globex highs and lows
How It Works
The indicator tracks two key periods:
Globex Session (Default: 6:00 PM - 9:30 AM)
Monitors overnight price action
Marks session high and low
Helps identify potential range breakouts
Supply & Demand Zone (Default: 8:00 AM - 11:00 AM)
Tracks price action during key market hours
Identifies potential reaction zones
Helps spot institutional trading areas
Best Practices for Using This Indicator
Use on 1-hour timeframe or lower for optimal visualization
Best suited for futures and other instruments traded during Globex sessions
Pay attention to areas where Globex range and Supply/Demand zones overlap
Use in conjunction with your existing trading strategy for confirmation
Recommended minimum of 10 days of historical data for context
Settings Explanation
Globex Session: Customizable time range for overnight trading session
Supply & Demand Zone: Adjustable time range for regular trading hours
Days to Look Back: Number of historical days to display (default: 10)
Visual Settings: Customizable colors and transparency for both zones
Important Notes
All times are based on exchange timezone
The indicator respects overnight sessions and properly handles timezone transitions
Historical data requirements: Minimum 10 days recommended
Performance impact: Optimized for smooth operation with minimal resource usage
Disclaimer
Past performance is not indicative of future results. This indicator is designed to be used as part of a comprehensive trading strategy and should not be relied upon as the sole basis for trading decisions.
Updates and Support
I actively maintain this indicator and welcome feedback from the trading community. Please feel free to leave comments or suggestions for improvements.

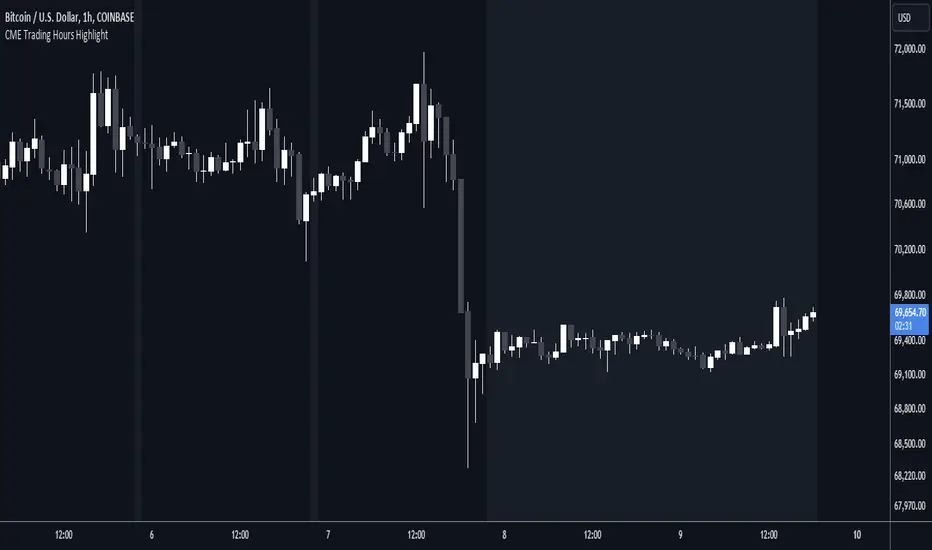
CME Trading Hours HighlightDisplay the times when the CME is or isn't trading, on a non-CME symbol.
The Chicago Mercantile Exchange hours are usually from 17:00 one day to 16:00 the next, with an hour's break. Trading halts from Friday evening to Sunday evening. The exchange is in Chicago.
You might want to display these hours if you trade the same asset on a different exchange. For example, you might want to overlay the CME BTC1! hours on a Coinbase BTC chart to see how trading in these futures contracts affects the market.
Inputs:
Shade Outside Trading Hours - If selected (the default), then the chart background is shaded when the CME is closed. If unselected, the background is shaded when it's open.
Highlight Color - The colour to use for the background shade.
Just for fun, I wanted to publish a useful script that only took up one line 😁
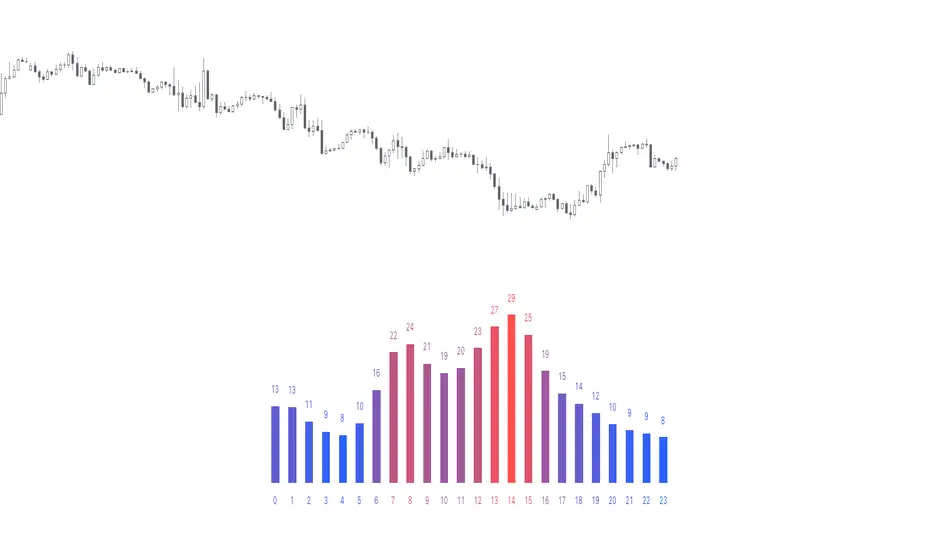
CANDLE STICK HEATMAPCANDLE STICK HEATMAP shows the statistics of a candle at a particular time. its very useful to find repeating pattern's at a particular time in a day.
based on the settings you can see regular repeating patterns of a day in an hourly chart. During a particular time in day there is always a down or up signal or candles.
The table boxes are candles in RED and GREEN based on open and close of the chart. The Heat map is very useful in analyzing the daily Hourly candlesticks in a week. The Time of each candlestick is plotted on the table along with default Indicators like RSI, MACD, EMA, VOLUME, ADX.
Additionally this can be used as a screener of candles on all timeframes. Analysis is easy when you want to see what happened exactly at a particular time in the previous hour, day, month etc.,
Hopefully additional updates will be introduced shortly.
Indicators:
1. MACD (close,12,26,9)
2.RSI (close,14)
3.EMA 200
3.Volume MA
Option is provided to show indicator statistics and time.
Color can be changed using settings.
Supports all Time Zones

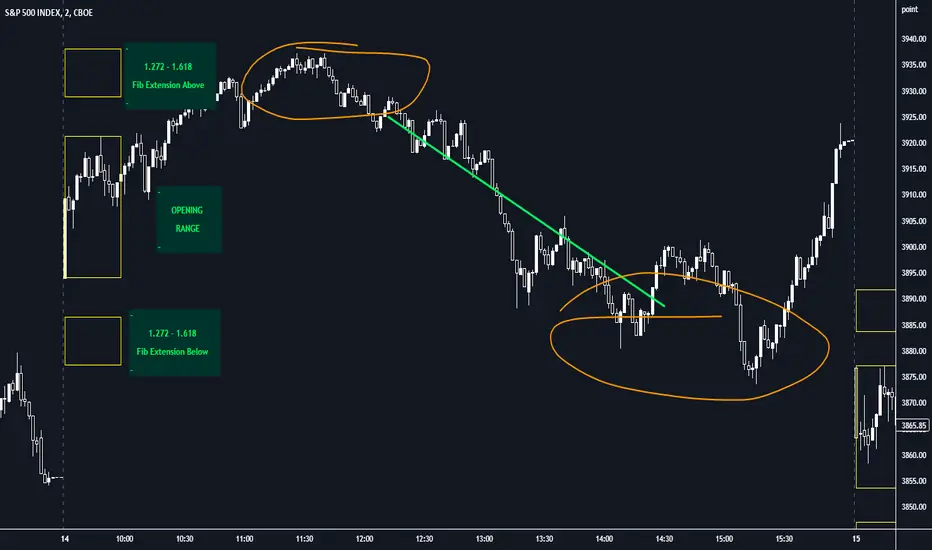
Opening Range with FibsThe indicator uses a time range and another instrument for time reference, so that it works in the time zone you care about. I have set the default to SPX500USD since it is in EST ( SPX , ES and many futures are on Chicago time and opening range gets confused). You can change the reference instrument in the settings.
You can also change the multipliers and use other values instead of 1.272 and 1.618 for Fib extensions.
TradingView has a limit as to how many objects an indicator can create so if you want to go back further for visual backtesting - use the replay tool - it will be able to draw up to the time you selected within its limits.
Let me know if you need anything else...
Happy Trading!
Time of Day - Volatility Report█ OVERVIEW
The indicator analyses the volatility and reports statistics by the time of day.
█ CONCEPTS
Around the world and at various times, different market participants get involved in the markets. How does this affect the market?
Knowing this gets you better prepared and improves your trading. Here are some ideas to explore:
When is the market busy and quiet?
What time is it the most volatile?
Which pairs in your watchlist are moving while you are actively trading?
Should you adjust your trading time? Should you change your trading pairs?
When does your strategy perform the best?
What entry times do your winners have in common? What about the exit times of your losers?
Is it worth keeping your trade open overnight?
Bitcoin (UTC+0)
Gold (UTC+0)
Tesla, Inc. (UTC+0)
█ FEATURES
Selectable time zones
Display the statistics in your geographical time zone (or other market participants), the exchange time zone, or UTC+0.
Configurable outputs
Output the report statistics as mean or median.
█ HOW TO USE
Plot the indicator and visit the 1H timeframe.
█ NOTES
Gaps
The indicator includes the volatility from gaps.
Calculation
The statistics are not reported from absolute prices (does not favor trending markets) nor percentage prices (does not depict the different periods of volatility that markets can go through). Instead, the script uses the prices relative to the average range of previous days (daily ATR).
Extended trading session
The script analyses extended hours when activated on the chart.
Daylight Saving Time (DST)
The exchange time or geographical time zone selected may observe Daylight Saving Time. For example, NASDAQ:TSLA always opens at 9:30 AM New York time but may see different opening times in another part of the globe (New York time corresponds to UTC-4 and UTC-5 during the year).
Session LiquidityThe “Session Liquidity” TradingView indicator by Infinity Trading creates dynamic horizontal lines at the high and low points of a specified time span within the trading day. This indicator gives the user control of three separate time spans so the user can dynamically see the highs and lows of their favorite daily time spans.
Purpose
This indicator is similar to my TradingView indicator “Futures Exchange Sessions 3.0”. In that indicator the user gets control of dynamic price boxes. For me, these boxes made it difficult to spot ICT’s Orderblocks. So instead of boxes I made independently controllable lines and now I can spot ICT Orderblocks and easily identify Liquidity Pools.
Inputs and Style
Everything about the three dynamic lines can but independently configured. Start & End Times, Line Color, Line Style, Line Width, Text Characters, Text Size, Text Color can all be adjusted. The high and low lines as well as their text labels can be individually toggled on or off for maximum control.
Timezone
All of the start and end times are in EST. Additionally, each time span line needs a specific start of each day. This is controlled by a setting called “Line Start Day Timezone” where the user sets a timezone that corresponds with the start time. In general if a timespan resides within a particular Session pick the corresponding timezone. If the users line fits in the Asian Session then choose Asia/Shanghai. If the line is within the London Session then choose Europe/London. And the same goes for the New York Session.
Special Notes
If the Line Start Time is within one candle of the Start Day Timezone in the Settings, then the line/box won’t display. So choose the previous timezone
Lines only display when the timeframe is <= 30 minute
Gallery

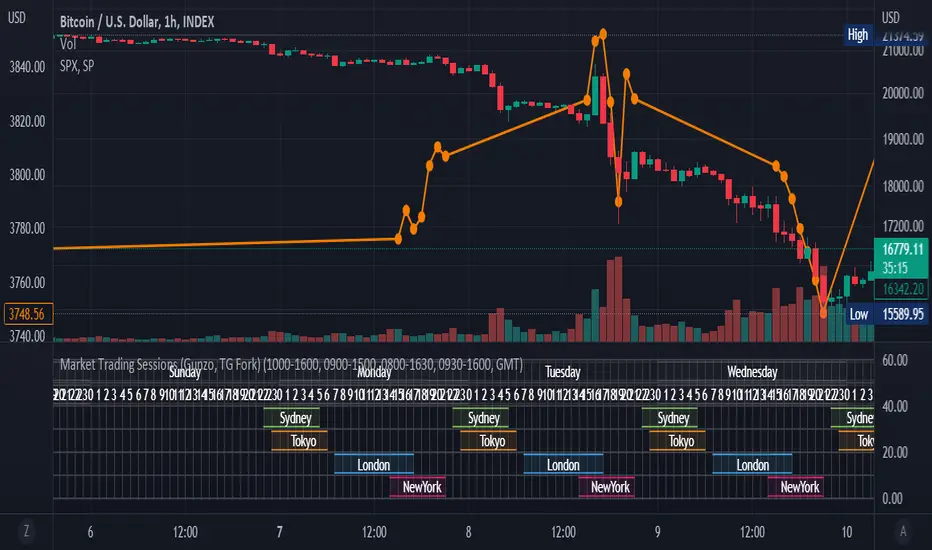
Market Trading Sessions (TG Fork)Visualize trading sessions opening hours of several international exchanges on a grid. Contrary to other indicators, this one automatically aligns the session with the current chart's timezone.
This is helpful for bar replay or manual backtesting, to spot patterns of correlations (this can also be used in conjunction with correlation indicators, see my other indicators).
Original indicator by Gunzo, if you like this indicator, please show the original author some love:
This indicator is also inspired by the following indicators:
ZenAndTheArtOfTrading with
UnknownUnicorn468659 with
This fork implements the following features:
Converted to PineScript v5.
Adapted default color palette to dark mode, as is the default in TradingView now.
Fix drawing issues, now the design shows as it was originally meant to be.
Fixed mistiming issue that made some sessions display with a delay compared to the real session, especially the first session was bar at the start of the session was not displayed.
Inputted the accurate timings for each session, instead of the default 0800-1600 in the original indicator.
Essentially, you can just add this indicator and it should work out of the box. If not, please let me know, and I'll try to fix it!
TCI (TimeZonesIndicator)Problem & Trading Relevance
When people and especially investors and traders wake up, they will very likely check the crypto markets if they are invested. Thus higher volatility can be expected during this time. Also during the opening hours of the stock exchanges higher volatility can be expected.
For people who are checking their crypto portfolio on a daily base and be following the charts, this indicator highlights maybe the most important times of the day.
Implementation
Wake up times are considered as 0700-0900. Stock Exchange hours are considered to be 0900-1000. The daylight saving times are automaticly considered.
Personal comment
Thanks to the community for supporting with so many free to use indicators :D I hope some of you will find it also really helpfull and thus very easy to use and understand.
Greets Julian

Time Sessions - S/RThis scripts shows you some time sessions such as NY open, NY mid, London Open and Daily Close for UTC - 0
It also plots resistance and support based on the last 15 candles but you can change it in settings.

MM Future Session TimesThis script projects the Open/Close of the Asia, UK and US sessions highlighting the Gaps & Deadzone within the market Maker Model.
Dead Zone 5 - 8pm
Asia Gap - 8:00 - 8.30pm | Asia Open 08.30pm | Asia Close 3am
London Gap 3:00 - 3:30am | London Open 3.30am | London Close 9am
US Gap 09:00 - 9.30am | NY Open 9.30am | NY Close 5pm
Note this does not differentiate between the weekend and week day

AltSessionHello World
It’s no secret that trading sessions play a massive role in market movement and liquidity. We can clearly see in the image about how important identifying international trading hours are for a trader.
The Asian session starts around 1am GMT and often has a bearish bias through this session lasting for a few hours, after which Frankfurt and London traders start to come online and can often reverse the Asian sentiment.
The London session is the best session to trade traditionally starting around 7am GMT before the American traders come online and reverse market once again.
We have designed this indicator to help identify different trading hours easily with a background shade on the chart and also high/lows of the training session, as these levels can often be revisited.
We hope you find this indicator useful and please feel free to drop a comment if you have any updates you wish to be made or any future indicator script ideas, thank you.
